. 2020 Apr 3;5(14):8403-8413.
doi: 10.1021/acsomega.0c00271. eCollection 2020 Apr 14.

FT-IR Spectroscopic Analysis of the Secondary Structures Present during the Desiccation Induced Aggregation of Elastin-Like Polypeptide on Silica

Affiliations

FT-IR Spectroscopic Analysis of the Secondary Structures Present during the Desiccation Induced Aggregation of Elastin-Like Polypeptide on Silica

Jared S Cobb et al. ACS Omega. .

Abstract

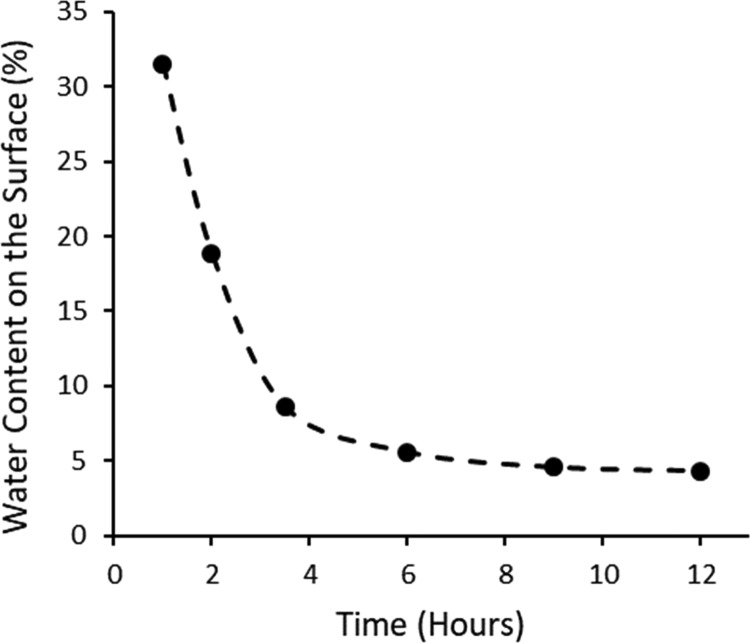
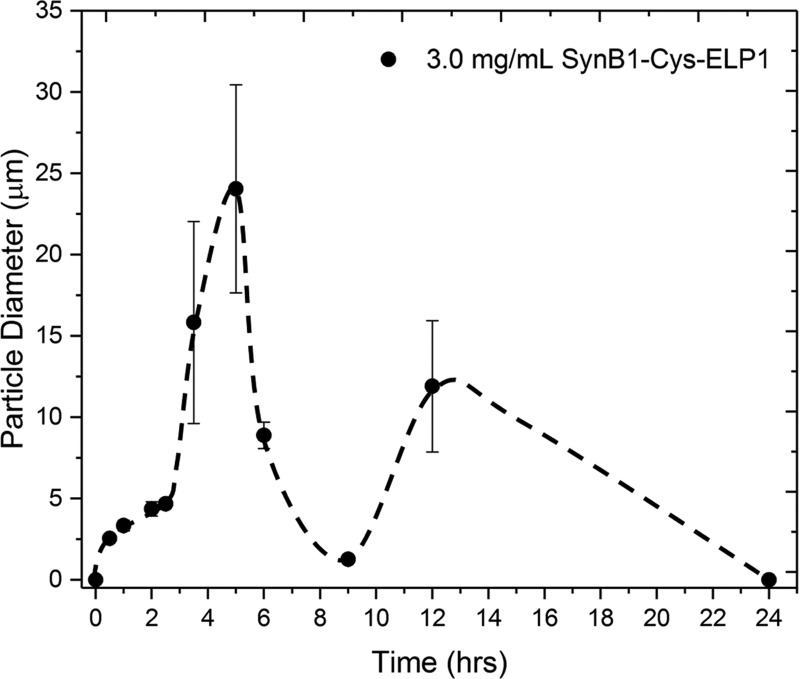
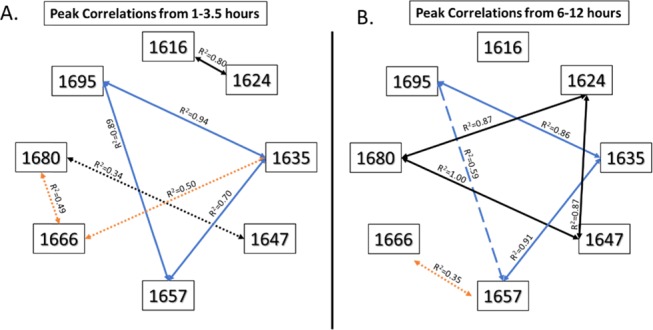
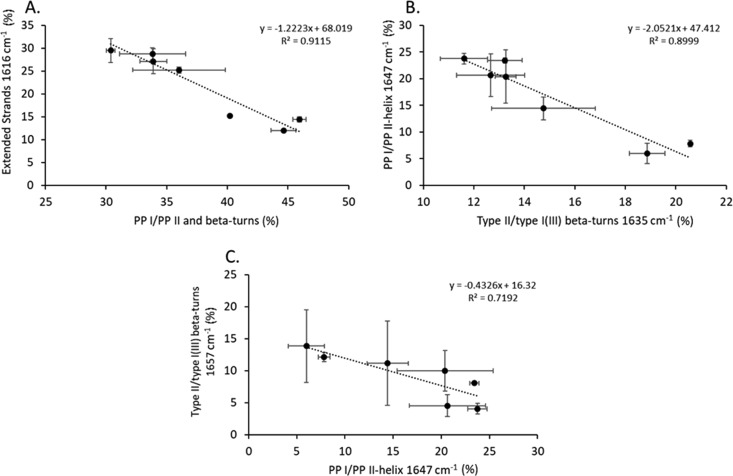
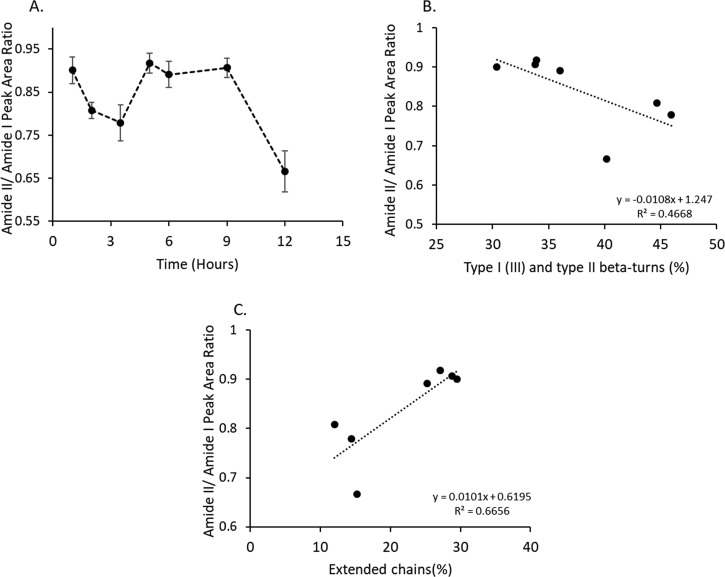
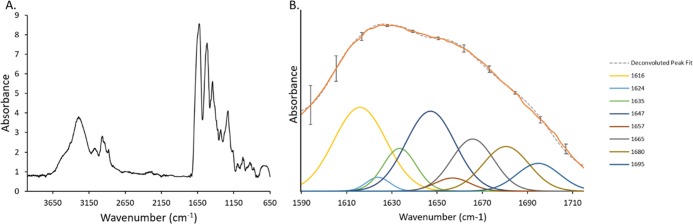
Previously, we found that elastin-like polypeptide (ELP), when dried above the lower critical solution temperature on top of a hydrophilic fused silica disk, exhibited a dynamic coalescence behavior. The ELP initially wet the silica, but over the next 12 h, dewett the surface and formed aggregates of precise sizes and shapes. Using Fourier-transform infrared (FT-IR) spectroscopy, the present study explores the role of secondary structures present in ELP during this progressive desiccation and their effect on aggregate size. The amide I peak (1600-1700 cm-1) in the ELP's FT-IR spectrum was deconvoluted using the second derivative method into eight subpeaks (1616, 1624, 1635, 1647, 1657, 1666, 1680, 1695 cm-1). These peaks were identified to represent extended strands, β-turns, 3(10)-helix, polyproline I, and polyproline II using previous studies on ELP and molecules similar in peptide composition. Positive correlations were established between the various subpeaks, water content, and aggregate size to understand the contributions of the secondary structures in particle formation. The positive correlations suggest that type II β-turns, independent of the water content, contributed to the growth of the aggregates at earlier time points (1-3.5 h). At later time points (6-12 h), the aggregate growth was attributed to the formation of 3(10)-helices that relied on a decrease in water content. Understanding these relationships gives greater control in creating precisely sized aggregates and surface coatings with varying roughness.


Conflict of interest statement

The authors declare no competing financial interest.

Figures

Figure 1
Figure 1
Water content decreases rapidly from 1 to 3.5 h due to evaporation; from 6 to 12 h, the water content remains stable, most likely from secondary interactions between the water, salts, and silica.
Figure 2
Figure 2
Particle diameter measurements were taken at discrete time intervals from scanning microscopy images. Adapted or reprinted in part with permission from Cobb et al.
Figure 3
Figure 3
Positive correlations between peaks at three-time intervals that show a prevailing association between the peaks at 1635, 1657, and 1695 cm–1 (blue lines), which suggests that these peaks rely on each other’s presence to maintain their stability. A dynamic relationship is seen between these three peaks and the one at 1666 cm–1, which indicates a shift in the type of secondary structures being formed. Weak correlations are denoted by dotted lines, moderate correlations by dashed lines, and strong correlations by solid lines. The blue lines indicate the relationship between 1635, 1657, and 1695 cm–1; black lines show the relationship between 1616, 1624, 1647, and 1680 cm–1; orange lines indicate relationships to the peak at 1666 cm–1.
Figure 4
Figure 4
Strong negative correlations were observed between (A) extended strands and PPI/PPII-helix, β-turns; (B) PPI/PPII-helix at 1646 cm–1 and β-turns at 1633 cm–1; (C) β-turns at 1656 cm–1 and PPI/PPII-helix at 1646 cm–1.
Figure 5
Figure 5
(A) Change in the amide II to amide I peak area ratio is associated with a change in secondary structure. (B) Correlations between the amide peak area ratio and secondary structures indicate that an increase in the amide peak area ratio is weakly (R2 = 0.47) associated with a decrease in the total number of β-turns. (C) Increase in the peak area ratio is moderately (R2 = 0.67) correlated to an increase in extended chains.
Figure 6
Figure 6
(A) Full FT-IR spectra taken at the 9 h time point. The amide I and amide II peaks located at 1590–1715 and 1510–1580 cm–1, respectively. (B) The deconvoluted amide I peak at 9 h demonstrating a good agreement between the original and deconvoluted peaks. The mean absolute percent error calculated for each region using the average of three spectra from three independent samples demonstrates that the selected subpeaks did not occur from noise in the spectra.

References

    1. Cho Y.; Zhang Y.; Christensen T.; Sagle L. B.; Chilkoti A.; Cremer P. S. Effects of Hofmeister Anions on the Phase Transition Temperature of Elastin-like Polypeptides. J. Phys. Chem. B 2008, 112, 13765–13771. 10.1021/jp8062977. - DOI - PMC - PubMed
    1. Mackay J. A.; Callahan D. J.; Fitzgerald K. N.; Chilkoti A. Quantitative Model of the Phase Behavior of Recombinant pH-responsive Elastin-like Polypeptides. Biomacromolecules 2010, 11, 2873–2879. 10.1021/bm100571j. - DOI - PMC - PubMed
    1. Dreher M.; Raucher D.; Balu N.; Michael O.; Chilkoti A. Evaluation of an Elastin-like Polypeptide–Doxorubicin Conjugate for Cancer Therapy. J. Controlled Release 2003, 91, 31–43. 10.1016/s0168-3659(03)00216-5. - DOI - PubMed
    1. Meyer D. E.; Shin B. C.; Kong G. A.; Dewhirst M. W.; Chilkoti A. Drug Targeting Using Thermally Responsive Polymers and Local Hyperthermia. J. Controlled Release 2001, 74, 213–224. 10.1016/s0168-3659(01)00319-4. - DOI - PubMed
    1. Lyons D.; Bidwell G. L.; Kramer W. H.; Raucher D.; Correia J. J. Biophysical Characterization of an Elastin-Like-Polypeptide. Biophys. J. 2011, 100, 540a10.1016/j.bpj.2010.12.3148. - DOI