. 2020 May 1;130(5):2644-2656.
doi: 10.1172/JCI128687.

Myeloid-specific Asxl2 deletion limits diet-induced obesity by regulating energy expenditure

Affiliations

Myeloid-specific Asxl2 deletion limits diet-induced obesity by regulating energy expenditure

Wei Zou et al. J Clin Invest. .

Abstract

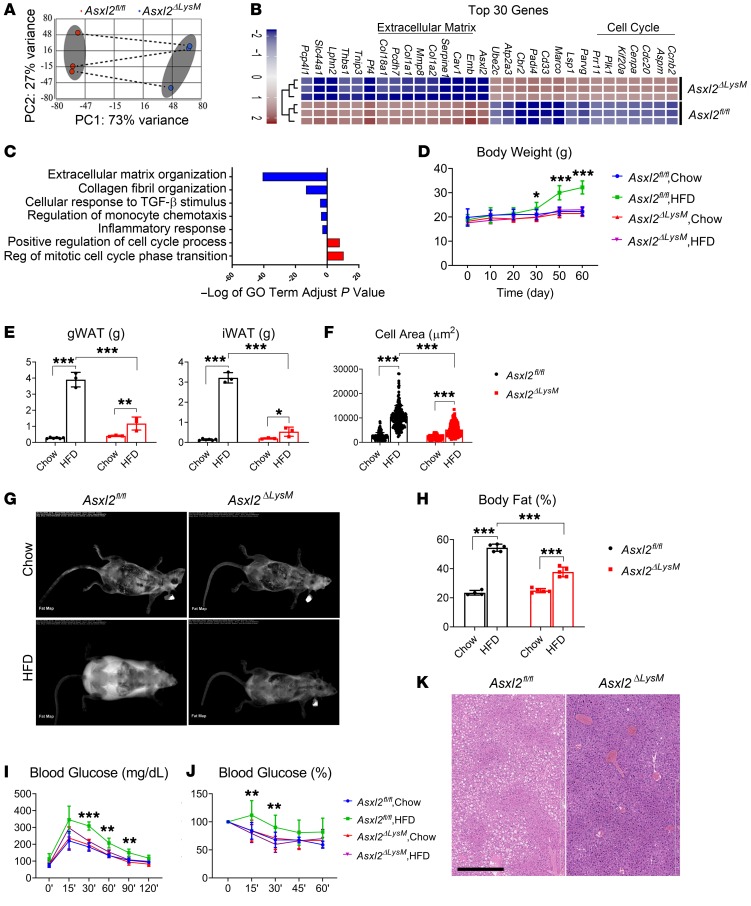
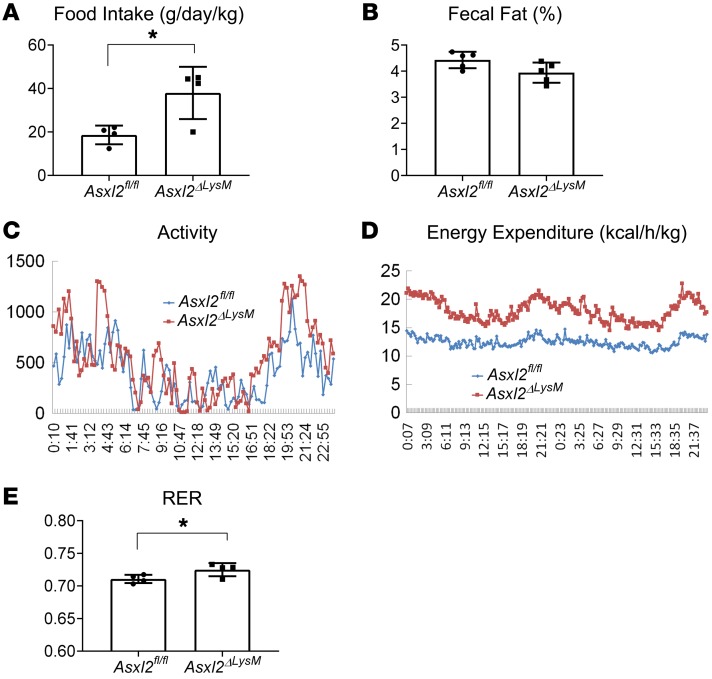
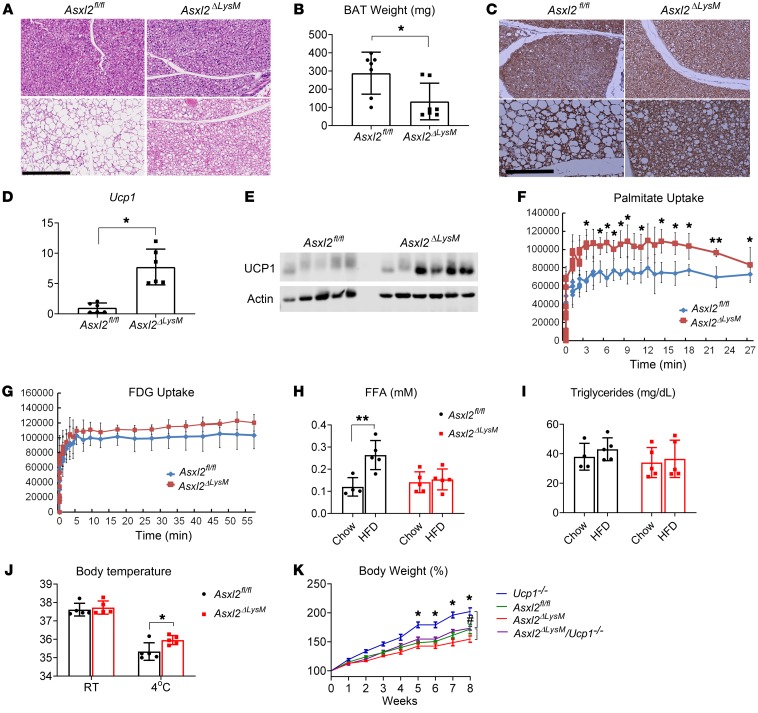
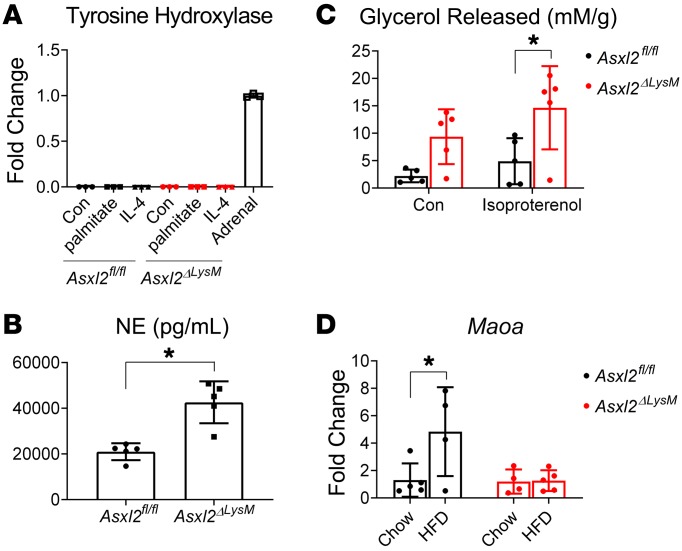
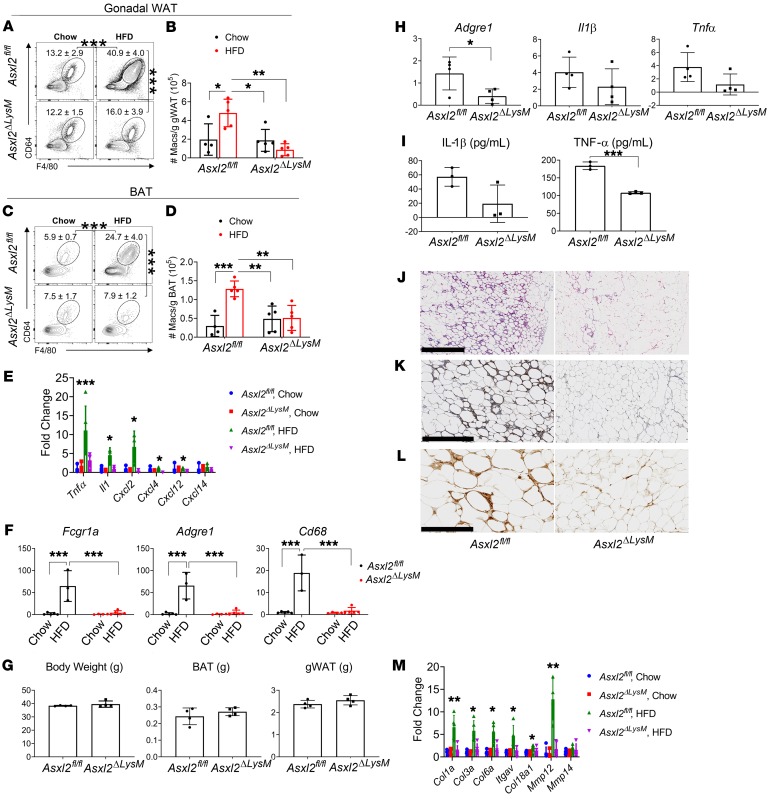
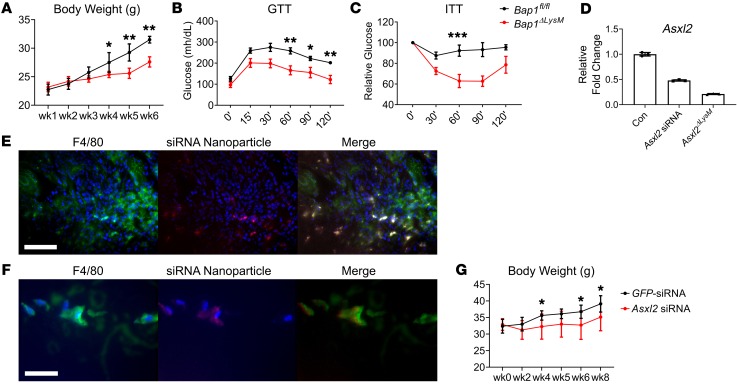
We previously established that global deletion of the enhancer of trithorax and polycomb (ETP) gene, Asxl2, prevents weight gain. Because proinflammatory macrophages recruited to adipose tissue are central to the metabolic complications of obesity, we explored the role of ASXL2 in myeloid lineage cells. Unexpectedly, mice without Asxl2 only in myeloid cells (Asxl2ΔLysM) were completely resistant to diet-induced weight gain and metabolically normal despite increased food intake, comparable activity, and equivalent fecal fat. Asxl2ΔLysM mice resisted HFD-induced adipose tissue macrophage infiltration and inflammatory cytokine gene expression. Energy expenditure and brown adipose tissue metabolism in Asxl2ΔLysM mice were protected from the suppressive effects of HFD, a phenomenon associated with relatively increased catecholamines likely due to their suppressed degradation by macrophages. White adipose tissue of HFD-fed Asxl2ΔLysM mice also exhibited none of the pathological remodeling extant in their control counterparts. Suppression of macrophage Asxl2 expression, via nanoparticle-based siRNA delivery, prevented HFD-induced obesity. Thus, ASXL2 controlled the response of macrophages to dietary factors to regulate metabolic homeostasis, suggesting modulation of the cells' inflammatory phenotype may impact obesity and its complications.

Keywords: Adipose tissue; Macrophages; Metabolism; Obesity.


Conflict of interest statement

Conflict of interest: SAW is equity holder in Trasir Therapeutics, Inc. GM is a consultant for Aclaris Therapeutics, Inc.

Figures

Figure 1
Figure 1. ASXL2 regulates weight gain and metabolic homeostasis.
(AC) RNA-seq analysis of bone marrow macrophages derived from Asxl2fl/fl and Asxl2ΔLysM mice. (A) Principal component analysis of all differentially expressed genes. Shaded ellipses are 95% confidence intervals for each group. (B) Heatmap of the top 30 most differentially expressed genes in macrophages based on log(fold change) > 1.3 with adjusted P < 0.001. (C) Gene Ontology (GO) term analysis of all genes significantly downregulated (negative enrichment, blue bar) or upregulated (positive enrichment, red bar) in Asxl2ΔLysM macrophages. (DK) Two-month-old control and Asxl2ΔLysM mice were fed chow diet or HFD for 8 weeks. (D) Body weight with time. (E) Weight of gonadal WAT (gWAT) and inguinal WAT (iWAT) depots at sacrifice. (F) Size of WAT adipocytes at sacrifice. (G) DXA scans at time of sacrifice. (H) DXA-determined percentage body fat at sacrifice. (I) Glucose tolerance test performed before sacrifice. (J) Insulin tolerance test performed before sacrifice. (K) Hematoxylin and eosin–stained liver of control and Asxl2ΔLysM mice after 8 weeks on HFD. Scale bar: 400 μm. Data are presented as mean ± SD. *P < 0.05; **P < 0.01; ***P < 0.001; as determined by 2-way ANOVA with Holm-Sidak post hoc analysis for multiple comparisons (DF and HJ).
Figure 2
Figure 2. ASXL2 regulates energy expenditure.
(A) Food intake normalized to body weight of HFD-fed Asxl2fl/fl and Asxl2ΔLysM mice. (B) Fecal fat of HFD-fed Asxl2fl/fl and Asxl2ΔLysM mice. HFD-fed Asxl2fl/fl and Asxl2ΔLysM mice were placed in metabolic cages for 48 hours with 12-hour light/dark cycles. (C) Activity, (D) energy expenditure, and (E) respiratory exchange rate (RER) at 48 hours. Data are presented as mean ± SD. *P < 0.05, as determined by unpaired t test (A and E).
Figure 3
Figure 3. BAT is protected in Asxl2ΔLysM mice.
(A) Hematoxylin and eosin–stained histological sections of BAT of Asxl2fl/fl and Asxl2ΔLysM mice after 8 weeks on chow diet or HFD. Scale bar: 300 μm. (B) BAT weight of HFD-fed Asxl2fl/fl and Asxl2ΔLysM mice. (C) UCP1-immunostained histological sections of BAT of Asxl2fl/fl and Asxl2ΔLysM mice after 8 weeks on chow diet or HFD. Scale bar: 200 μm. (D) qPCR analysis of Ucp1 mRNA abundance in Asxl2fl/fl and Asxl2ΔLysM mice after 8 weeks on HFD. (E) Immunoblot of UCP1 abundance in Asxl2fl/fl and Asxl2ΔLysM mice after 8 weeks on HFD. (F and G) PET scan determination of (F) palmitate and (G) fludeoxyglucose metabolism in BAT of Asxl2fl/fl and Asxl2ΔLysM mice after 8 weeks on HFD. (F) Serum free fatty acids (H) and triglycerides (I) of Asxl2fl/fl and Asxl2ΔLysM mice after 8 weeks on chow diet or HFD. (J) Core body temperature of Asxl2fl/fl and Asxl2ΔLysM mice maintained at room temperature (RT, 23°C) or 4° for 30 minutes, after 8 weeks on chow diet or HFD. (K) Two-month-old Ucp1–/–, Asxl2fl/fl, Asxl2ΔLysM, and Asxl2ΔLysM Ucp1–/– mice were fed HFD for 8 weeks at neutral thermal temperature (30°C); body weight change was measured with time. *P < 0.05 for comparisons between Ucp1–/– and Asxl2ΔLysM Ucp1–/–; #P < 0.05 for comparisons between Asxl2ΔLysM and Asxl2ΔLysM Ucp1–/– at 8 weeks of HFD.Data are presented as mean ± SD. *P < 0.05; **P < 0.01; as determined by unpaired t test (B and D) or 2-way ANOVA with Holm-Sidak post hoc analysis for multiple comparisons (F, H, J, and K).
Figure 4
Figure 4. Catecholamines are relatively increased in Asxl2ΔLysM BAT.
(A) Tyrosine hydroxylase mRNA expression by naive and IL-4– or palmitate-treated Asxl2fl/fl and Asxl2ΔLysM BMMs. Adrenal tissue served as positive control. (B) Norepinephrine (NE) content of BAT of HFD-fed control and Asxl2ΔLysM mice. (C) Glycerol released from BAT explants derived from HFD-fed control and Asxl2ΔLysM mice. (D) Maoa mRNA abundance in BAT stromal vascular fraction of chow- or HFD-fed control and Asxl2ΔLysM mice. Data are presented as mean ± SD. *P < 0.05, as determined by unpaired t test (B) or 2-way ANOVA with Holm-Sidak’s post hoc analysis for multiple comparisons (C and D).
Figure 5
Figure 5. ASXL2 expression in myeloid cells is required for macrophage accumulation in WAT and BAT in obesity.
Asxl2fl/fl and Asxl2ΔLysM mice were fed either a chow diet or HFD. (A) Frequencies and (B) numbers of F4/80+CD64+ macrophages in gonadal WAT: pregated on singlet, live, CD45+ cells. (C) Frequencies and (D) numbers of F4/80+CD64+ macrophages in BAT: pregated on singlet, live, CD45+ cells. (E) Inflammatory cytokine and chemokine mRNA expression in stromal vascular fraction of BAT of Asxl2fl/fl or Asxl2ΔLysM mice after 8 weeks fed with chow diet or HFD. (F) Macrophage marker mRNA expression in stromal vascular fraction of BAT of Asxl2fl/fl or ASXL2ΔLysM mice after 8 weeks fed with chow diet or HFD. (G) Body weight and brown or gonadal fat pad weight of Asxl2fl/fl and Asxl2ΔLysM mice after 4 weeks of HFD. (H) Adgre1 (F4/80) and inflammatory cytokine mRNA expression in stromal vascular fraction of BAT of Asxl2fl/fl or Asxl2ΔLysM mice after 4 weeks on HFD. (I) IL-1β and TNF-α secretion by bone marrow–derived macrophages of Asxl2fl/fl or Asxl2ΔLysM mice stimulated with 100 ng/mL LPS for 3 hours, followed by 15 μM nigericin for 1 hour. (JL) Histological sections of WAT of HFD-fed control or Asxl2ΔLysM mice stained to identify (J) fibrosis (hematoxylin and eosin), (K) hypoxic adipocytes, and (L) crown-like structures (F4/80). Scale bars: 1 mm (J), 400 μm (K), and 200 μm (L). (M) ECM gene mRNA expression in gonadal WAT stromal vascular fraction of chow- or HFD-fed Asxl2fl/fl or Asxl2ΔLysM mice. Data are presented as mean ± SD. *P < 0.05; **P < 0.01; ***P < 0.001; as determined by unpaired t test (H and I) or 2-way ANOVA with Holm-Sidak post hoc analysis for multiple comparisons (B, DF, and M).
Figure 6
Figure 6. siRNA-mediated Asxl2 suppression in macrophages prevents diet-induced obesity.
(A) Body weight, (B) glucose tolerance test, and (C) insulin tolerance test of Bap1fl/fl and Bap1ΔLysM mice fed HFD for 6 weeks. (D) WT BMMs were incubated with GFP-siRNA– or Asxl2-siRNA–associated nanoparticles. Asxl2 mRNA was measured by qPCR and compared to that of Asxl2ΔLysM BMMs. Colocalization of macrophages (F4/80) and Asxl2-siRNA–associated nanoparticles in (E) spleen and (F) gonadal WAT of HFD-fed WT mice. Scale bars: 100 μm (E) and 30 μm (F). (G) Body weight of WT HFD-fed mice administered GFP-siRNA– or Asxl2-siRNA–associated nanoparticles. Data are presented as mean ± SD. *P < 0.05; **P < 0.01; ***P < 0.001; as determined by 1-way ANOVA with Holm-Sidak post hoc analysis for multiple comparisons (AC and G).

References

    1. Wellen KE, Hotamisligil GS. Inflammation, stress, and diabetes. J Clin Invest. 2005;115(5):1111–1119. doi: 10.1172/JCI25102. - DOI - PMC - PubMed
    1. Lumeng CN, Bodzin JL, Saltiel AR. Obesity induces a phenotypic switch in adipose tissue macrophage polarization. J Clin Invest. 2007;117(1):175–184. doi: 10.1172/JCI29881. - DOI - PMC - PubMed
    1. Patsouris D, Li PP, Thapar D, Chapman J, Olefsky JM, Neels JG. Ablation of CD11c-positive cells normalizes insulin sensitivity in obese insulin resistant animals. Cell Metab. 2008;8(4):301–309. doi: 10.1016/j.cmet.2008.08.015. - DOI - PMC - PubMed
    1. Izawa T, et al. ASXL2 regulates glucose, lipid, and skeletal homeostasis. Cell Rep. 2015;11(10):1625–1637. doi: 10.1016/j.celrep.2015.05.019. - DOI - PMC - PubMed
    1. Lee KY, et al. Lessons on conditional gene targeting in mouse adipose tissue. Diabetes. 2013;62(3):864–874. doi: 10.2337/db12-1089. - DOI - PMC - PubMed

Publication types

MeSH terms

LinkOut - more resources