. 2020 Jan 1:2020:baaa017.
doi: 10.1093/database/baaa017.

RA-map: building a state-of-the-art interactive knowledge base for rheumatoid arthritis

Affiliations

RA-map: building a state-of-the-art interactive knowledge base for rheumatoid arthritis

Vidisha Singh et al. Database (Oxford). .

Abstract

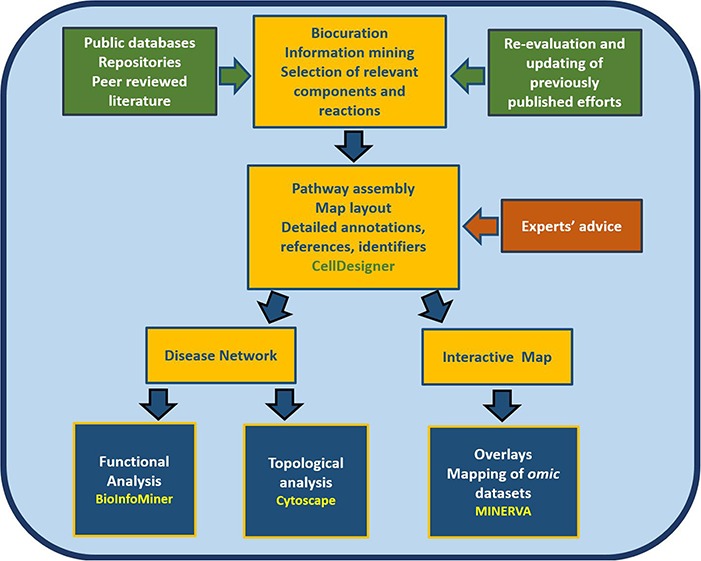
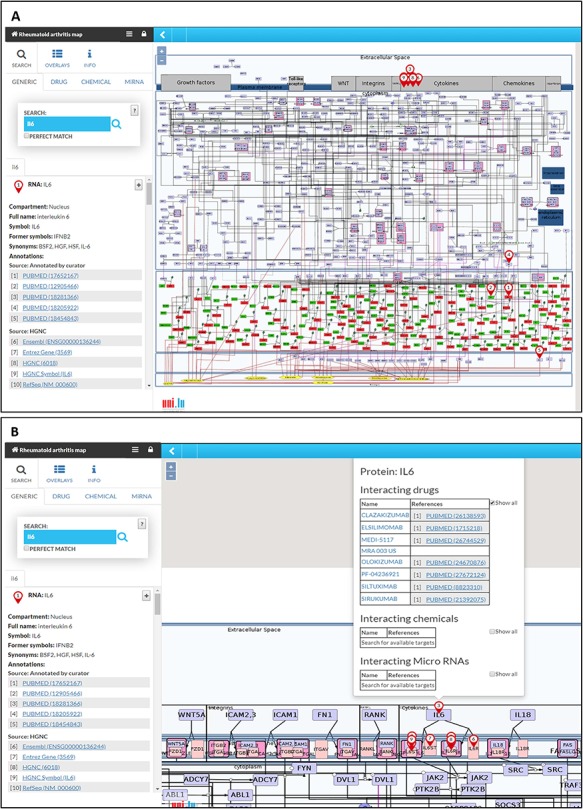
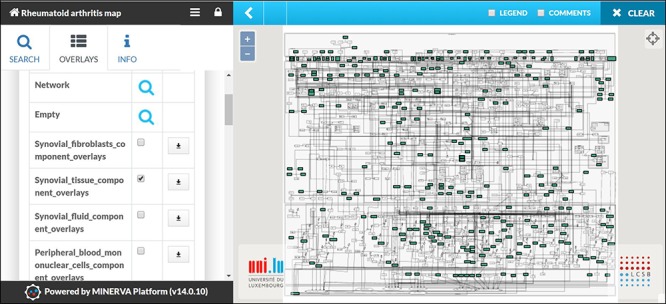
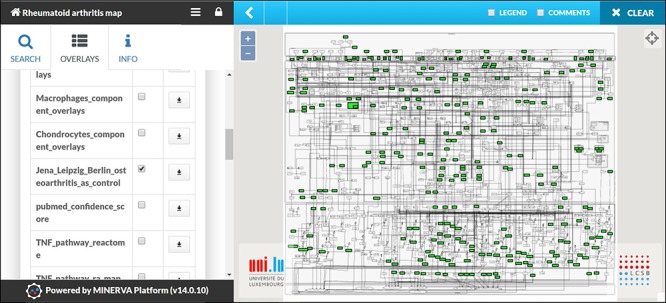
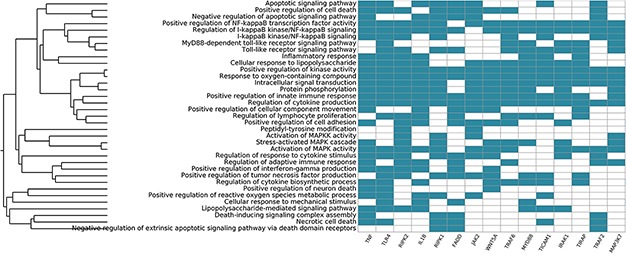
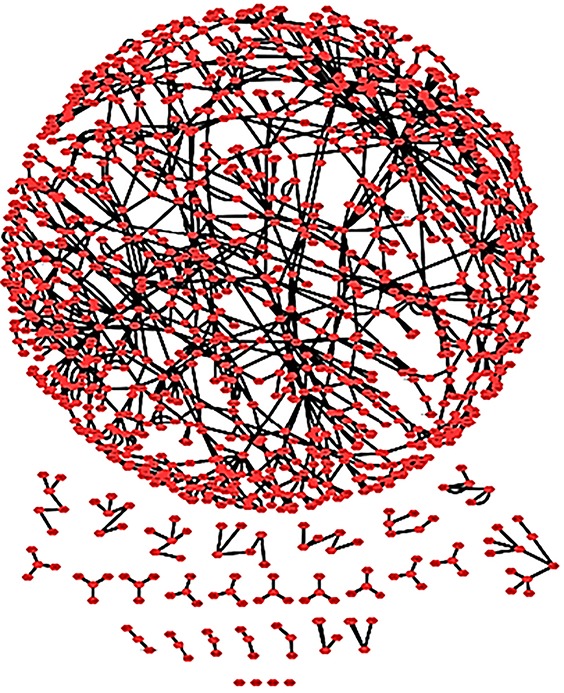
Rheumatoid arthritis (RA) is a progressive, inflammatory autoimmune disease of unknown aetiology. The complex mechanism of aetiopathogenesis, progress and chronicity of the disease involves genetic, epigenetic and environmental factors. To understand the molecular mechanisms underlying disease phenotypes, one has to place implicated factors in their functional context. However, integration and organization of such data in a systematic manner remains a challenging task. Molecular maps are widely used in biology to provide a useful and intuitive way of depicting a variety of biological processes and disease mechanisms. Recent large-scale collaborative efforts such as the Disease Maps Project demonstrate the utility of such maps as versatile tools to organize and formalize disease-specific knowledge in a comprehensive way, both human and machine-readable. We present a systematic effort to construct a fully annotated, expert validated, state-of-the-art knowledge base for RA in the form of a molecular map. The RA map illustrates molecular and signalling pathways implicated in the disease. Signal transduction is depicted from receptors to the nucleus using the Systems Biology Graphical Notation (SBGN) standard representation. High-quality manual curation, use of only human-specific studies and focus on small-scale experiments aim to limit false positives in the map. The state-of-the-art molecular map for RA, using information from 353 peer-reviewed scientific publications, comprises 506 species, 446 reactions and 8 phenotypes. The species in the map are classified to 303 proteins, 61 complexes, 106 genes, 106 RNA entities, 2 ions and 7 simple molecules. The RA map is available online at ramap.elixir-luxembourg.org as an open-access knowledge base allowing for easy navigation and search of molecular pathways implicated in the disease. Furthermore, the RA map can serve as a template for omics data visualization.


Figures

Figure 1
Figure 1. Workflow for the construction and use of the RA map. The assembly of the signalling and molecular pathways implicated in RA involves exhaustive manual curation and information mining from literature, public databases and repositories and the use of the software CellDesigner (18). The RA map contains mechanisms reported in the most recently published studies, after validation from RA experts. The map can be transformed into an online interactive knowledge base using the platform MINERVA (19). Functional enrichment and topological analysis is possible using the software BioInfoMiner (16) (https://bioinfominer.com) and Cytoscape (17), respectively.
Figure 2
Figure 2. Snapshot of the SBGN-compliant RA map. The map is colour-coded with proteins in purple, genes in green, RNAs in red and phenotypes in yellow. State transitions and catalysis reactions are displayed in black, and the inhibitions are in red. Compartments are distinguished as bounding boxes. The map was built using CellDesigner, version 4.4 (18). Modifications to the SBGN format: translation arcs are used to keep the representation compact, as well as the gene and RNA shapes.
Figure 3
Figure 3. The RA map in MINERVA platform. (A) Users can use the search box to type in the element of interest. The resulting element shows up as pins on the map. Corresponding annotations of the searched element, like HGNC, Entrez Gene, RefSeq and Ensembl identifiers are displayed on the left panel along with the PubMed identifiers of the manually curated annotations. (B) Further clicking on the pin will display additional information about interacting drugs, chemicals and microRNAs for the element.
Figure 4
Figure 4. MINERVA plugins. (A) The tree plugin allows to navigate in dense networks by following interactions in a tree-like manner. (B) The stream plugin allows for downstream or upstream expansion when selecting a node of interest.
Figure 5
Figure 5. Visualizing cell/tissue/fluid-specific parts of the RA map using dedicated overlays. Snapshot of the visualization of the Synovial Tissue overlay.
Figure 6
Figure 6. Mapping of Omic datasets from RA synovial tissue. The apoptosis and angiogenesis phenotypes appear to be inactive as no molecule leading to these cellular phenotypes is mapped.
Figure 7
Figure 7. Systemic functional analysis of the RA map using GO terms. Heat map of the top 15 priority genes and their systemic interpretation using BioInfoMiner and GO terms.
Figure 8
Figure 8. Systemic functional analysis of the RA map using HPO terms. Heat map of the top 15 priority genes and their systemic interpretation using BioInfoMiner and HPO terms.
Figure 9
Figure 9. The RA map as a complex network. The RA network with spring embedded layout. One connected core and several smaller unconnected parts are shown.
Figure 10
Figure 10. Node degree distributions of the RA map with a fitted power law. (A) Overall degree distribution. (B) In-degree distribution. (C) Out-degree distribution.

References

    1. McInnes I.B. and Schett G. (2011) The pathogenesis of rheumatoid arthritis. N. Engl. J. Med., 365, 2205–2219. - PubMed
    1. Frank-Bertoncelj M., Klein K. and Gay S. (2017) Interplay between genetic and epigenetic mechanisms in rheumatoid arthritis. Epigenomics, 9, 493–504. - PubMed
    1. Tripathi S., Flobak Å., Chawla K. et al. (2015) The gastrin and cholecystokinin receptors mediated signaling network: a scaffold for data analysis and new hypotheses on regulatory mechanisms. BMC Syst. Biol., 9, 40. - PMC - PubMed
    1. Kawakami E., Singh V.K., Matsubara K. et al. (2016) Network analyses based on comprehensive molecular interaction maps reveal robust control structures in yeast stress response pathways. npj Syst. Biol. Appl., 2, 15018. - PMC - PubMed
    1. Niarakis A., Bounab Y., Grieco L. et al. (2014) Computational modeling of the main signaling pathways involved in mast cell activation. Curr. Top. Microbiol. Immunol., 382, 69–93. - PubMed

Publication types