. 2020 Jul 1;105(7):2300-2310.
doi: 10.1210/clinem/dgaa216.

Human Bone Marrow Adipose Tissue is a Metabolically Active and Insulin-Sensitive Distinct Fat Depot

Affiliations

Human Bone Marrow Adipose Tissue is a Metabolically Active and Insulin-Sensitive Distinct Fat Depot

Tam T Pham et al. J Clin Endocrinol Metab. .

Abstract

Context: Bone marrow (BM) in adult long bones is rich in adipose tissue, but the functions of BM adipocytes are largely unknown. We set out to elucidate the metabolic and molecular characteristics of BM adipose tissue (BMAT) in humans.

Objective: Our aim was to determine if BMAT is an insulin-sensitive tissue, and whether the insulin sensitivity is altered in obesity or type 2 diabetes (T2DM).

Design: This was a cross-sectional and longitudinal study.

Setting: The study was conducted in a clinical research center.

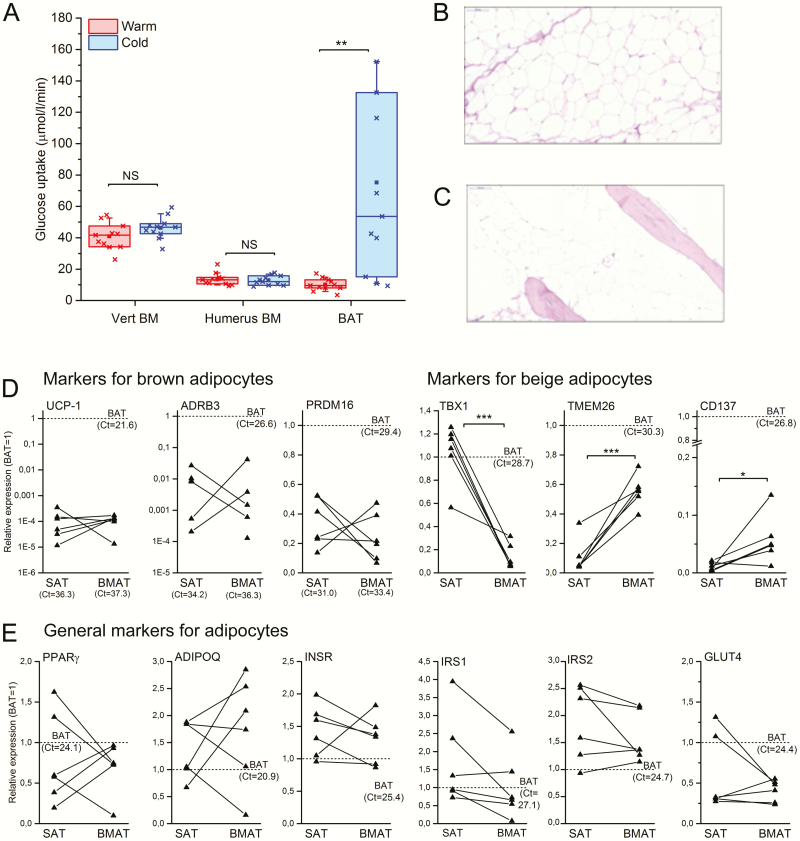
Patients or other participants: Bone marrow adipose tissue glucose uptake (GU) was assessed in 23 morbidly obese subjects (9 with T2DM) and 9 healthy controls with normal body weight. In addition, GU was assessed in another 11 controls during cold exposure. Bone marrow adipose tissue samples for molecular analyses were collected from non-DM patients undergoing knee arthroplasty.

Intervention(s): Obese subjects were assessed before and 6 months after bariatric surgery and controls at 1 time point.

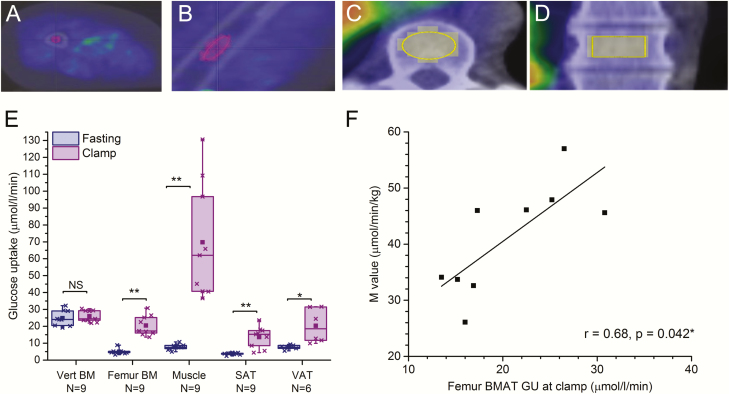
Main outcome measure: We used positron emission tomography imaging with 2-[18F]fluoro-2-deoxy-D-glucose tracer to characterize GU in femoral and vertebral BMAT. Bone marrow adipose tissue molecular profile was assessed using quantitative RT-PCR.

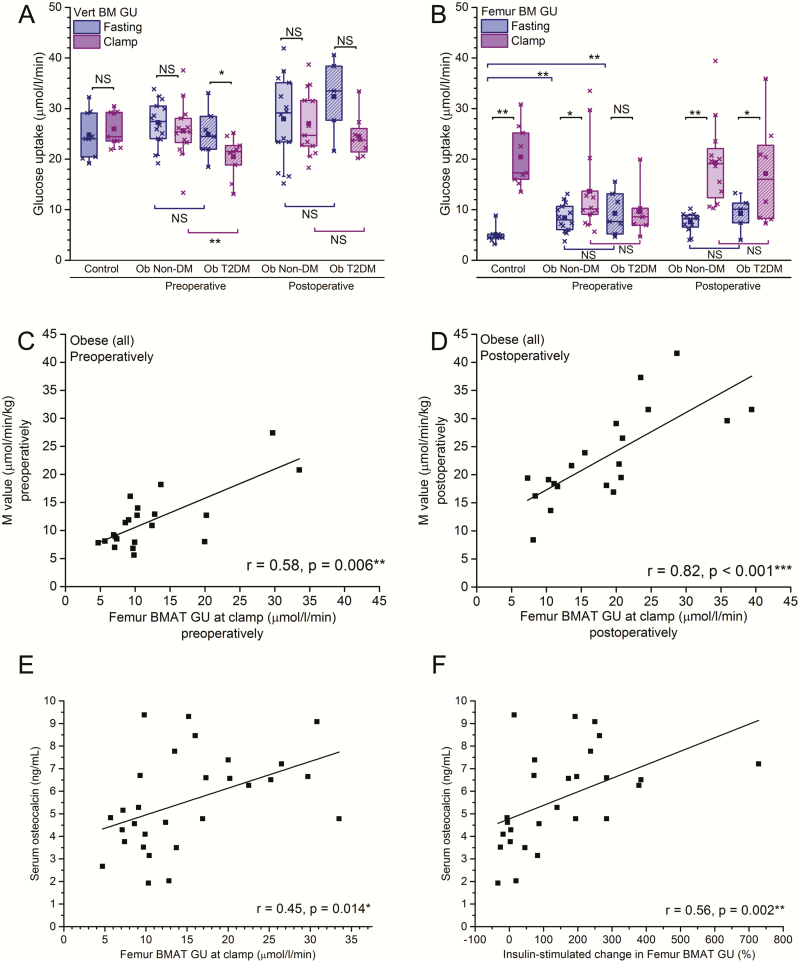
Results: Insulin enhances GU in human BMAT. Femoral BMAT insulin sensitivity was impaired in obese patients with T2DM compared to controls, but it improved after bariatric surgery. Furthermore, gene expression analysis revealed that BMAT was distinct from brown and white adipose tissue.

Conclusions: Bone marrow adipose tissue is a metabolically active, insulin-sensitive and molecularly distinct fat depot that may play a role in whole body energy metabolism.

Trial registration: ClinicalTrials.gov NCT00793143.

Keywords: PET/CT; adipose tissue; bone marrow.


Figures

Figure 1.
Figure 1.
Insulin enhances GU in human femoral BMAT. Glucose uptake (µmol/l/min) in vertebral and femoral BM in healthy control subjects (n = 9). Volume of interest (VOI) in femoral bone marrow in cross-sectional image (A) and sagittal image (B); and in vertebral bone marrow in cross-sectional image (C) and sagittal image (D). E: Regional GU (µmol/l/min) in lumbar vertebral bone marrow (Vert BM, n = 9), femoral bone marrow (Femur BM, n = 9), skeletal muscle (Muscle, n = 9), abdominal subcutaneous adipose tissue (SAT, n = 9), and visceral adipose tissue (VAT, n = 6) during fasting state and hyperinsulinemic euglycemic clamp. P-values for clamp-induced change are given as: *P < 0.05, **P < 0.01, ***P < 0.001, NS not significant P > 0.05. The lines of the boxes represent the 25th, 50th, and 75th percentiles, whiskers 10th and 90th percentiles, and the square indicates the mean value. F: Correlation between femur BMAT GU (µmol/l/min) and M-value (µmol/min/kg) (N = 9). Values are mean + SEM.
Figure 2.
Figure 2.
Insulin sensitivity of human BMAT is impaired in obesity and T2DM and can be reversed with weight loss. Vertebral BM GU (µmol/l/min) (A) and femur BM GU (B) at fast and during hyperinsulinemic clamp in controls (same individuals as in Fig. 1G) and obese subjects (Ob) with or without T2DM. Glucose uptake has been analyzed before bariatric surgery (preoperative) and 6 months after bariatric surgery (postoperative). P-values for insulin-induced change are given above the plot *P < 0.05, ** P < 0.01, NS not significant P > 0.05. In addition, P-values for the differences between GU in diabetic and nondiabetic obese subjects are shown below the plot. The lines of the boxes represent the 25th, 50th, and 75th percentiles, whiskers 10th and 90th percentiles, and the square indicates the mean value. C: Correlation between femur BMAT GU (µmol/l/min) and M-value (µmol/min/kg) during hyperinsulinemic clamp before the surgery and after the surgery (D).
Figure 3.
Figure 3.
Human BMAT does not have features of brown fat. A: Glucose uptake in thoracic vertebral bone marrow (Vert BM), humeral bone marrow (Humerus BM), and subclavicular brown adipose tissue (BAT) at room temperature (warm) and upon cold exposure (cold) (N = 11). P-values for cold-induced change are given as: ** P < 0.01, NS, not significant difference. The lines of the boxes represent the 25th, 50th, and 75th percentiles, whiskers 10th and 90th percentiles, and the square indicates the mean value. B: Histological section of subcutaneous adipose tissue and C) of long bone BMAT (both 20-fold magnification, hematoxylin-eosin staining). D–E: Expression of marker genes for adipocytes in paired human SAT and BMAT samples. Average of femoral and tibia BMAT is used and data is represented as relative expression compared to a reference BAT sample (set as 1, dotted line). Markers for brown adipocytes (UCP1, ADRB3, PRDM16) and beige adipocytes (TBX1, TMEM26M, CD137) (D) and brown and white adipocytes (PPARG, ADIPOQ, GLUT4, INSR, IRS1, IRS2) (E) are shown. Note that the scale on the y-axis is logarithmic for UCP1 and ADRB3. Lines represent individual paired samples (N = 6) and Ct-values for the reference BAT sample are shown. P-values for only statistically significant differences (two sample t test) are shown. *P < 0.05, ***P < 0.001.

References

    1. Virtanen KA, Lidell ME, Orava J, et al. . Functional brown adipose tissue in healthy adults. N Engl J Med. 2009;360(15):1518–1525. - PubMed
    1. Orava J, Nuutila P, Lidell ME, et al. . Different metabolic responses of human brown adipose tissue to activation by cold and insulin. Cell Metab. 2011;14(2):272–279. - PubMed
    1. Lidell ME, Betz MJ, Enerbäck S. Two types of brown adipose tissue in humans. Adipocyte. 2014;3(1):63–66. - PMC - PubMed
    1. Wu J, Boström P, Sparks LM, et al. . Beige adipocytes are a distinct type of thermogenic fat cell in mouse and human. Cell. 2012;150(2):366–376. - PMC - PubMed
    1. Scheller EL, Rosen CJ. What’s the matter with MAT? Marrow adipose tissue, metabolism, and skeletal health. Ann N Y Acad Sci. 2014;1311:14–30. - PMC - PubMed

Publication types

Associated data