. 2020 Apr 20;11(4):253.
doi: 10.1038/s41419-020-2449-5.

Enhanced fatty acid oxidation provides glioblastoma cells metabolic plasticity to accommodate to its dynamic nutrient microenvironment

Affiliations

Enhanced fatty acid oxidation provides glioblastoma cells metabolic plasticity to accommodate to its dynamic nutrient microenvironment

Shiva Kant et al. Cell Death Dis. .

Abstract

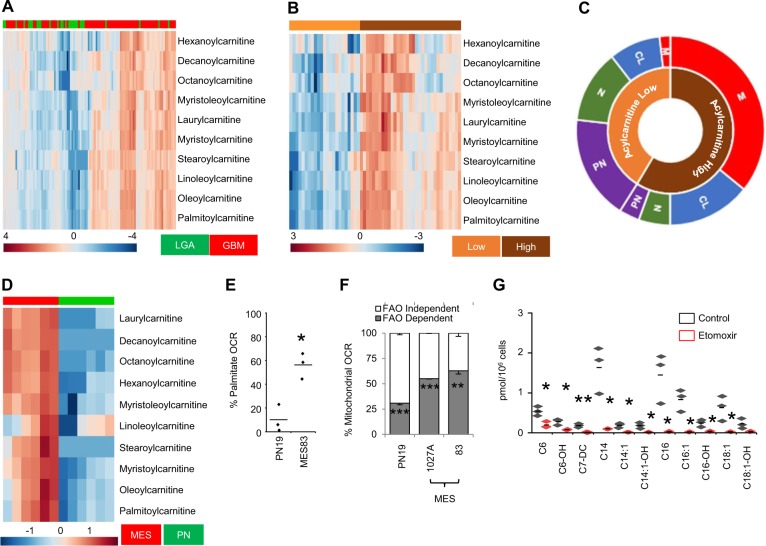
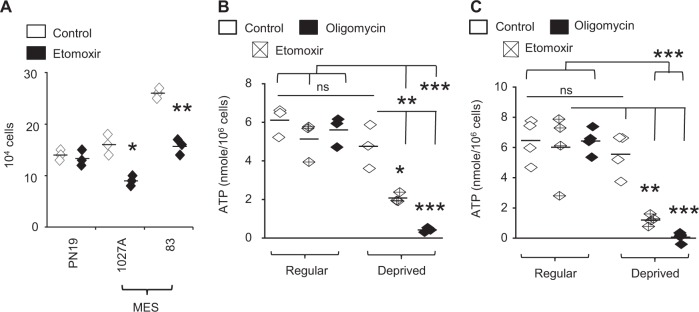
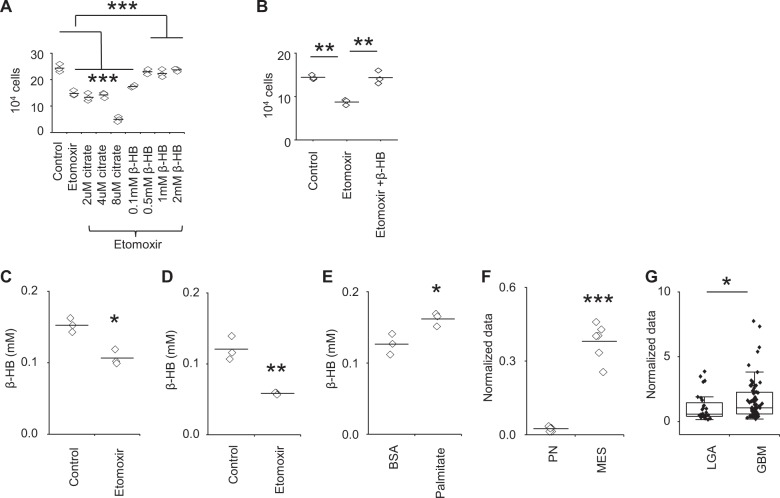
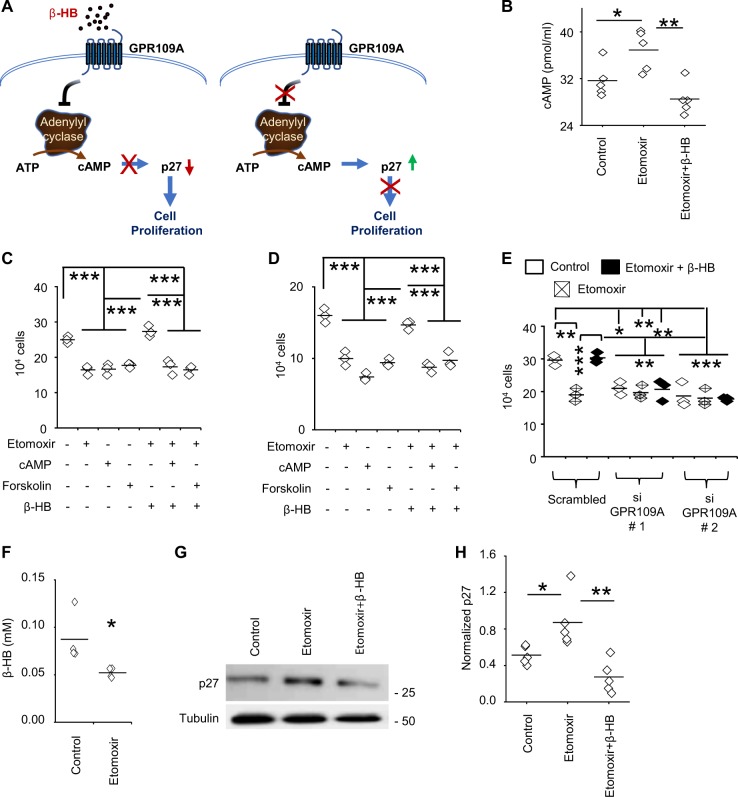
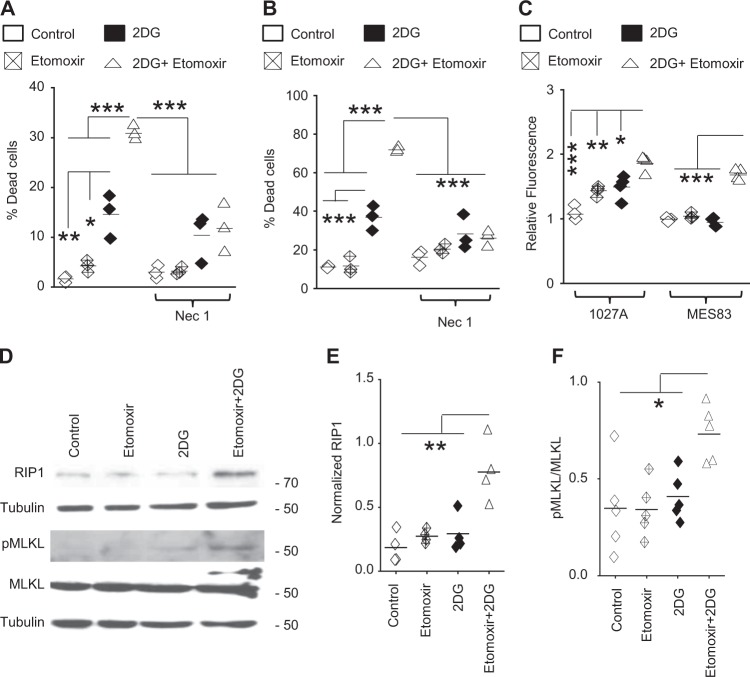
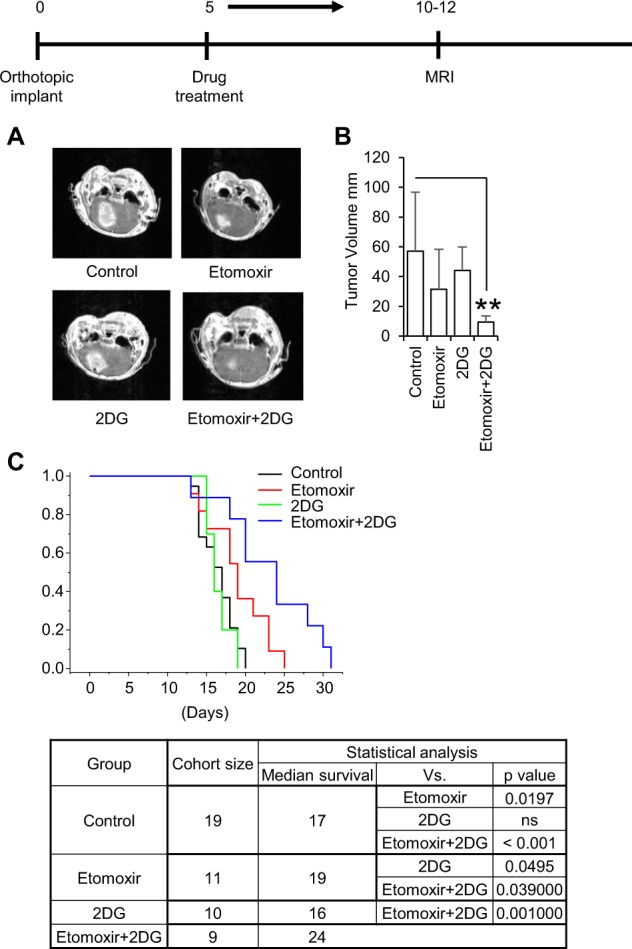
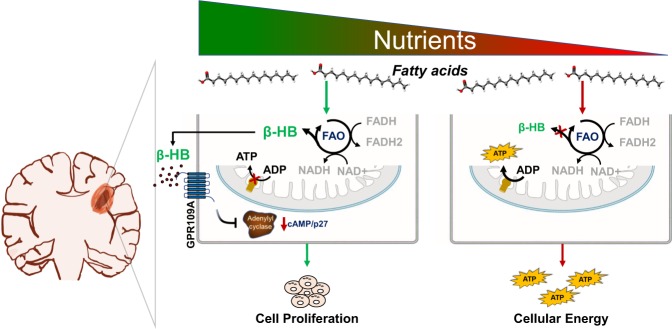
Despite advances in molecularly characterizing glioblastoma (GBM), metabolic alterations driving its aggressive phenotype are only beginning to be recognized. Integrative cross-platform analysis coupling global metabolomic and gene expression profiling on patient-derived glioma identified fatty acid β-oxidation (FAO) as a metabolic node in GBM. We determined that the biologic consequence of enhanced FAO is directly dependent upon tumor microenvironment. FAO serves as a metabolic cue to drive proliferation in a β-HB/GPR109A dependent autocrine manner in nutrient favorable conditions, while providing an efficient, alternate source of ATP only in nutrient unfavorable conditions. Rational combinatorial strategies designed to target these dynamic roles FAO plays in gliomagenesis resulted in necroptosis-mediated metabolic synthetic lethality in GBM. In summary, we identified FAO as a dominant metabolic node in GBM that provides metabolic plasticity, allowing these cells to adapt to their dynamic microenvironment. Combinatorial strategies designed to target these diverse roles FAO plays in gliomagenesis offers therapeutic potential in GBM.


Conflict of interest statement

The authors declare that they have no conflict of interest.

Figures

Fig. 1
Fig. 1. FAO related metabolites differentially accumulate in GBM.
a Unsupervised clustering of patient-derived low-grade astrocytoma (LGA; n = 28) and glioblastoma (GBM; n = 80) demonstrates an accumulation of medium and long-chain acylcarnitines in GBM. b Heterogeneous clustering of acylcarnitines is observed in GBM (n = 56), demonstrating acylcarnitine “high” and “low” metabolic phenotypes. c The acylcarnitine “high” phenotype is enriched with mesenchymal (M) and classical (CL) subtypes, while neural (N) and proneural (PN) subtypes are enriched in the acylcarnitine “low” phenotype. d Unsupervised clustering of two patient-derived mesenchymal (MES) and two proneural (PN) GBM stem cell lines demonstrate an accumulation of medium and long-chain acylcarnitines (n = 3). e Cellular oxygen consumption rate (OCR) was measured in real time in PN and MES cells using the Seahorse platform (n = 3). Results represent percent increases in OCR following the addition of palmitate (300 µM). f Basal mitochondrial OCR was measured in stated cell lines treated with +/− etomoxir (40 µM; 45 min; n = 3). g Medium and long chain acylcarnitines were quantified in MES83 cells treated with +/− etomoxir (40 µM; 24 h; n = 3). Data represents mean ± SD (F) and line between the data points represents mean. *p < 0.05; **p < 0.005; ***p < 0.0005.
Fig. 2
Fig. 2. FAO regulates mesenchymal cell proliferation.
a PN and MES cells were treated with +/− etomoxir (40 µM; 48 h) and live cells were counted using trypan blue (n = 3). ATP was measured in b MES83 (n = 3) and c 1027 A (n = 4) cells plated in regular and nutrient-deprived media treated with +/− etomoxir (40 µM; 4 h) or oligomycin (2 µM; 1 h). Line between the data points represents mean. *p < 0.05; **p < 0.005; ***p < 0.0005.
Fig. 3
Fig. 3. MES cells produce β-HB in nutrient-rich conditions.
a MES83 cells were treated with +/− etomoxir (40 µM) or in combination with indicated concentration of citrate or β-HB (n = 3). Viable cells were counted using trypan blue after 48 h. b 1027 A cells were treated with +/− etomoxir (40 µM) or in combination with β-HB (0.5 mM) (n = 3). Viable cells counted using trypan blue after 48 h. Cellular β-HB was measured in c MES83 and d 1027 A cells treated with +/− etomoxir (40 µM; 8 h; n = 3). e Cellular β-HB was measured in MES83 cells treated with BSA and BSA:palmitate (500 µM; 4 h; n = 3). Concentration of β-HB in f two patient-derived mesenchymal (MES) and 2 proneural (PN) GBM stem cell lines (n = 3) and g in patient low-grade astrocytoma (LGA; n = 28) and glioblastoma (GBM; n = 80, data truncated at 10). The boxes represent interquartile range, median and whisker denotes upper and lower limit. Line between the data points represents mean. *p < 0.05; **p < 0.005; ***p < 0.0005.
Fig. 4
Fig. 4. β-HB regulates cellular proliferation in a GPR109A/cAMP dependent manner.
a Schematic representation of the β-HB/GPR109A signaling pathway. b Cellular cAMP was measured in MES83 cells treated with +/− etomoxir (8 h, 40 µM) alone and in combination with β-HB (0.5 mM; n = 5). c MES83 and d 1027 A cells were pretreated with +/− etomoxir (40 µM) and β-HB (0.5 mM) for 30 min followed by treatment with forskolin (40 μM) or 8-Br-cAMP (0.75 mM; n = 3). Viable cells were counted using trypan blue after 48 h. e MES83 cells were pretreated with GPR109A or scrambled siRNA (48 h; n = 3) and then treated in the described conditions. Viable cells were counted using trypan blue after 48 h. f β-HB was measured in culture supernatant of MES83 cells treated +/− etomoxir (40 µM; 8 h; n = 4). p27 expression was analyzed by g western blot in MES83 cells (n = 5) treated with +/− etomoxir (40 μM) alone or in combination with β-HB (0.5 mM) for 48 h and h expression was quantified by densitometry. Line between the data points represents mean. *p < 0.05; **p < 0.005; ***p < 0.0005.
Fig. 5
Fig. 5. Dual inhibition of FAO and glycolysis elicits necroptosis-mediated metabolic synthetic lethality in MES cells in vitro.
a MES83 and b 1027 A cells were +/– pretreated with necrostatin-1 (Nec-1; 100 µM, 30 min) and then treated with +/− etomoxir (40 µM), 2DG (35 mM) or the combination (n = 3). Non-viable cells were counted with trypan blue after 48 h. c Mitochondrial superoxide was evaluated with MitoSOX Red after 48 h. treatment with +/− etomoxir (40 µM), 2DG (35 mM) alone or in combination (n = 4). Expression of molecules involved in necroptosis was analyzed by western blot (d) after 48 hr treatment with indicated inhibitors. Normalized expression of e RIP1 (n = 4) and f pMLKL (n = 5) was quantified by densitometry. Line between the data points represents mean. *p < 0.05; **p < 0.005; ***p < 0.0005.
Fig. 6
Fig. 6. Dual inhibition of FAO and glycolysis improves survival in a orthotopic GBM mouse model.
Etomoxir (40 mg/kg) and/or 2-DG (500 mg/kg) were administered via intraperitoneal (i.p.) injection 5 days a week. a, b Mice were imaged and tumors measured using MRI 10–12 days following MES83 tumor implant. Data represents mean ± SD. **p < 0.005. c Kaplan–Meier survival plot and statistical analysis in mice treated with the indicated agents.
Fig. 7
Fig. 7. Diagram summarizing the dynamic roles FAO plays in GBM based on a given microenvironment.
In nutrient favorable conditions (left), glioblastoma cells utilize FAO to stimulate proliferation through the β-HB/GPR109A/cAMP signaling axis. In nutrient unfavorable conditions (right), glioblastoma cells are able to utilize FAO to generate ATP to maintain survival.

References

    1. Ostrom QT, et al. CBTRUS statistical report: primary brain and other central nervous system tumors diagnosed in the United States in 2011–2015. Neuro-Oncology. 2018;20:iv1–iv86. doi: 10.1093/neuonc/noy131. - DOI - PMC - PubMed
    1. Agnihotri S, Zadeh G. Metabolic reprogramming in glioblastoma: the influence of cancer metabolism on epigenetics and unanswered questions. Neuro-Oncology. 2016;18:160–172. doi: 10.1093/neuonc/nov125. - DOI - PMC - PubMed
    1. Tanaka K, et al. Compensatory glutamine metabolism promotes glioblastoma resistance to mTOR inhibitor treatment. J. Clin. Investig. 2015;125:1591–1602. doi: 10.1172/JCI78239. - DOI - PMC - PubMed
    1. DeBerardinis RJ, et al. Beyond aerobic glycolysis: transformed cells can engage in glutamine metabolism that exceeds the requirement for protein and nucleotide synthesis. Proc. Natl Acad. Sci. USA. 2007;104:19345–19350. doi: 10.1073/pnas.0709747104. - DOI - PMC - PubMed
    1. Guo D, et al. EGFR signaling through an Akt-SREBP-1-dependent, rapamycin-resistant pathway sensitizes glioblastomas to antilipogenic therapy. Sci. Signal. 2009;2:ra82. doi: 10.1126/scisignal.2000446. - DOI - PMC - PubMed

Publication types