. 2020 Apr 20;11(4):249.
doi: 10.1038/s41419-020-2438-8.

Tumor-associated macrophages promote ovarian cancer cell migration by secreting transforming growth factor beta induced (TGFBI) and tenascin C

Affiliations

Tumor-associated macrophages promote ovarian cancer cell migration by secreting transforming growth factor beta induced (TGFBI) and tenascin C

Anna Mary Steitz et al. Cell Death Dis. .

Abstract

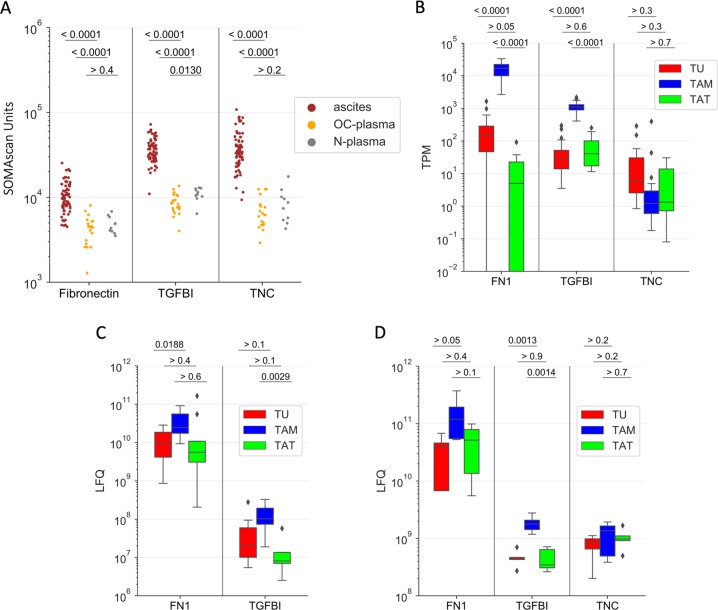
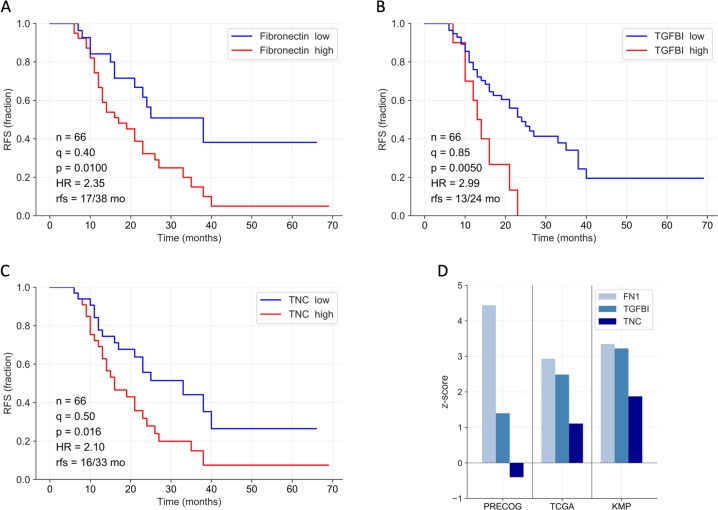
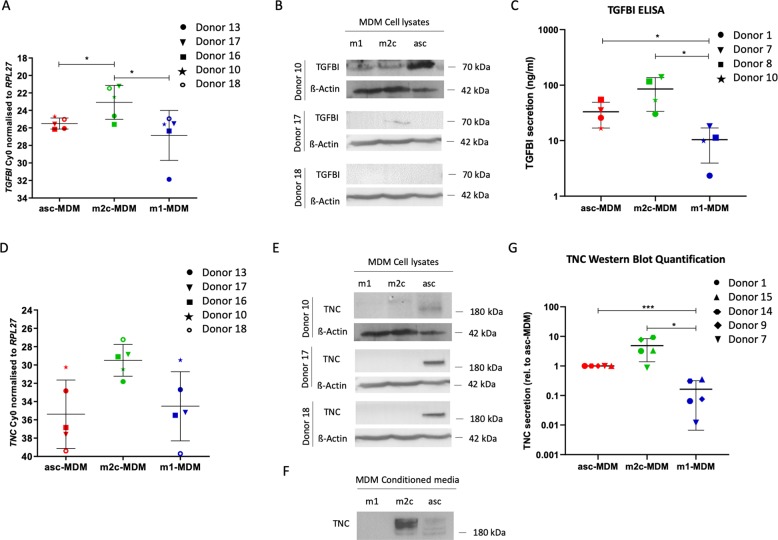
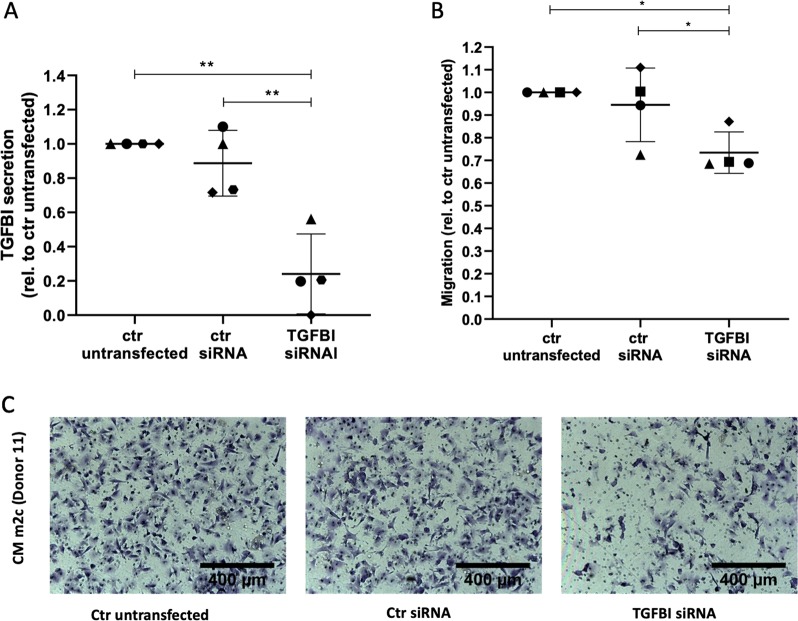
A central and unique aspect of high-grade serous ovarian carcinoma (HGSC) is the extensive transcoelomic spreading of tumor cell via the peritoneal fluid or malignant ascites. We and others identified tumor-associated macrophages (TAM) in the ascites as promoters of metastasis-associated processes like extracellular matrix (ECM) remodeling, tumor cell migration, adhesion, and invasion. The precise mechanisms and mediators involved in these functions of TAM are, however, largely unknown. We observed that HGSC migration is promoted by soluble mediators from ascites-derived TAM, which can be emulated by conditioned medium from monocyte-derived macrophages (MDM) differentiated in ascites to TAM-like asc-MDM. A similar effect was observed with IL-10-induced alternatively activated m2c-MDM but not with LPS/IFNγ-induced inflammatory m1-MDM. These observations provided the basis for deconvolution of the complex TAM secretome by performing comparative secretome analysis of matched triplets of different MDM phenotypes with different pro-migratory properties (asc-MDM, m2c-MDM, m1-MDM). Mass spectrometric analysis identified an overlapping set of nine proteins secreted by both asc-MDM and m2c-MDM, but not by m1-MDM. Of these, three proteins, i.e., transforming growth factor beta-induced (TGFBI) protein, tenascin C (TNC), and fibronectin (FN1), have been associated with migration-related functions. Intriguingly, increased ascites concentrations of TGFBI, TNC, and fibronectin were associated with short progression-free survival. Furthermore, transcriptome and secretome analyses point to TAM as major producers of these proteins, further supporting an essential role for TAM in promoting HGSC progression. Consistent with this hypothesis, we were able to demonstrate that the migration-inducing potential of asc-MDM and m2c-MDM secretomes is inhibited, at least partially, by neutralizing antibodies against TGFBI and TNC or siRNA-mediated silencing of TGFBI expression. In conclusion, the present study provides the first experimental evidence that TAM-derived TGFBI and TNC in ascites promote HGSC progression.


Conflict of interest statement

The authors declare that they have no conflict of interest.

Figures

Fig. 1
Fig. 1. Impact of macrophage secretomes on the migration of ovarian cancer cells.
a Migration of 5 different cultured patient-specific HGSC tumor cells (OCMI OC_37, 38, 58, 92, 108) was analyzed using conditioned media of ascites-derived TAM from 3 different patients (TAM_169, 170, 171) as chemoattractant in a transwell assay format. Background migration was measured in the absence of any attractant (Ctr−). Data were normalized to 1 for FCS-induced migration (Ctr+) in each OCMI cell line (a). b Exemplary microscopic pictures showing migrated OCMI cells (OC_ 38, 58, 92) in response to conditioned media of TAM_170 and FCS (Ctr+) as well as background control without chemoattractant (Ctr−). c, d Conditioned media of m1 (induced by LPS+IFNγ), m2c (induced by IL-10), and asc-MDM (induced by ascites) from 6 donors were applied as attractants for migration of OCMI cell line OC_58. The corresponding data for the phenotypes of MDM differentiation are shown in Supplementary Fig. S1. Migration is expressed relative to FCS-induced migration (c) and relative to migration induced by TAM-like MDM (d). e Transwell migration format using OCMI cells (OC_58) pretreated with conditioned media of m1-MDM, m2c-MDM, and asc-MDM (3 different donors) for 17 h prior to analysis of tumor migration using FCS as chemoattractant for 2 h. As controls, untreated tumor cells were allowed to migrate in the presence (Ctr+) and absence of FCS (Ctr−). For details, see “Materials/subjects and methods.” Migration of pretreated tumor cells was expressed relative to untreated cells in the presence of FCS. Horizontal bars show the mean. Standard deviations are given. Asterisks indicate p values determined by two-sided, paired t test. *p < 0.05, ***p < 0.001.
Fig. 2
Fig. 2. Secretome analysis of MDM subtypes by LC-MS/MS.
Serum-free conditioned media of m1-MDM (induced by LPS+IFNγ), m2c-MDM (induced by IL-10), and asc-MDM (induced by ascites) from the same 5 donors tested for stimulation of tumor cell migration in Fig. 1 were analyzed by mass spectrometry-based proteomics. a Pie chart showing the distribution of proteins present selectively in the medium from asc-MDM and m2c-MDM versus m1-MDM (orange), asc-MDM and m1-MDM versus m2c-MDM (pink), and asc-MDM versus m1-MDM and m2c-MDM (red). Numbers (n) refer to the identified polypeptides (feature_ids in Table S1); arrows point to the number of annotated genes that could be associated with the identified polypeptides. The respective genes (or gene functions) are listed in the colored boxes. b Dot plot showing protein levels individually (log2 LFQ values measured by LC-MS/MS) for MDM from the same donors as in Fig. 1. Arrows indicate the following selectivities: asc & alt: asc-MDM and m2c-MDM versus m1-MDM (orange in a); asc & inf: higher level found with asc-MDM and m1-MDM versus m2c-MDM (pink in a); asc: asc-MDM versus m1-MDM and m2c-MDM (red in a); inf: m1-MDM versus asc-MDM and m2c-MDM; alt: m2c-MDM versus m1-MDM and m2c-MDM. The table at the bottom shows p values (paired t test) for the relevant comparisons. Green: p < 0.05; gray p ≥ 0.05.
Fig. 3
Fig. 3. Expression of TGFBI, TNC, and FN1 in malignant ascites and ascites-associated cells.
a Levels (LC-MS/MS, LFQ intensity) of TGFBI, TNC, and FN1 in cell-free HGSC ascites (n = 70, red dots), plasma from HGSC patients (n = 20; OC-plasma, yellow), and patients with benign gynecologic diseases (n = 10; N-plasma, gray) as determined by SOMAscan. b Expression levels (RNA-Seq, TPM values) for TGFBI, TNC, and FN1 in ascites-associated tumor cells (TU n = 23, depicted in red), TAM (n = 32; blue), and TATs (n = 8; green). c Intracellular protein levels (LFQ intensity) of TGFBI, TNC, and FN1 in tumor cells (TU), TAM, and TATs from HGSC patients as obtained from LC-MS/MS-based proteome analysis (n = 5 for each cell type). d Levels of TGFBI, TNC, and FN1 (LFQ intensity) in the conditioned media of primary tumor cells (TU), TAM, and TATs after a 5-h cultivation in protein-free medium (n = 5 for each cell type). Boxplots show medians (horizontal line in boxes), upper and lower quartiles (box), and range (whiskers) (bd). Statistical analyses were performed by unpaired t test; p values are shown at the top of each panel.
Fig. 4
Fig. 4. Association of TGFBI, TNC, and FN1 ascites levels with ovarian cancer survival.
ac Kaplan–Meier plots showing the relationship between relapse-free survival (RFS) and SOMAscan protein signals for fibronectin (a), TGFBI (b), and TNC (c) in cell-free ascites from HGSC patients. n: number of evaluable patients; q quantile used for splitting datasets (high versus low levels), p logrank p value, HR hazard ratio, rfs median RFS (months). d Mean z-scores for survival associations with TGFBI, TNC, and FN1 gene expression in solid tissue from ovarian carcinoma) based on public datasets. TCGA and KMP: relapse-free survival (RFS); PRECOG: overall survival (OS). Positive and negative z-scores indicate HR > 1 and HR < 1, respectively. A z-score of 1.96 corresponds to a logrank p value of 0.05.
Fig. 5
Fig. 5. Upregulation of TGFBI and TNC in migration-promoting MDM subtypes.
a Expression of TGFBI mRNA in asc-MDM, m1-MDM, and m2c-MDM analyzed by RT-qPCR in five different donors. b Detection of TGFBI protein in cell lysates by western blotting. β-Actin was used as loading control. Blots of three donors are shown. c TGFBI secretion of polarized MDM measured by ELISA of conditioned media (n = 4). TGFBI protein levels are indicated as ng/ml. d Expression of TNC mRNA was analyzed in asc-MDM, m1-MDM, and m2c-MDM by RT-qPCR in five different donors. e Detection of TNC protein in cell lysates by western blotting. β-Actin was used as loading control (same blot as in b, since both TGFBI and TNC were analyzed in the same experiment) (n = 3). f Western blot of TNC protein in the conditioned media. The analysis was carried out with tenfold concentrated conditioned media from equal numbers of different MDM subtypes. g Quantification of TNC secretion by different MDM subtypes was performed using the Image LabTM 5.0 software in five different donors. TNC protein levels were normalized to 1 for asc-TAM. p Values were determined by paired t test (*p < 0.05, ***p < 0.001).
Fig. 6
Fig. 6. Inhibition of migration-promoting activity of TGFBI and TNC in asc-MDM and m2c-MDM secretomes by neutralizing antibodies.
a Adhesion of OCMI cells (OC_58) to plastic-coated rTGFBI and rTNC (full-length and EGFL repeat) (or PBS as uncoated control) was analyzed after 1 h. Bound cells were stained with crystal violet, and color development was measured at 560 nm. Adhesion was calculated relative to the uncoated control for each of n = 4 experiments. b Transwell migration assay format using OCMI cells (OC_58) pretreated with rTGFBI and rTNC (full-length and EGFL repeat) for 17 h. Influence of recombinant proteins on tumor migration was subsequently measured using FCS as chemoattractant for 2 h. As controls, untreated tumor cells were allowed to migrate in the presence (Ctr+) and absence of FCS (Ctr−). Five experiments were performed. Migration of pretreated tumor cells was expressed relative to untreated cells in the presence of FCS. cf Neutralization of TGFBI (c, d) and TNC (e, f) in conditioned media (CM) of m2c-MDM and asc-MDM (n = 5) was performed as described for the recombinant proteins in Supplementary Fig. S1. As a control, the cells were either left untreated or treated with CM without adding the antibodies. Migration was analyzed in the transwell format described above using FCS as chemoattractant. Migration is expressed relative to the migration induced by the CM alone. Horizontal bars show the mean. p Values were determined by two-sided, paired t test (*p < 0.05, **p < 0.01, ***p < 0.001). Representative microscopic pictures of migrated cells induced by MDM secretomes in the presence and absence of neutralizing anti-TGFBI antibody (d) and anti-TNC antibody (f) are shown.
Fig. 7
Fig. 7. Impact of TGFBI silencing on the migration-promoting potential of asc-MDM and m2c-MDM secretomes.
a TGFBI secretion by m2c-MDM and asc-MDM after siRNA-mediated TGFBI silencing. TGFBI concentration in the conditioned media of MDM transfected with control siRNA and TGFBI siRNA (pool of three siRNAs) was determined by ELISA and normalized to the untransfected control. Depicted are the data of five different macrophage preparations. Additional data of TGFBI gene expression and intracellular protein levels in TGFBI siRNA-transfected macrophages are shown in Fig. S3. b Influence of TGFBI knockdown on the migration-promoting potential of asc-MDM and m2c-MDM. OCMI tumor cells (OC_58) were pretreated with conditioned media of the untransfected and siRNA-transfected cells before applied to a transwell migration assay with FCS as attractant, as described in the legend of Fig. 6. Migration was expressed relative to the untransfected control for each of the four different macrophage preparations. Horizontal bars show the mean and two-sided, paired t test was calculated (*p < 0.05, **p < 0.01). c Representative microscopic pictures of tumor cell migration induced by conditioned media from m2c-MDM (donor 11) untransfected or transfected with control siRNA or TGFBI siRNA.

References

    1. Narod S. Can advanced-stage ovarian cancer be cured? Nat. Rev. Clin. Oncol. 2016;13:255–261. doi: 10.1038/nrclinonc.2015.224. - DOI - PubMed
    1. Pogge von Strandmann E, Reinartz S, Wager U, Müller R. Tumor–host cell interactions in ovarian cancer: pathways to therapy failure. Trends Cancer. 2017;3:137–148. doi: 10.1016/j.trecan.2016.12.005. - DOI - PubMed
    1. Lengyel E. Ovarian cancer development and metastasis. Am. J. Pathol. 2010;177:1053–1064. doi: 10.2353/ajpath.2010.100105. - DOI - PMC - PubMed
    1. Pradeep S, et al. Hematogenous metastasis of ovarian cancer: rethinking mode of spread. Cancer Cell. 2014;26:77–91. doi: 10.1016/j.ccr.2014.05.002. - DOI - PMC - PubMed
    1. Sehouli J, et al. Intra-abdominal tumor dissemination pattern and surgical outcome in 214 patients with primary ovarian cancer. J. Surg. Oncol. 2009;99:424–427. doi: 10.1002/jso.21288. - DOI - PubMed

Publication types

MeSH terms