. 2020 Apr 20;11(1):1896.
doi: 10.1038/s41467-020-15717-8.

Paracrine control of α-cell glucagon exocytosis is compromised in human type-2 diabetes

Affiliations

Paracrine control of α-cell glucagon exocytosis is compromised in human type-2 diabetes

Muhmmad Omar-Hmeadi et al. Nat Commun. .

Abstract

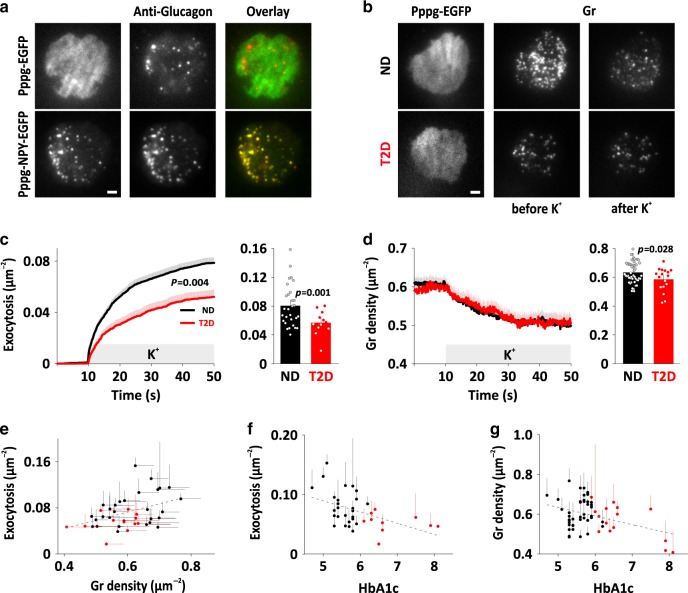
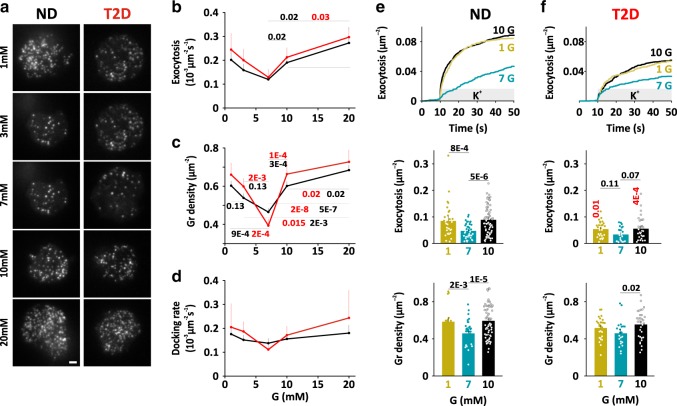
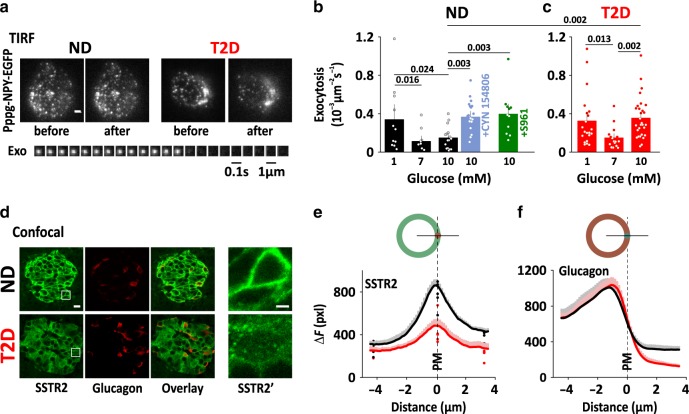
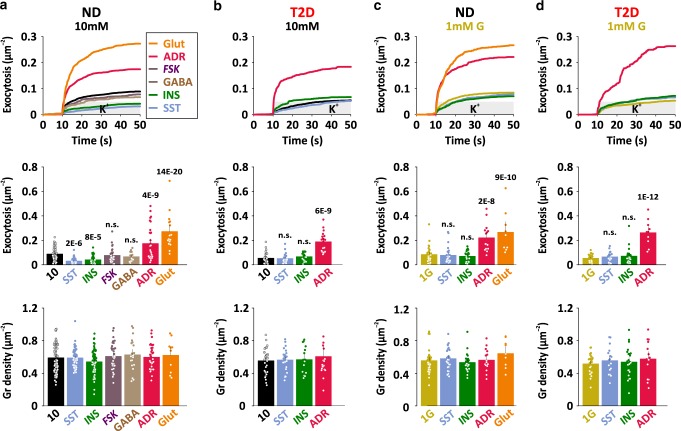
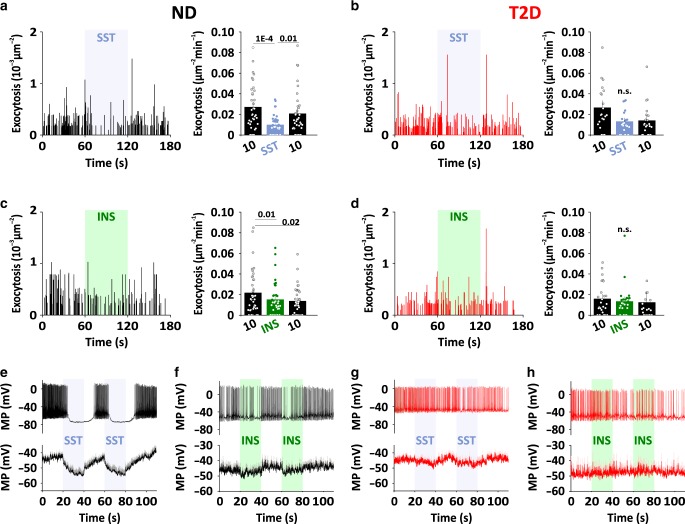
Glucagon is released from pancreatic α-cells to activate pathways that raise blood glucose. Its secretion is regulated by α-cell-intrinsic glucose sensing and paracrine control through insulin and somatostatin. To understand the inadequately high glucagon levels that contribute to hyperglycemia in type-2 diabetes (T2D), we analyzed granule behavior, exocytosis and membrane excitability in α-cells of 68 non-diabetic and 21 T2D human donors. We report that exocytosis is moderately reduced in α-cells of T2D donors, without changes in voltage-dependent ion currents or granule trafficking. Dispersed α-cells have a non-physiological V-shaped dose response to glucose, with maximal exocytosis at hyperglycemia. Within intact islets, hyperglycemia instead inhibits α-cell exocytosis, but not in T2D or when paracrine inhibition by insulin or somatostatin is blocked. Surface expression of somatostatin-receptor-2 is reduced in T2D, suggesting a mechanism for the observed somatostatin resistance. Thus, elevated glucagon in human T2D may reflect α-cell insensitivity to paracrine inhibition at hyperglycemia.


Conflict of interest statement

The authors declare no competing interests.

Figures

Fig. 1
Fig. 1. Exocytosis of glucagon granules in normal and diabetic pancreatic α-cells.
a TIRF images of dispersed human islet cells transduced with Pppg-EGFP (top) or Pppg-NPY-EGFP (bottom). In total, 90% of EGFP expressing cells (n = 91 cells, 5 donors) and 93% of NPY-EGFP expressing cells (n = 70 cells, 4 donors) were positive for glucagon. Scale bar 2 µm. b Examples of TIRF microscopy of cells from non-diabetic (ND) and type 2 diabetic (T2D) donors expressing Pppg-EGFP together with the granule marker NPY-mCherry (gr). Examples are before and after stimulation with 75 mM K+ for 40 s. (K+ was elevated during 10–50 s). Scale bar 2 µm. c Timecourse of average cumulative number of exocytotic events normalized to cell area in experiments as in b (left); 1530 granules in 169 ND cells (black), 441 granules in 75 T2D cells (red). Exocytosis (right) was 0.055 ± 0.005 gr µm−2 in 12 T2D donors compared with 0.077 ± 0.005 gr µm−2 in 29 ND donors (p = 0.001, two-tailed t-test). In c, d, timecourse (left) shows mean ± SEM of all cells, bargraphs (right) show donor means (dots) and mean ± SEM of individual donor means (bars). d Time courses of granule (gr) density (left) in ND or T2D cells as in b. Glucagon density (right) was 0.56 ± 0.017 gr µm−2 in 17 T2D donors compared with 0.61±0.01 gr µm−2 in 50 ND donors (p = 0.028, two-tailed t-test). e Total exocytosis during K+-stimulation plotted as function of granule density. Each symbol in eg represents represent individual donors ± SEM (averages for n = 29 ND donors in black, and n = 12 T2D donors in red; 5–20 cells for each donor). Correlation was quantified as Pearson coefficient r (see main text). f Total exocytosis during K+-stimulation plotted as function of donor HbA1c. n = 26 ND donors and n = 10 T2D donors. g Granule density as function of donor HbA1c; n = 40 ND and n = 15 T2D donors.
Fig. 2
Fig. 2. Voltage-dependent currents and exocytosis in human α-cells.
a Families of voltage-clamp current responses in human ND and T2D α-cells. Currents were elicited by 50 ms depolarizing pulses (−70 to +80 mV in 10 mV increments) from a holding potential of −70 mV. For clarity, only the responses between −40 mV and +10 are shown. b, c Current (I)–voltage (V) relationships for Ca2+ (B, average current during 5–45 ms of the depolarization in a) and Na+ (c, peak current during the first 5 ms of the depolarization in a) currents recorded from ND (n = 38, 4 donors, black) and diabetic T2D (n = 32, 3 donors, red) cells as in a. Currents are normalized to cell size (pF). Data are presented as mean values ± SEM. d Cell capacitance increase (ΔCm) during a train of 14 × 200-ms depolarizations from −70 mV to 0 mV in ND (black) and T2D (red) α-cells. e Average change in membrane capacitance, normalized to initial cell capacitance (ΔC/C0), during the 1st depolarization (#1), and total increase during the train (Σ1-14) for ND (n = 20, 4 donors, black) and T2D (n = 18, 3 donors, red) α-cells. Data are presented as mean values ± SEM. f Whole-cell membrane capacitance (CM) in T2D (n = 48, 7 donors) and ND (n = 66, black, 8 donors) α-cells. Dots represent individual cells, and lines are mean values. Each donor is represented by a single color.
Fig. 3
Fig. 3. Glucose dependence of α-cell exocytosis.
a Examples TIRF images of dispersed ND (left) and T2D α-cells (right) expressing Pppg-NPY-EGFP, after equilibration in the indicated glucose concentrations. Scale bar 2 µm. b Average exocytosis as function of ambient glucose concentration for dispersed ND (black) and T2D (red) α-cells as in a. For ND, n = 13 cells/3 donors at 1 mM, 8 cells/2 donors at 3 mM, 13 cells/2 donors at 7 mM, 15 cells/3 donors at 10 mM, and 10 cells/2 donors at 20 mM). For T2D, n = 7 cells/2 donors at 1 mM), 9 cells/2 donors at 3 mM, 10 cells/2 donors at 7 mM, 10 cells/2 donors at 10 mM, and 7 cells/2 donors at 20 mM. Data are presented as mean values ± SEM. c Docked granules (average granule density) as function of ambient glucose concentration for ND (black, n = 32 cells/5 donors at 1 mM, 32 cells/5 donors at 3 mM, 32 cells/5 donors at 7 mM, 32 cells/5 donors at 10 mM, and 32 cells/5 donors at 20 mM) and for T2D cells (red, n = 11 cells/2 donors, 11 cells/2 donors at 3 mM, 17 cells/2 donors at 7 mM, 16 cells/3 donors at 10 mM, and 11 cells/2 donors at 20 mM). Data are presented as mean values ± SEM. In b, c p-values in black or red for comparisons as indicated by a line in ND group or T2D group respectively (two-tailed t-test). d Average rate of docking (granules becoming immobilized in the TIRF plane) as function of the ambient glucose concentration in the same cells as in b. Data are presented as mean values ± SEM. e Cumulative time course (upper), total exocytosis (middle), and initial density of docked granules (lower) during K+-stimulated exocytosis in dispersed ND α-cells bathed in 1 mM (30 cells/6 donors, yellow), 7 mM (38 cells/6 donors, blue) or 10 mM glucose (71 cells/14 donors, black). Stimulation was from 10 to 50 s. Data are presented as mean values ± SEM. f As in e, but for dispersed T2D α-cells. n = 27 cells/5 donors at 1 mM, 24 cells/3 donors in 7 mM, and 33 cells/6 donors in 10 mM glucose. In e, f, p-values in black for comparisons as indicated by a line, or in red comparing ND and T2D for the same condition (oneway ANOVA, Fisher posthoc test).
Fig. 4
Fig. 4. Disturbed paracrine signaling in α-cells within intact islets.
a TIRF images of NPY-EGFP of an α-cell within an intact islets of ND (left, representative for 67 cells) or T2D (right, representative for 66 cells) human donors. Scale bar 2 µm. Lower: image sequence of an exocytosis event in the ND α-cell example. b Average spontaneous exocytosis in α-cells within intact ND islets that were bathed in 1 mM (11 cells/3 donors, black), 7 mM (10 cells/3 donors, black), or 10 mM glucose (16 cells/4 donors, black), and in 10 mM glucose with SSTR antagonist (200 nM CYN154806, 19 cells/3 donors, light blue) or insulin receptor antagonist (1 μM S961, 11 cells/2 donors, green). Data are presented as mean values ± SEM. Scale bar 1 µm. c As in b, but for α-cells within intact T2D islets at 1 mM (21 cells/5 donors), 7 mM (16 cells/4 donors), and 10 mM glucose (29 cells/5 donors). In b, c, p-values are indicated for selected comparisons (one-way ANOVA with Fisher posthoc test). Data are presented as mean values ± SEM. d Representative confocal images of human pancreatic tissue sections of ND donors (top) and T2D donors (bottom), co-immunostained anti-SSTR2 (green) and anti-glucagon (red); scale bar 10 µm. The white square indicates the area that is enlarged in the right-most images (SSTR2; scale bar 2 µm). e Average SSTR2 staining intensity (F-background, average pixel value pxl), measured along a line across the plasma membrane of 828 cells from 5 ND donors (black) and 824 cells from 5 T2D donors (red). Cells were spatially aligned so that the line crosses the center-right of the cell perimeter at distance zero (illustrated drawing, top). Dots indicate average donor values. Staining intensities at distance zero were significantly different between ND and T2d donors (p = 4 × 10−11, two-tailed t test). f As in be, but for glucagon staining.
Fig. 5
Fig. 5. Paracrine regulation of exocytosis in dispersed α-cells.
a Cumulative time course (upper), total exocytosis (middle), and initial density of docked granules (lower) during K+-stimulated (gray bar) exocytosis in dispersed ND α-cells in control conditions (black, 10 mM glucose, n = 71 cells/14 donors) or exposed to somatostatin (light blue, SST, 400 nM, n = 53 cells/9 donors), insulin (green, INS, 100 nM, n = 53 cells/8 donors), forskolin (purple, FSK, 2 µM, n = 30 cells/5 donors), GABA (brown, 400 nM, n = 14 cells/3 donors), adrenaline (pink, ADR, 5 µM, n = 30 cells/5 donors), glutamate (orange, Glut, 1 mM, n = 16 cells/3 donors). In ad, significant differences compared with control are indicated with p-values (one-way ANOVA, Fisher posthoc test). Data are presented as mean values ±SEM. b As in A, but for dispersed T2D α-cells. T2D ctrl n = 33 cells/6 donors, T2D SST n = 26 cells/5 donors, T2D INS n = 19 cells/4 donors, T2D ADR n = 19 cells/3 donors. c, d As in a, b, but in presence of 1 mM glucose. ND ctrl n = 30 cells/6 donors, ND SST n = 27 cells/6 donors, ND INS n = 24 cells/5 donors, ND ADR n = 15 cells/3 donors, ND Glut n = 9 cells/2 donors, T2D ctrl n = 27 cells/5 donors, T2D SST n = 17 cells/3 donors, T2D INS n = 23 cells/3 donors, and T2D ADR n = 10 cells/2 donors.
Fig. 6
Fig. 6. Time course of paracrine inhibition in dispersed α-cells.
a Time course of spontaneous exocytosis for a representative ND α-cell bathed in 10 mM glucose (black) and challenged with somatostatin during the indicated interval (SST, 400 nM; left, blue bar). Bars to the right show quantification of average exocytosis during the three time periods of the experiment (36 cells/6 donors). Data are presented as mean values ±SEM. In ad, significant differences are indicated with p-values (one-way ANOVA, Fisher posthoc test). b As in a, but for T2D α-cells (38 cells/6 donors). c, d As in be, but challenged with insulin (INS, 100 nM, green bar). 21 cells/4 ND donors and 25 cells/3 T2D donors. e, f Example (upper) and average (lower) membrane potential recording in dispersed ND α-cells bathed in 10 mM glucose. Somatostatin (SST, 400 nM, 17 cells/4 donors, blue shading in e) or insulin (INS, 100 nM, 25 cells/6 donors, green shading in f) were applied during the indicated time interval. g, h as in e, f, but for dispersed T2D α-cells (11 cells/2 donors in G; 13 cells/4 donors in h).

References

    1. Gerich J, Cryer P, Rizza R. Hormonal mechanisms in acute glucose counterregulation: the relative roles of glucagon, epinephrine, norepinephrine, growth hormone, and cortisol. Metabolism. 1980;29:1164–1175. doi: 10.1016/0026-0495(80)90026-8. - DOI - PubMed
    1. Cryer PE. Minireview: glucagon in the pathogenesis of hypoglycemia and hyperglycemia in diabetes. Endocrinology. 2012;153:1039–1048. doi: 10.1210/en.2011-1499. - DOI - PMC - PubMed
    1. Unger RH, Cherrington AD. Glucagonocentric restructuring of diabetes: a pathophysiologic and therapeutic makeover. J. Clin. Invest. 2012;122:4–12. doi: 10.1172/JCI60016. - DOI - PMC - PubMed
    1. Li J, et al. Submembrane ATP and Ca2+ kinetics in α-cells: Unexpected signaling for glucagon secretion. FASEB J. 2015;29:3379–3388. doi: 10.1096/fj.14-265918. - DOI - PMC - PubMed
    1. Ma X, et al. Glucagon stimulates exocytosis in mouse and rat pancreatic alpha-cells by binding to glucagon receptors. Mol. Endocrinol. 2005;19:198–212. doi: 10.1210/me.2004-0059. - DOI - PubMed

Publication types