. 2020 Apr 20;11(1):1881.
doi: 10.1038/s41467-020-15749-0.

Nitrogen limitation reveals large reserves in metabolic and translational capacities of yeast

Affiliations

Nitrogen limitation reveals large reserves in metabolic and translational capacities of yeast

Rosemary Yu et al. Nat Commun. .

Abstract

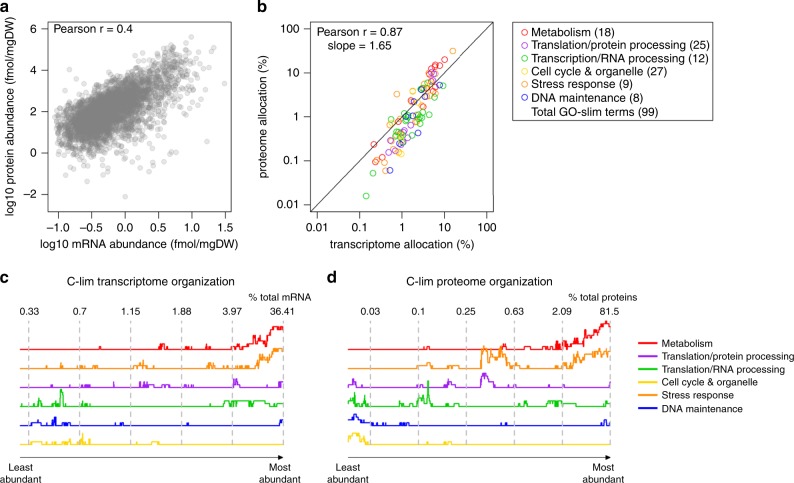
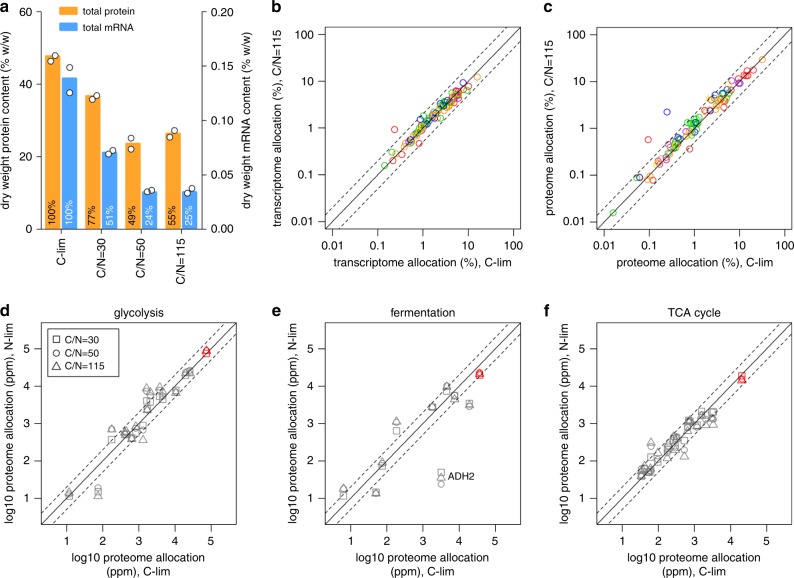
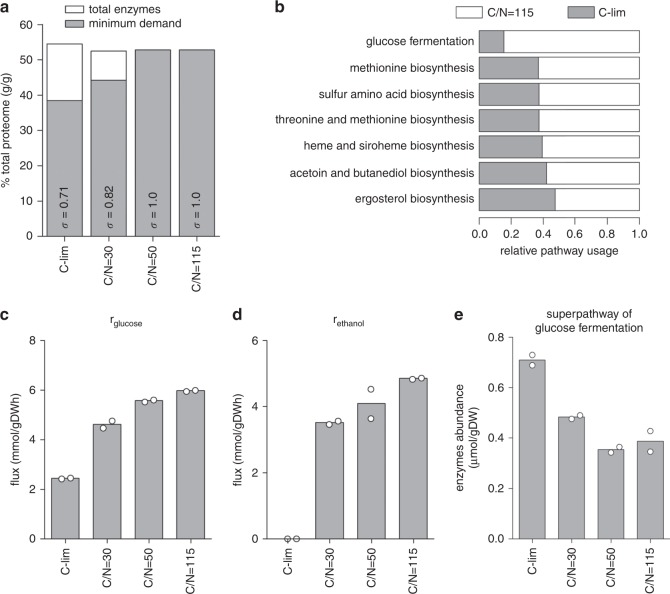
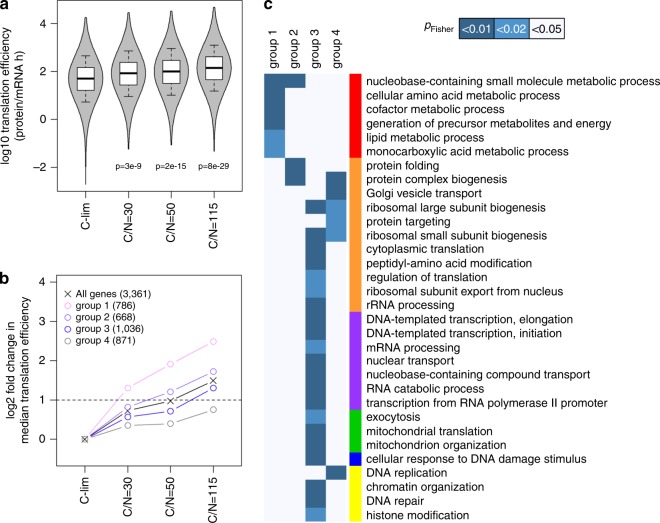
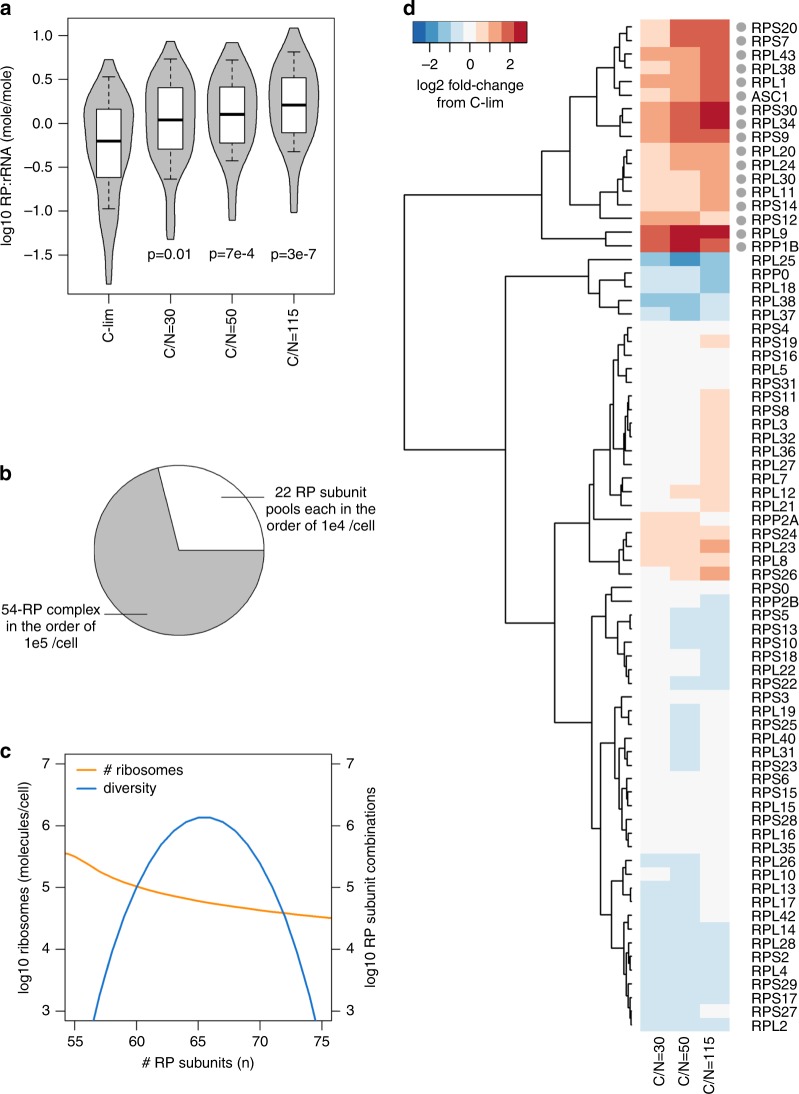
Cells maintain reserves in their metabolic and translational capacities as a strategy to quickly respond to changing environments. Here we quantify these reserves by stepwise reducing nitrogen availability in yeast steady-state chemostat cultures, imposing severe restrictions on total cellular protein and transcript content. Combining multi-omics analysis with metabolic modeling, we find that seven metabolic superpathways maintain >50% metabolic capacity in reserve, with glucose metabolism maintaining >80% reserve capacity. Cells maintain >50% reserve in translational capacity for 2490 out of 3361 expressed genes (74%), with a disproportionately large reserve dedicated to translating metabolic proteins. Finally, ribosome reserves contain up to 30% sub-stoichiometric ribosomal proteins, with activation of reserve translational capacity associated with selective upregulation of 17 ribosomal proteins. Together, our dataset provides a quantitative link between yeast physiology and cellular economics, which could be leveraged in future cell engineering through targeted proteome streamlining.


Conflict of interest statement

The authors declare no competing interests.

Figures

Fig. 1
Fig. 1. Transcriptome and proteome allocation are better correlated at the process level than the gene level.
a Absolute mRNA and protein abundances were quantified in yeast chemostat cultures at a dilution rate D = 0.2 h−1. Mean values of biological duplicates for the carbon-limited condition are shown. See Supplementary Fig. 2D-F for other conditions. b Transcriptome and proteome allocations to 99 GO-slim processes under carbon-limited condition were calculated as a % (mol mol−1) of total transcripts and proteins. GO-slim processes are color-coded by functional category. The number of GO-slim terms curated in each functional category is shown. See Supplementary Data 2 for number of genes in each GO-slim term. c Enrichment of GO-slim terms in 200-gene sliding windows of relative transcript abundance was analyzed by Fisher’s exact test. Y-axis represents relative # of GO-slim terms belonging in each functional category with FDR-adjusted pFisher < 0.05. Numbers indicate the relative abundance of transcripts (% mol mol−1 of total transcripts) in the 200-gene window at the dashed lines. d As in c for proteome organization.
Fig. 2
Fig. 2. Transcriptome and proteome reserves for different cellular processes.
a Total protein and mRNA content of the biomass under each culture condition. Colored bars are mean of biological duplicates. b Transcriptome allocation (% mol mol−1) to 99 GO-slim terms were compared between N-limited and C-limited cultures. GO-slim terms are color-coded by functional category as in Fig. 1b. Dashed lines are twofold increase and decrease from y = x, solid line. Mean values for carbon-limited and C/N = 115 conditions are shown. The red outlier represents the “amino acid transport” GO-slim term. c As in b for proteome allocation. The red and blue outliers represent “amino acid transport” and “response to starvation” GO-slim terms, respectively. d Proteome allocation to each enzyme in glycolysis was compared between N-limited (C/N = 30, 50, and 115) and C-limited cultures. Total proteome allocation to all enzymes in glycolysis is shown in red. Dashed lines are twofold increase/decrease from y = x, solid line. ppm, parts per million (mol mol−1). e As in d for proteome allocation to enzymes in fermentation. Total proteome allocation to all enzymes in fermentation is shown in red. Dashed lines are twofold increase/decrease from y = x, solid line. f As in d for proteome allocation to enzymes in the TCA cycle. Total proteome allocation to all enzymes in the TCA cycle is shown in red. Dashed lines are twofold increase/decrease from y = x, solid line.
Fig. 3
Fig. 3. Metabolic superpathways maintain large reserve capacities in carbon-limited cultures.
a Total enzyme abundance is compared with the minimum enzyme demand calculated in silico by ecYeast8.1 for each condition. The enzyme saturation coefficient σ is shown (see Methods). b Enzyme usage for selected yeast metabolic superpathways. Flux balance analysis (FBA) with random sampling was implemented in ecYeast8.1 to estimate the optimal enzyme requirement for each enzyme (see Methods). Pathway usage was computed as the sum of simulated enzyme requirement divided by the sum of measured enzyme abundance in the pathway. Pathways with relative usage <50% between C-limited and C/N = 115 cultures are shown. c Glucose consumption rate (rglucose) was measured under different culture conditions. Bars are mean of biological duplicates. d Ethanol production rate (rethanol) was measured under different culture conditions. Bars are mean of biological duplicates. e Absolute abundance of enzymes in the superpathway of glucose fermentation was calculated. Bars are mean of biological duplicates.
Fig. 4
Fig. 4. Reserves of translational capacity are preferentially used to translate metabolic proteins.
a Gene-specific translation efficiency was calculated in all growth conditions. The p-values indicated are from two-sided Student’s t-tests. Center line, median; box limits, upper and lower quartiles; whiskers, 1.5× interquartile range. b Genes were grouped based on the step of nitrogen reduction at which their translation efficiency was increased by log2 > 1. Data points reflect the median translation efficiency of each group, with the # of genes belonging to each group shown in parentheses. Horizontal dashed line indicates twofold increase from C-limited cultures. c Enrichment of GO-slim terms in each gene group as defined in b was analyzed by two-sided Fisher’s exact test. GO-slim terms are color-coded by functional category as in Fig. 1b. GO-slim terms with FDR-adjusted pFisher < 0.05 in at least one gene group are shown.
Fig. 5
Fig. 5. Ribosome reserves contain diverse sub-stoichiometric ribosomal proteins (RP).
a RP : rRNA ratio for each RP (abundance of each RP divided by rRNA abundance) was calculated in all growth conditions. The p-values indicated are from two-sided Student’s t-tests. Center line, median; box limits, upper and lower quartiles; whiskers, 1.5× interquartile range. b Model of ribosome complex diversity and abundance. Each complex ribosome contains 54 “core” RP subunits that are highly expressed and samples a subset of 22 RP subunits expressed an order of magnitude lower. c The total number of ribosomes in the cell decreases, whereas diversity of ribosomes varies quadratically, with the number of RP subunits complexed. d Relative abundance of RP subunits in N-limited chemostats compared with C-limited chemostat. RP paralogs were summed and labeled with standard gene name. The 17 RP subunits that were selectively upregulated by >2-fold in N-limited chemostats are indicated with a gray dot.

References

    1. Mori M, Schink S, Erickson DW, Gerland U, Hwa T. Quantifying the benefit of a proteome reserve in fluctuating environments. Nat. Commun. 2017;8:1225. doi: 10.1038/s41467-017-01242-8. - DOI - PMC - PubMed
    1. Scott M, Gunderson CW, Mateescu EM, Zhang Z, Hwa T. Interdependence of cell growth and gene expression: origins and consequences. Science. 2010;330:1099–1102. doi: 10.1126/science.1192588. - DOI - PubMed
    1. Hui S, et al. Quantitative proteomic analysis reveals a simple strategy of global resource allocation in bacteria. Mol. Syst. Biol. 2015;11:784. doi: 10.15252/msb.20145697. - DOI - PMC - PubMed
    1. Metzl-Raz E, et al. Principles of cellular resource allocation revealed by condition-dependent proteome profiling. Elife. 2017;6:e28034. doi: 10.7554/eLife.28034. - DOI - PMC - PubMed
    1. Kafri M, Metzl-Raz E, Jonas F, Barkai N. Rethinking cell growth models. FEMS Yeast Res. 2016;16:fow081. doi: 10.1093/femsyr/fow081. - DOI - PubMed

Publication types