. 2020 Apr 20;11(1):1904.
doi: 10.1038/s41467-020-15652-8.

Stochasticity constrained by deterministic effects of diet and age drive rumen microbiome assembly dynamics

Affiliations

Stochasticity constrained by deterministic effects of diet and age drive rumen microbiome assembly dynamics

Ori Furman et al. Nat Commun. .

Abstract

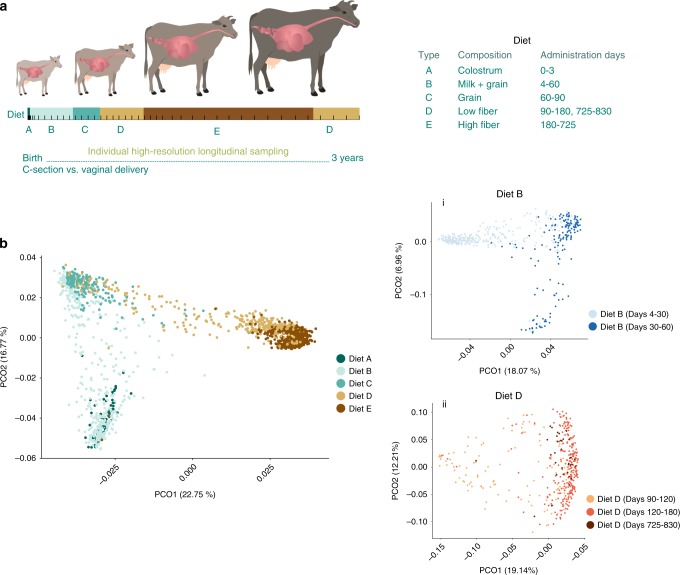
How complex communities assemble through the animal's life, and how predictable the process is remains unexplored. Here, we investigate the forces that drive the assembly of rumen microbiomes throughout a cow's life, with emphasis on the balance between stochastic and deterministic processes. We analyse the development of the rumen microbiome from birth to adulthood using 16S-rRNA amplicon sequencing data and find that the animals shared a group of core successional species that invaded early on and persisted until adulthood. Along with deterministic factors, such as age and diet, early arriving species exerted strong priority effects, whereby dynamics of late successional taxa were strongly dependent on microbiome composition at early life stages. Priority effects also manifest as dramatic changes in microbiome development dynamics between animals delivered by C-section vs. natural birth, with the former undergoing much more rapid species invasion and accelerated microbiome development. Overall, our findings show that together with strong deterministic constrains imposed by diet and age, stochastic colonization in early life has long-lasting impacts on the development of animal microbiomes.


Conflict of interest statement

The authors declare no competing interests.

Figures

Fig. 1
Fig. 1. Age plays an important role in community assembly dynamics.
a The experimental setup consisted of 45 cows (27 delivered vaginally and 18 via C-section), sampled to a minimum of 180 days and over a period of up to 830 days for a third of the cohort (3 years), resulting in high-resolution sampling of more than 1600 samples (bars represents sampling points). The animals were fed with standard dairy-feeding protocols (table on the right), kept under the same conditions, and housed together from the third month of life. See Supplementary Fig. 2 for further details on the sampling regime. b Principal coordinate analysis (PCoA) based on Bray–Curtis metrics showed clustering of operational taxonomic units (OTUs) according to age and diet (PERMANOVA, P = 0.001, two-sided test). During microbiome development, age-dependent clustering was identified within the same dietary period, where animals were fed with (i) Diet B and (ii) Diet D (PCoA based on Bray–Curtis metrics, PERMANOVA, P < 0.05). Source data is provided as a Source Data file.
Fig. 2
Fig. 2. Dynamics of the different microbial families is shaped by age and diet.
a Relative abundance of 291 microbial families. All families belonging to the same phylum are colored by different shades of the same color. The main phyla are described in the top left corner of the figure. The Y-axis represents relative abundance and the X-axis represents all of the different samples (n = 1634) sorted by sampling day. See Supplementary Fig. 22 for the full family-level analysis. b Relative abundance of Bacteroidaceae (blue) and Prevotellaceae (brown). Both belong to the Bacteroidetes phylum. c Relative abundance of Succinivibrionaceae (blue) from the Proteobacteria phylum and Methanobacteriaceae (brown) from the Archaea domain over time. d Relative abundance of Verrucomicrobiaceae over time, Akkermancia muciniphilia (A. muciniphilia; brown), and all other Verrucomicrobia species (blue). e Relative abundance of Ruminococcaceae (blue) and Lachnospiraceae (brown). Source data is provided as a Source Data file.
Fig. 3
Fig. 3. The core successional microbiome persists throughout rumen microbiome development, showing age-dependent shifts.
a (i) Heat map showing core successional microbes (n = 2544) subjected to hierarchical clustering. Diets are indicated in the color-coded bar above. (ii) Graphical illustration explaining the heat map structure. Each row represents a core OTU and each column represents an animal sampled at a specific time. b Early-appearing and persistent core successional microbes. Core successional species persistence (Y-axis) as a function of time of appearance (X-axis). Each dot represents the average persistence (number of days) of all microbes that arrived in the ecosystem on the specified day. Species appearance was measured over a 600-day window from first appearance, and persistence was calculated as the mean of the Δ(tfirst appearance − tlast appearance). Purple dots represent core successional microbes, gray dots represent non-core Microbes. Source data is provided as a Source Data file.
Fig. 4
Fig. 4. Mode of delivery drives historical contingency effects on rumen microbiome development.
a (i) Major phylum distribution differs between delivery-mode groups and shows long-term repercussions for mode of delivery. Major phylum kernel density (see Material and methods section for further elaboration of kernel density), depicting significant differences in species (OTUs) count over time, originating from the two delivery-mode groups: C-section (left (i)) and vaginal delivery (right (ii)) (P < 0.001; see Supplementary Figures and Results). b Early invasion of C-section-associated microbes. Mean ± SE for time of first arrival of delivery mode-associated species. Red line represents average day of appearance of vaginal delivery-associated species (n = 809), blue line of C-section-associated species (n = 1041), gray bars are SE. X-axis depicts the first day of appearance, Y-axis depicts the number of delivery mode-associated species arriving in each group. Microbes were ordered by time of appearance. c Mean first appearance day for each delivery mode-associated microbe cohort is significantly lower in the C-section cows (t-test, P = 2.2 × 10–15, two-sided test). d Mean maximum time of colonization, depicted as the delta between time of first appearance in any cow to time of last appearance in any cow, is higher in vaginally delivered cows. Colonization time for C-section-associated species is significantly lower (t-test, P = 2.2 × 10–15, two-sided test). In the data shown as box plots (c, d),boxes represent the interquartile range (IQR) between the first and third quartiles (25th and 75th percentiles, respectively) and the horizontal line inside the box defines the median. Whiskers represent the lowest and highest values within 1.5 times the IQR from the first and third quartiles, respectively. Source data is provided as a Source Data file.
Fig. 5
Fig. 5. Community dynamics is independent of mode of delivery but there is a time shift in species dynamics.
a Prediction of a single microbe’s behavior by MTV-LMM method (see Methods section). Black line represents the actual behavior of a given microbe; red line represents predicted behavior. b Autoregressive microbes are more predictable than any other randomly selected microbes. Pearson correlation between predicted and actual community composition for autoregressive microbes compared to a random set of microbes. The random set was picked using a permutation test (npermutations = 1000) in which at each iteration, 495 microbes are picked and used as predictors for the next time point. c Illustration of the center of mass (COM) calculation and clustering. COM is the weighted average for an OTU’s relative abundance over time. COM=i=1nR.AtDayti=1nDayt where i is the cow ID (1–45), R.An is the relative abundance of a species at time point t, Dayt is the day of life when the sample was taken (1–831). d COM is lower for the C-section-delivered autoregressive microbes. Clustering using the K-means method for the MTV-LMM microbes. Each dot represents the mean COM of autoregressive microbes in a particular cow. Only microbes found to be autoregressive in one mode of delivery, originating either from C-section (blue) or vaginal delivery (red), are presented for each cow. Stars represent the center of the cluster for each delivery mode. Each axis represents the COM values for C-section (Y-axis) and vaginal-delivery mode (X-axis). e Time shift between C-section and vaginal delivery in all autoregressive microbes, with lower COM for microbes from C-section cows. Average COM for all MTV-LMM microbes (OTU index on the X-axis, average COM on the Y-axis) displayed for either vaginal delivery (red) or C-section (blue), showing a time shift in the COM dependent on the mode of delivery for all OTUs. Each dot represents the COM for a single OTU averaged across all cows within one of the two modes of delivery. Source data is provided as a Source Data file.

References

    1. Hobson PN, Wallace RJ. Microbial ecology and activities in the rumen: part II. Crit. Rev. Microbiol. 1982;9:253–320. doi: 10.3109/10408418209104492. - DOI - PubMed
    1. Mizrahi, I. in Beneficial Microorganisms in MulticellularLife Forms (eds Rosenberg, E. & Gophna, U.) 203–210 (Springer Berlin Heidelberg, 2011).
    1. Mizrahi, I. in The Prokaryotes: Prokaryotic Biology and Symbiotic Associations (eds Rosenberg, E., DeLong, E. F., Lory, S., Stackebrandt, E. & Thompson, F.) 533–544 (Springer Berlin Heidelberg, 2013).
    1. Huws SA, et al. Addressing global ruminant agricultural challenges through understanding the rumen microbiome: past, present, and future. Front. Microbiol. 2018;9:2161. doi: 10.3389/fmicb.2018.02161. - DOI - PMC - PubMed
    1. Moraïs, S. & Mizrahi, I. Islands in the stream: from individual to communal fiber degradation in the rumen ecosystem. FEMS Microbiol. Rev. 10.1093/femsre/fuz007 (2019). - PMC - PubMed

Publication types