. 2020 Apr 20;11(1):1891.
doi: 10.1038/s41467-020-15684-0.

Hepatic saturated fatty acid fraction is associated with de novo lipogenesis and hepatic insulin resistance

Affiliations

Hepatic saturated fatty acid fraction is associated with de novo lipogenesis and hepatic insulin resistance

Kay H M Roumans et al. Nat Commun. .

Abstract

Hepatic steatosis is associated with poor cardiometabolic health, with de novo lipogenesis (DNL) contributing to hepatic steatosis and subsequent insulin resistance. Hepatic saturated fatty acids (SFA) may be a marker of DNL and are suggested to be most detrimental in contributing to insulin resistance. Here, we show in a cross-sectional study design (ClinicalTrials.gov ID: NCT03211299) that we are able to distinguish the fractions of hepatic SFA, mono- and polyunsaturated fatty acids in healthy and metabolically compromised volunteers using proton magnetic resonance spectroscopy (1H-MRS). DNL is positively associated with SFA fraction and is elevated in patients with non-alcoholic fatty liver and type 2 diabetes. Intriguingly, SFA fraction shows a strong, negative correlation with hepatic insulin sensitivity. Our results show that the hepatic lipid composition, as determined by our 1H-MRS methodology, is a measure of DNL and suggest that specifically the SFA fraction may hamper hepatic insulin sensitivity.


Conflict of interest statement

The authors declare no competing interests.

Figures

Fig. 1
Fig. 1. Validation of 1H-MRS method in oil phantoms.
a Lipid spectra acquired from five different oil phantoms (arachis, olive, rice, safflower, and sunflower oil) showing the different lipid proton peaks and their position. b Lipid spectrum and fit of arachis oil. Correlations between c SFA, d MUFA, e PUFA measured at 3T with 1H-MRS and measured with high-resolution 13C-NMR spectroscopy. The intraclass correlation coefficient (ICC) is shown in the respective plots (Intraclass correlation).
Fig. 2
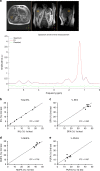
Fig. 2. Validation of 1H-MRS method in subcutaneous adipose tissue.
a T2 weighted Turbo spin echo MR image showing the voxel position located on adipose tissue and its corresponding lipid spectrum together with the fitted spectrum. The relationships between subcutaneous adipose tissue measured at 3T and adipose lipid composition determined through biopsy for the different lipid fractions: b SFA, c MUFA, and d PUFA (n = 8). The intraclass correlation coefficient (ICC) is shown in the respective plots (Intraclass correlation).
Fig. 3
Fig. 3. Validation of 1H-MRS method by testing reproducibility in vivo.
a T2 weighted Turbo spin echo MR image showing the voxel position located on liver and its corresponding lipid spectrum together with the fitted spectrum. Scatter plots showing the reproducibility of b total liver fat content and c SFA fraction, d MUFA fraction, and e PUFA fraction (n = 7). Reproducibility was tested by performing two repeated measurements. The intraclass correlation coefficient (ICC) is shown in the respective plots (Intraclass correlation).
Fig. 4
Fig. 4. The relationship between hepatic lipid composition and plasma VLDL-TG composition.
Relationships are shown for the different lipid fractions: a SFA, b MUFA, and c PUFA (n = 17). Hepatic %SFA determined with MRS and %SFA in VLDL-TG correlated significantly (p = 1.38 × 10−4). The correlation coefficient is shown in the respective plots (two-sided Pearson correlation).
Fig. 5
Fig. 5. Relationship between DNL and liver fat composition.
The relationships between DNL and a total liver fat content, b SFA fraction, c MUFA fraction, d PUFA fraction, and e MUFA/SFA ratio in healthy overweight/obese participants (with and without NAFL, n = 16 for total liver fat content and n = 15 for the fatty acid fractions and MUFA/SFA ratio). The correlation coefficient is shown in the respective plots (a; two-sided Spearman correlation, be; two-sided Pearson correlation).
Fig. 6
Fig. 6. Liver fat content and composition in groups with different metabolic disorders.
Comparisons between overweight/obese controls without NAFL (controls, n = 7 for total liver fat content, n = 6 for liver fat composition), overweight/obese with NAFL (NAFL, n = 15), patients with type 2 diabetes (T2D, n = 9) and GSD type 1a (GSD1a, n = 7). a Total liver fat content in control, NAFL, T2D, and GSD1a. Total liver fat content was significantly higher in the NAFL group compared to the control group (p = 0.002) and in the GSD1a group compared to the control group (p = 0.027). b SFA fraction in control, NAFL, T2D, and GSD1a. SFA fraction was significantly higher in the GSD1a group compared to the control group (p = 7.3 × 10−5) and NAFL group (p = 0.034), significantly higher in the T2D group compared to the control group (p = 0.016), and significantly higher in the NAFL group compared to the control group (p = 0.022). c MUFA fraction in control, NAFL, T2D, and GSD1a. MUFA fraction was significantly lower in the GSD1a group compared to the control group (p = 0.006). d PUFA fraction in control, NAFL, T2D, and GSD1a. Data are presented as mean with error bars showing the SEM. Different letters indicate significant differences between groups (Kruskal–Wallis, p < 0.05 for IHL and PUFA, and one-way ANOVA, p < 0.05 for SFA and MUFA). Bonferroni correction was used for post-hoc analyses.
Fig. 7
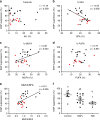
Fig. 7. The relationship between liver fat composition and hepatic insulin sensitivity.
The relationship between hepatic IS (EGP suppression) and a total liver fat content, b SFA fraction, c MUFA fraction, d PUFA fraction, and e MUFA/SFA ratio in overweight and obese individuals (healthy with and without NAFL in black and patients with T2D in red, n = 30 for total liver fat content and n = 29 for the fatty acid fractions and MUFA/SFA ratio). The correlation coefficient is shown in the respective plots (Two-sided Spearman correlation). f EGP suppression in healthy overweight/obese without NAFL (controls, n = 7), overweight/obese with NAFL (n = 14), and patients with T2D (n = 9). EGP suppression in patients with T2D was significantly lower compared to controls (p = 0.002). Data are presented as mean with error bars showing the SEM. Different letters indicate significant differences between groups (one-way ANOVA, p < 0.05). Bonferroni correction was used for post-hoc analyses.

References

    1. Sayiner M, Koenig A, Henry L, Younossi ZM. Epidemiology of nonalcoholic fatty liver disease and nonalcoholic steatohepatitis in the United States and the rest of the world. Clin. Liver Dis. 2016;20:205–214. doi: 10.1016/j.cld.2015.10.001. - DOI - PubMed
    1. Gaggini M, et al. Non-alcoholic fatty liver disease (NAFLD) and its connection with insulin resistance, dyslipidemia, atherosclerosis and coronary heart disease. Nutrients. 2013;5:1544–1560. doi: 10.3390/nu5051544. - DOI - PMC - PubMed
    1. Calzadilla Bertot L, Adams LA. The natural course of non-alcoholic fatty liver disease. Int. J. Mol. Sci. 2016;17:774. doi: 10.3390/ijms17050774. - DOI - PMC - PubMed
    1. Mantovani A, Byrne CD, Bonora E, Targher G. Nonalcoholic fatty liver disease and risk of incident Type 2 diabetes: a meta-analysis. Diabetes Care. 2018;41:372–382. doi: 10.2337/dc17-1902. - DOI - PubMed
    1. Targher G, Byrne CD, Lonardo A, Zoppini G, Barbui C. Non-alcoholic fatty liver disease and risk of incident cardiovascular disease: a meta-analysis. J. Hepatol. 2016;65:589–600. doi: 10.1016/j.jhep.2016.05.013. - DOI - PubMed

Publication types

Associated data