. 2020 Apr 20;11(1):1906.
doi: 10.1038/s41467-020-15648-4.

Structural basis of astrocytic Ca2+ signals at tripartite synapses

Affiliations

Structural basis of astrocytic Ca2+ signals at tripartite synapses

Misa Arizono et al. Nat Commun. .

Erratum in

Abstract

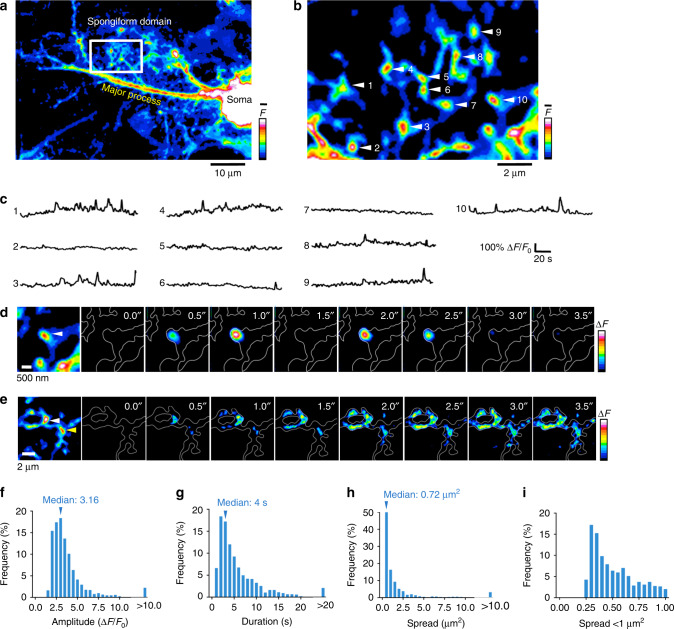
Astrocytic Ca2+ signals can be fast and local, supporting the idea that astrocytes have the ability to regulate single synapses. However, the anatomical basis of such specific signaling remains unclear, owing to difficulties in resolving the spongiform domain of astrocytes where most tripartite synapses are located. Using 3D-STED microscopy in living organotypic brain slices, we imaged the spongiform domain of astrocytes and observed a reticular meshwork of nodes and shafts that often formed loop-like structures. These anatomical features were also observed in acute hippocampal slices and in barrel cortex in vivo. The majority of dendritic spines were contacted by nodes and their sizes were correlated. FRAP experiments and Ca2+ imaging showed that nodes were biochemical compartments and Ca2+ microdomains. Mapping astrocytic Ca2+ signals onto STED images of nodes and dendritic spines showed they were associated with individual synapses. Here, we report on the nanoscale organization of astrocytes, identifying nodes as a functional astrocytic component of tripartite synapses that may enable synapse-specific communication between neurons and astrocytes.


Conflict of interest statement

The authors declare no competing interests.

Figures

Fig. 1
Fig. 1. Spongiform domain is formed by meshwork of nodes and shafts, and features loops.
a Confocal overview image of astrocytes expressing ZsGreen. b Z-stack STED images of spongiform domain showing an elaborate reticular meshwork. c Loop-like structures observed in the spongiform domain. d Orthogonal views of a loop-like structure. e 3D view of the loop-like structure shown in d. f Frequency distribution of loop inner perimeter (n = 297 from 4 slices). g Frequency distribution of loop inner area (n = 297 from 4 slices). h Nodes at branch points (branched) and along the shaft (en passant) (left) and the percentage of respective structures (right). Nodes frequently form branch points (n = 261 nodes from 14 slices). i Frequency distribution of node width (n = 109 nodes from 14 slices). j Frequency distribution of shaft length connecting two neighbor nodes. Nodes were closely spaced (n = 174 shafts from 11 slices). k Distribution of shaft width. Shaft width was frequently below the diffraction limit of conventional light microscopy (<200 nm; gray box), making the use of super-resolution approach necessary (n = 94 shafts from 14 slices). (See also Supplementary Figs. 1 and 2).
Fig. 2
Fig. 2. Novel astrocytic structures also exist in different experimental preparations and brain regions.
Left: 2P overview image of astrocytes expressing Clover in stratum radiatum (a), dentate gyrus (b) from acute slices (n = 4 slices), and in barrel cortex in vivo (c) (n = 5 animals). Middle: 2P image of spongiform domain displaying a reticular meshwork in stratum radiatum (a), dentate gyrus (b) from acute slices (n = 4 slices), and in barrel cortex in vivo (c) (n = 5 animals). Right: 2P-STED (a, b) or 2P (c) images of loop-like structures (left) and nodes (right) in stratum radiatum (a), dentate gyrus (b) from acute slices (n = 4 slices), and in barrel cortex in vivo (c) (n = 5 animals).
Fig. 3
Fig. 3. Majority of spines are contacted by nodes.
a Two-color STED image of morphological interaction between astrocytic spongiform domain (green) and a dendrite (magenta). b Images of spines contacted by nodes, shafts, and spines lacking an astrocytic structure in their vicinity. c Percentage of spines contacted by nodes, shafts, and spines lacking an astrocytic structure in their vicinity. The majority of spines are contacted by at least one node (n = 188 spines from 21 slices). d Image of extracellular space (black) surrounding a synapse (gray) and astrocyte (yellow). Right image indicates the putative identity of the synaptic components. e Frequency distribution of node area. Nodes were highly variable in size (n = 103 nodes from 21 slices). f Correlation between node area and spine head area. Node area was strongly positively correlated with spine head area (n = 103 structures from 21 slices; Spearman r = 0.669, ****p (two-tailed) < 0.0001). g Frequency distribution of fraction of spine coverage by astrocytic node, showing that spine surfaces were mostly node-free (n = 103 spines from 21 slices). h Correlation between coverage fraction and spine head area. Large spines had similar coverage fractions as small spines (n = 103 spines from 21 slices; Spearman r = 0.086, p (two-tailed) = 0.38). i Two-color STED image of morphological interaction between astrocytic spongiform domain (green) and an axon (magenta). j Images of boutons contacted by nodes and boutons lacking an astrocytic structure in their vicinity. k Percentage of boutons contacted by nodes and boutons lacking an astrocytic structure in their vicinity. Node-contacted boutons account for the majority of boutons (n = 35 boutons from 5 slices). l Correlation between node area and bouton head area. Bouton area was positively correlated with node area (n = 35 structures from 7 slices; Spearman r = 0.5689, ***p (two-tailed) = 0.0004). m Correlation between fraction of bouton coverage by astrocytic node and bouton area. Large boutons had similar coverage fractions as small boutons (n = 35 boutons from 5 slices; Spearman r = 0.2874, p (two-tailed) = 0.0941).
Fig. 4
Fig. 4. Node-spine contacts are largely stable.
a Time-lapse STED imaging of a spine (magenta) and a node (green) over 150 min acquired every 30 min. While contacting node can move on the spine surface, the overall contact is maintained. b Comparison between spine motility index and contacting nodes. Motility index of the node was significantly higher than that of spines (n = 18 structures from 5 slices; Paired t-test, ****p (two-tailed) < 0.0001). c Changes of coverage state over time normalized to the coverage state at 0 min (n = 18 spines from 5 slices). d Correlation between fluctuation (the temporal variance of coverage fraction) and spine head area (n = 18 spines from 5 slices; Spearman r = −0.5947, p (two-tailed) = 0.0092. Large node/large spine contact was more stable. e Correlation between spine head size and spine motility index. Large spines were less motile than small spines (n = 18 spines from 5 slices; Pearson R2 = 0.24, p (two-tailed) = 0.039).
Fig. 5
Fig. 5. Astrocytic nodes are biochemically compartmentalized.
a, c An example of node (a) and shaft (c). White line indicates the site of imaging and 2P bleaching (left). Fluorescence recovery over time. Red arrow indicates the timing of 2P bleaching (right). b, d FRAP traces obtained from experiments shown in (a, c), showing the recovery of fluorescence normalized to the fluorescence before bleaching. Single exponential equation used for the fit is overlaid with the original trace. e Correlation between width ratio (Node or shaft width at the bleach location/shaft width 1 μm away from the bleach location) and τ (n = 66 structures from 7 slices; Spearman r = 0.7179, ****p (two-tailed) < 0.0001). Higher width ratio was associated with longer τ. f Comparison of τ between nodes (n = 27) and shafts (n = 39), indicating that the anatomical parameters of nodes shaped the degree of compartmentalization (Mann–Whitney U test, ****p (two-tailed) < 0.0001,). Data are presented as median, interquartile range, and whiskers 10–90%.
Fig. 6
Fig. 6. Astrocytic nodes exhibit microdomain Ca2+ signals.
a A confocal overview image of a GCaMP6s-expressing astrocyte. b A zoom image of a box in (a). ROIs were manually placed on typical nodes. The general anatomical layout of shafts and nodes are still recognizable in confocal images. Nodes typically appear as bright spots at branch points. c Spontaneous Ca2+ traces from ROIs shown in b, showing that each node exhibits unique pattern of Ca2+ signals. d Time-lapse images of Ca2+ events, which were spatially restricted to a single node (right), and the corresponding confocal image of the structure where node is indicated with a white triangle (left). e Time-lapse images of a Ca2+ event, which originated at a node and spread via the connecting shafts to a neighboring node (right), and the corresponding confocal image of the structure where the originating node is indicated with a white triangle and neighbor node is indicated with a yellow triangle (left). f Frequency distribution of amplitude of Ca2+ events (n = 1583 events from 5 slices). g Frequency distribution of duration of Ca2+ events (n = 1583 events from 5 slices). h Frequency distribution of spread of Ca2+ events. In 59% of the events, the spread was less than 1 µm2 (n = 1583 events from 5 slices). i Frequency distribution of spread of Ca2+ events under 1 µm2, suggesting that the majority of Ca2+ events in the spongiform domain were confined to local domains corresponding to single nodes (n = 941 events from 5 slices).
Fig. 7
Fig. 7. Nodes are sites of initiation of Ca2+ signals in astrocytic processes.
a Confocal time-lapse images of a spontaneous Ca2+ event that was confined to a single node (right) and the corresponding STED image of the underlying structure (left). b Confocal time-lapse images of a non-confined spontaneous Ca2+ event (right) and the corresponding STED image (left). c Percentage of Ca2+ events that were confined to single nodes, non-confined and that occurred at other undefined structures. The majority of spontaneous Ca2+ events are confined (n = 516 events from 11 slices). d Ca2+ traces of the non-confined Ca2+ event described in b (right) from ROIs indicated on the corresponding STED image (left). N1: node that initiated the Ca2+ event, S: neighbor shaft, N2: connected neighbor node. e Percentage of Ca2+ events that were initiated at nodes, and those where the point of initiation could not be determined node and/or shaft, among the non-confined Ca2+ events (n = 19 events from 9 slices). f Correlation between Amplitude ratio (amplitude at neighbor node/amplitude at initiation node) and interconnecting shaft length. The spread of the Ca2+ signal did not depend on shaft length (n = 16 events from 7 slices; Spearman r = 0.2941, p (two-tailed) = 0.2681). g Correlation between amplitude ratio and interconnecting shaft width. The spread of the Ca2+ signal was correlated with shaft width (n = 16 events from 7 slices; Spearman r = 0.7382, **p (two-tailed) = 0.0016). h Frequency of Ca2+ events under control and TTX (1 µM) conditions. (n = 14 cells from 4 slices for both conditions; Mann–Whitney U test p (two-tailed) = 0.38, N.S., not significant). Data are presented as median, interquartile range, and whiskers 10–90%. i Frequency of Ca2+ events under control and Bafilomycin A1 (Baf, 2 µM) conditions. The frequency was significantly reduced by bafilomycin A1, suggesting that miniature synaptic events triggered the Ca2+ transients (n = 21 cells from 4 slices for control and n = 23 cells from 4 slices for Bafilomycin A1 condition; Mann–Whitney U test, ****p (two-tailed) < 0.0001). Data are presented as median, interquartile range, and whiskers 10–90%. j Frequency of Ca2+ events under control and 2APB (100 µM) conditions. 2APB significantly decreased frequency of Ca2+ transients, indicating the involvement of IP3Rs (n = 12 cells from 4 slices for both conditions; Mann–Whitney U test, *p (two-tailed) = 0.0425). Data are presented as median, interquartile range, and whiskers 10–90%. k Frequency of Ca2+ events under control and Thapsigargin (Thapsi, 2 µM) conditions. Thapsigargin significantly decreased frequency of Ca2+ transients, indicating the involvement of internal Ca2+ stores (n = 13 cells from 3 slices for control and n = 15 cells from 3 slices for Thapsigargin condition; Mann–Whitney U test, **p (two-tailed) = 0.0017). Data are presented as median, interquartile range, and whiskers 10–90%.
Fig. 8
Fig. 8. Astrocytic nodes are likely functional component of excitatory tripartite synapses.
a Confocal Ca2+ signal in node mapped onto STED image of spine morphology. b A STED image of YFP-labeled neuron and GCaMP6s-expressing astrocyte. c Spontaneous Ca2+ traces from ROIs shown in b. Note that nodes exhibit unique activation patterns. df Left: A STED images of YFP-labeled neurons and GCaMP6s-expressing astrocytes. Right: Ca2+ activity mapped onto dendritic morphology, where the Ca2+ event remained confined to a single node (d), where two perisynaptic nodes were co-active (e) or where a Ca2+ wave appeared to propagate within the local astrocytic network (f). g Percentage of perisynaptic Ca2+ events confined to single nodes or involving multiple nodes, showing that majority of Ca2+ events was confined (n = 61 events from 30 slices). h Correlation between spine size and area under curve (A.U.C.) of the node Ca2+ event. Large spines were associated with large Ca2+ events in nodes (n = 26 structures from 24 slices; Spearman r = 0.453, *p (two-tailed) = 0.0201). i Summary schematic of the tripartite synapse micro-environment consisting of a presynaptic bouton, dendritic spine, astrocytic node, shaft, loop and extracellular space (ECS). Nodes appear as the functional astrocytic component of excitatory tripartite synapses, which may provide the anatomical basis for synapse-specific communication.

References

    1. Araque, A., Parpura, V., Sanzgiri, R. P. & Haydon, P. G. Tripartite synapses: glia, the unacknowledged partner. Trends Neurosci.22, 208–215 (1999). - PubMed
    1. Witcher, M. R., Kirov, S. A. & Harris, K. M. Plasticity of perisynaptic astroglia during synaptogenesis in the mature rat hippocampus. Glia55, 13–23 (2007). - PubMed
    1. Araque, A. et al. Gliotransmitters travel in time and space. Neuron81, 728–739 (2014). - PMC - PubMed
    1. Di Castro, M. A. et al. Local Ca2+ detection and modulation of synaptic release by astrocytes. Nat. Neurosci.14, 1276–1284 (2011). - PubMed
    1. Panatier, A. et al. Astrocytes are endogenous regulators of basal transmission at central synapses. Cell146, 785–798 (2011). - PubMed

Publication types