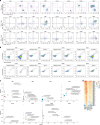
. 2020 Apr 20;11(1):1894.
doi: 10.1038/s41467-020-15606-0.

Molecular profiling of driver events in metastatic uveal melanoma

Affiliations

Molecular profiling of driver events in metastatic uveal melanoma

Joakim Karlsson et al. Nat Commun. .

Abstract

Metastatic uveal melanoma is less well understood than its primary counterpart, has a distinct biology compared to skin melanoma, and lacks effective treatments. Here we genomically profile metastatic tumors and infiltrating lymphocytes. BAP1 alterations are overrepresented and found in 29/32 of cases. Reintroducing a functional BAP1 allele into a deficient patient-derived cell line, reveals a broad shift towards a transcriptomic subtype previously associated with better prognosis of the primary disease. One outlier tumor has a high mutational burden associated with UV-damage. CDKN2A deletions also occur, which are rarely present in primaries. A focused knockdown screen is used to investigate overexpressed genes associated withcopy number gains. Tumor-infiltrating lymphocytes are in several cases found tumor-reactive, but expression of the immune checkpoint receptors TIM-3, TIGIT and LAG3 is also abundant. This study represents the largest whole-genome analysis of uveal melanoma to date, and presents an updated view of the metastatic disease.


Conflict of interest statement

The authors declare no competing interests.

Figures
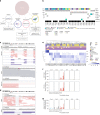
Fig. 1
Fig. 1. Mutations in metastatic uveal melanoma (UM).
a Overview schematic of the study. Thirty-two samples were subjected to whole-genome sequencing and 28 to RNA sequencing. Eighty tumors from TCGA were compared in copy number analyses. TILs from 15 tumors were used for antigen-reactivity assays and 5 of these, as well as 3 other tumors were used for single-cell analyses of TIL phenotypes. b Mutations in genes recurrently altered in UM. Chromosome 3 status is indicated. c Intronic non-splice site point mutation in BAP1, associated with aberrant splicing. d Intronic large deletion in BAP1 associated with aberrant splicing. e Estimated contributions of COSMIC mutational signatures. Samples and signatures are ordered by agglomerative hierarchical clustering. Signatures with estimated contribution <30% excluded. n = 32 independent UM samples were included and n = 2 cutaneous melanomas (representing two metastases from one patient) sequenced at the same time were included for comparison. Signatures were inferred using both synonymous and non-synonymous mutations. CM: cutaneous melanoma. f Overall mutational spectrum of UM11, based on WGS data. The canonical profile of the UV-associated “signature 7” is shown for comparison. g Mutational spectrum from exome data of an unrelated primary iris melanoma.
Fig. 2
Fig. 2. Copy number analysis.
a Copy number profiles of each tumor. Differences in color intensity depend on copy number amplitude and tumor purity. b Broad copy number changes enriched in the metastases (n = 32) compared with TCGA tumors (n = 80). Two-tailed Fisher’s exact tests with adjustment for multiple testing using the Benjamini–Hochberg method. c Two primary tumors compared with matched metastases. d Focal deletions of CDKN2A in two samples. e RNA-seq from the UM9 metastasis and corresponding PDX showing the region with focal CDKN2A deletion. f Genes in recurrent arm-level copy number aberrations ranked by associations between gene expression and copy number that were consistent in this cohort and TCGA tumors, and further ranked by protein–protein interaction network degree from the Human Protein Reference Database (HPRD), and additionally by presence of any associations with worse survival. The top three candidates are shown in each region. Connecting lines represent protein interactions of the highest ranked gene per region. Blue represents regions of loss and red regions of gain. Summarized representations of copy number profiles per region show the relative numbers of gain and loss events, with the inner circle representing TCGA samples and the outer our cohort. For the metastatic cohort, n = 28 samples with matching DNA and RNA data were included. g Pathways enriched among the combined set of the top 10 genes per region of gain or loss. h Functional interrogation by siRNA of main candidate genes whose expression is elevated due to copy number alteration. Cells were counted or viability was measured at 72 h, 96 h and 96 h for the cell lines UM22, MP-41, and 92-1, respectively, after transfection of the siRNA pools. n = 3 samples were transfected independently, for each cell line. Data are presented as mean values ± standard error of the mean (SEM). Two-way ANOVA was used to estimate differences, taking into account both cell line and target gene as variables. q values were calculated using Benjamini–Hochberg correction, taking into account all genes in h as well as those in Supplementary Fig. 3c, which shows other candidates of interest investigated. Dotted lines indicate q = 0.05.
Fig. 3
Fig. 3. Reintroduction of BAP1 into a deficient tumor.
a Schematic representation of the experiment. Cell lines from a PDX model established from tumor UM22 were transduced with either BAP1 wild-type containing viral vectors or empty vectors and subjected to RNA sequencing. b BAP1 protein levels in empty vector controls and BAP1-reintroduced cells. The BAP1 wild-type cell lines MP-41 and 92-1 are shown for comparison of expressed BAP1 levels with the same respective treatments. Full gel images are shown in Supplementary Fig. 5e. The western blot was repeated twice with similar results using biological replicates. Ctrl: control. c IHC staining in PDX models for BAP1 expression in empty vector controls and BAP1-reintroduced cells. Scale bars represent 100 µm. Shown is one staining per cell line performed on sections from tumors from one mouse out of three transplanted mice per cell line. d Differentially expressed genes for q < 0.05 and absolute log2 fold change > 1. n = 3 independently grown samples of cells derived from either the case or control cell lines, respectively, were used and differences were assessed using DESeq2. Genes from a clinical assay distinguishing the class I and II UM subtypes are indicated, with blue indicating upregulation in BAP1-reintroduced cells, and red representing downregulation. e Top 10 enriched Reactome gene sets. f RT-qPCR results for the genes indicated in d, with n = 3 technical replicates. g Gene set enrichment analysis with respect to the MSigDB chemical and genetic perturbations category, with results from the two sets discriminating between class I and II subtypes shown,. h Downregulation of immune checkpoint ligand-related genes upon BAP1 reintroduction, as determined from RNA-seq data on n = 3 independently grown samples of cells derived from either the case or control cell lines, respectively. Horizontal lines indicate median, lower, and upper bounds of boxes represent the first and third quartiles, whiskers represent the smallest/largest data point at most 1.5 times inter-quartile range from the lower and upper bound, respectively.
Fig. 4
Fig. 4. Analysis of tumor-infiltrating lymphocytes.
a Proportions of CD8+ and CD4+ T cells from biopsy material, and proportions of these that were positive for PD-1 and CD39. Sample UM22 was derived from a patient that has previously been treated with chemotherapy, possibly affecting TIL proportions in this sample. b Assessment of T-cell reactivity against MART-1,  gp100 and NY-ESO-1 in yTIL cultures. Proportions found to be reactive are indicated. Samples tested were those with the HLA-A*02:01 genotype, as this genotype is known to present MART-1 and gp100. Samples with this genotype (Supplementary Data 7) that are not shown were also tested and found to be negative. c Analysis of relative levels of PDCD1 (PD-1) and ENTPD1 (CD39) expression among different CD8+ T-cell clonotypes, determined by single-cell RNA-seq of yTILs. Clonotypes with one pair of alpha and beta chain were included, and the ones with greatest expression of both markers are highlighted. Point sizes are proportional to clonotype frequency. Gray color indicates clones that were negative for either PDCD1 or ENTPD1, whereas other colors indicate different clonotypes that correspond to those in Supplementary Fig. 7e. d Expression of T-cell markers and checkpoint receptors in bulk RNA-seq data from biopsies (batch-corrected log2 RPKM normalized values). yTILs young TILs, TILs isolated and expanded from a biopsy with a low dose of IL-2.

References

    1. Singh AD, Turell ME, Topham AK. Uveal melanoma: trends in incidence, treatment, and survival. Ophthalmology. 2011;118:1881–1885. doi: 10.1016/j.ophtha.2011.01.040. - DOI - PubMed
    1. Rantala ES, Hernberg M, Kivelä TT. Overall survival after treatment for metastatic uveal melanoma: a systematic review and meta-analysis. Melanoma Res. 2019;29:561–568. doi: 10.1097/CMR.0000000000000575. - DOI - PMC - PubMed
    1. Yang J, Manson DK, Marr BP, Carvajal RD. Treatment of uveal melanoma: where are we now? Ther. Adv. Med. Oncol. 2018;10:1758834018757175. - PMC - PubMed
    1. Robertson, A. G. et al. Integrative analysis identifies four molecular and clinical subsets in uveal melanoma. Cancer Cell32, 204–220 (2017). - PMC - PubMed
    1. Moore AR, et al. Recurrent activating mutations of G-protein-coupled receptor CYSLTR2 in uveal melanoma. Nat. Genet. 2016;48:675–680. doi: 10.1038/ng.3549. - DOI - PMC - PubMed

Publication types

MeSH terms

Substances