. 2020 Apr 20;11(1):1871.
doi: 10.1038/s41467-020-15796-7.

Perturbing proteomes at single residue resolution using base editing

Affiliations

Perturbing proteomes at single residue resolution using base editing

Philippe C Després et al. Nat Commun. .

Abstract

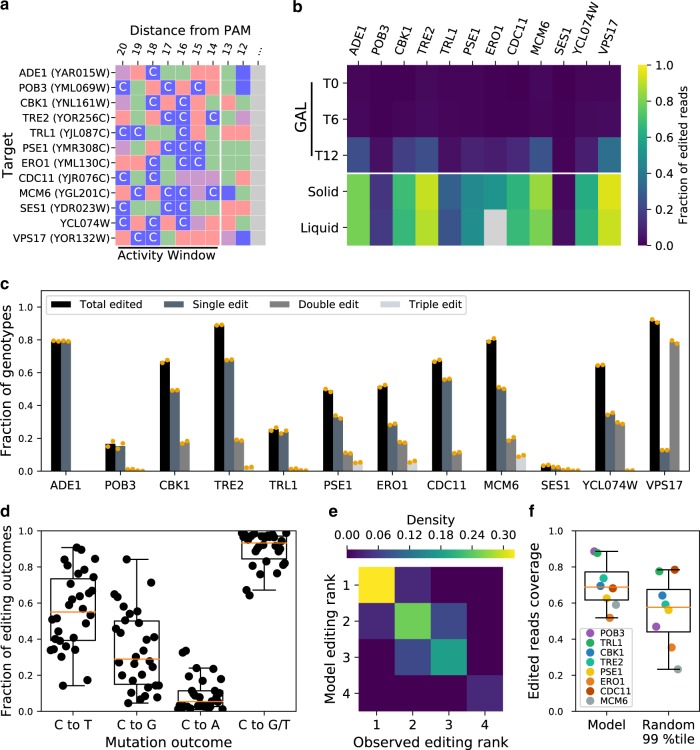
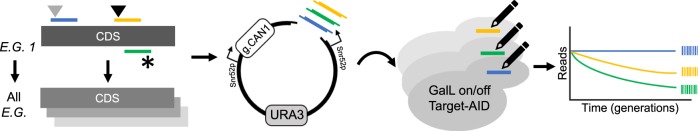
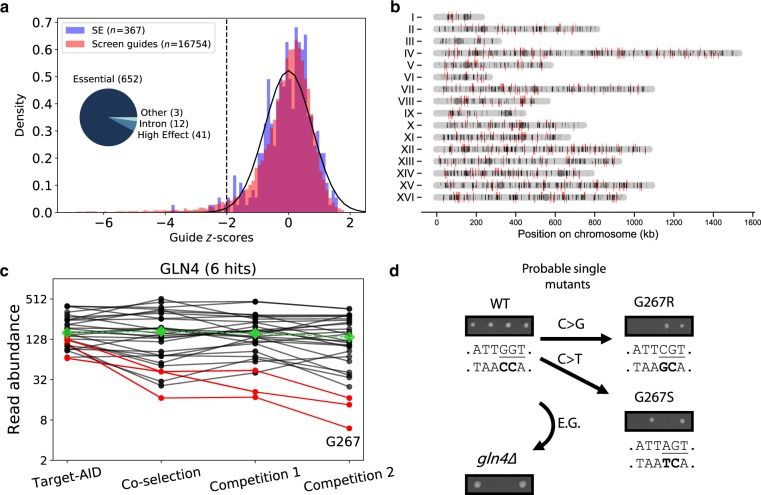
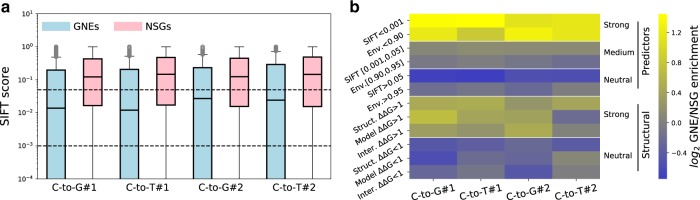
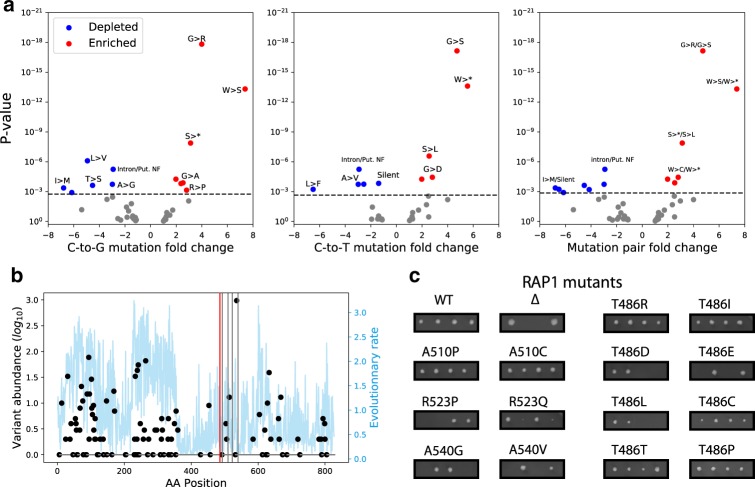
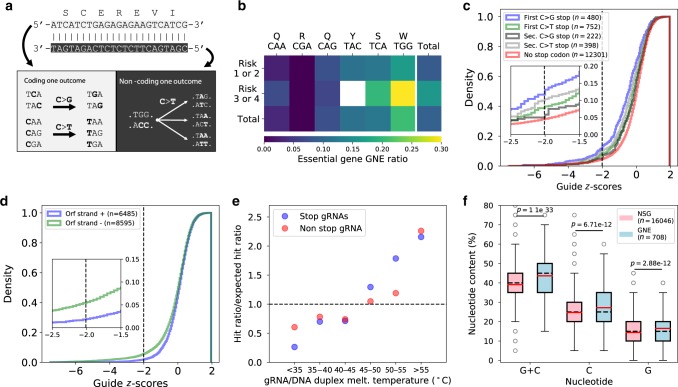
Base editors derived from CRISPR-Cas9 systems and DNA editing enzymes offer an unprecedented opportunity for the precise modification of genes, but have yet to be used at a genome-scale throughput. Here, we test the ability of the Target-AID base editor to systematically modify genes genome-wide by targeting yeast essential genes. We mutate around 17,000 individual sites in parallel across more than 1500 genes. We identify over 700 sites at which mutations have a significant impact on fitness. Using previously determined and preferred Target-AID mutational outcomes, we find that gRNAs with significant effects on fitness are enriched in variants predicted to be deleterious based on residue conservation and predicted protein destabilization. We identify key features influencing effective gRNAs in the context of base editing. Our results show that base editing is a powerful tool to identify key amino acid residues at the scale of proteomes.


Conflict of interest statement

The authors declare no competing interests.

Figures

Fig. 1
Fig. 1. A parsimonious model predicts the most probable outcomes of Target-AID mutagenesis.
a gRNAs included in the time course base editing experiment had diverse C content profiles in the Target-AID activity window. Nucleotides are color coded: guanines are purple, thymines are red, adenines are green and cytosines are blue. b Overall fraction of edited reads for all target sites along time points in the experiment: T0 (start of induction), T6 (mid induction), T12 (end of induction). The solid time point represents surviving cells plated after galactose induction, while the liquid time point represents the cell population after canavanine co-selection. Amplification of the ERO1 target site from the liquid recovery time points was unsuccessful (shown in gray), and as such the solid recovery time point was used instead for the other analysis steps. c Fraction of genotypes with either one, two or three edits compared to the total fraction of reads that were edited. d Editing outcome type for all sites with a total editing rate greater than one percent after co-selection (n = 30 cytosines across all targeted sites). The C to G/T distribution represents the sum of editing that resulted in a C to G or C to T mutation. Position-wise editing rates and outcomes are shown in Supplementary Figs. 5 and 6. e Agreement between the predicted nucleotide total editing rank in the model used to predict mutagenesis outcomes in the large-scale experiment and the deep sequencing data (n = 28 sites, 10 gRNAs: gRNA specific predicted and observed rankings are presented in Supplementary Figs. 5 and 6). The gRNAs targeting ADE1 and SES1 were respectively excluded from the analysis because there is only one editable site in the activity window and total editing rate was too low. f Edited read coverage of the mutation outcome prediction model and the 99th percentile of edited allele combinations (n = 4 genotypes in both cases) for the gRNAs with editing activity included in the large-scale experiment. Boxplots represent the upper and lower quartiles of the data, with the median shown as a yellow bar. Whiskers extend to 1.5 times the interquartile range (Q3–Q1) at most. Source data are available in the Source Data file.
Fig. 2
Fig. 2. A gRNA library for systematic perturbation of essential genes using the Target-AID base editor.
Essential genes (ex.: E.G.1) were scanned for sites appropriate for Target-AID mutagenesis. Mutational outcomes include silent (gray triangle), missense (black triangle) mutations, as well as stop codons (*). DNA fragments corresponding to the gRNA sequences were synthesized as an oligonucleotide pool and cloned into a co-selection base editing vector. Using gRNAs as molecular barcodes, the abundance of cell subpopulations bearing mutations is then measured after mutagenesis and bulk competition. Mutations with fitness effects are inferred from reductions in the relative gRNA abundances.
Fig. 3
Fig. 3. High-throughput forward mutagenesis by Target-AID base editing identifies sensitive sites across the yeast genome.
a Cumulative distribution of z-scores of the log2 fold-change in gRNA abundance between mutagenesis and the end of the bulk competition experiment. Scores were calculated using the distribution of abundance variation of gRNAs with synthesis errors (SE). The fitted normal distribution is shown as a black line, and the 10% FDR threshold as a dotted black line. The distribution of target types in the 708 gRNAs with Negative Effects (GNE) is shown in the inset. b Positions of base editing target sites in the yeast genome. Telomeric regions are depleted in target sites because very few essential genes are located there. GNEs are shown in red, and other gRNAs are in black. The orientation of the line matches the targeted strand relative to the annotated coding sequence. c Average decline in gRNA abundance (on a log scale) between time points (n = 2 replicates) after mutagenesis for gRNAs targeting GLN4 (n = 30 gRNAs), a tRNA synthetase. Median gRNA abundance across the entire library over time is shown in green. The red lines represent the gRNAs categorized as having a significant effect (GNE) for this gene, while non-significant gRNAs (NSG) are shown in black. The gRNA with the most extreme z-score targets residue G267. d Mutagenesis of Gln4-G267 validates its essential role for protein function. Tetrad dissection of a heterozygous deletion mutant bearing an empty vector results in only two viable spores, while the wild-type copy in the same vector restores growth. Dissection of the two heterozygous mutants bearing a plasmid with the most probable single mutant based on the known activity window of Target-AID shows both mutations are lethal. Source data are available in the Source Data file.
Fig. 4
Fig. 4. GNE induced mutations are enriched in predicted deleterious effects.
a SIFT score distributions for the most likely induced mutations of both GNEs (blue) and NSGs (red). The thresholds for the categories used in the enrichment calculations in b are shown as black dotted lines. SIFT scores represent the probability of a specific mutation being tolerated based on evolutionary information: the first threshold of 0.05 was set by the authors in the original manuscript but might be permissive considering the number of mutations tested in our experiment (n = 571, 12,718, 457, 8767, 430, 7609, 343, 5847). All GNE vs NSG score comparisons are significant (Welch’s t-test p-values: 1.64 × 10−21, 5.99 × 10−20, 1.62 × 10−12, 1.75 × 10−9). Boxplots represent the upper and lower quartiles of the data, with the median shown as a black bar. Whiskers extend to 1.5 times the interquartile range (Q3–Q1) at most. Outliers are shown in gray. The box cutoff is due to the large fraction of mutations for which the SIFT score is 0. b Enrichment folds of GNEs over NSGs for different variant effect prediction measurements. Envision score (Env.), SIFT score (SIFT), protein folding stability based on solved protein structures (Struct. ∆∆G), protein folding based on homology models (Model ∆∆G) and protein–protein interaction interface stability based on structure data (Inter. ∆∆G). The predictions based on conservation and experimental data are grouped under ‘Predictors’ and those based on the computational analysis of protein structures and complexes under ‘Structural’. Source data are available in the Source Data file.
Fig. 5
Fig. 5. GNE mutations are enriched for specific amino acid substitution patterns and identify critical sites for protein function.
a Fold depletion and enrichment volcano plots for the most probable mutations induced by GNEs in the screen. Enrichment and depletion values were calculated by comparing the relative abundance of each mutation among GNEs and NSGs using two-sided Fisher’s exact tests. Mutation patterns significantly depleted are shown in blue, while those that are enriched are in red. The significance threshold was set using the Holm–Bonferroni method at 5% FDR to correct for multiple testing and is shown as a dotted gray line. b Protein variant frequency among 1000 yeast isolates (black dots) and residue evolutionary rate across species (blue line) for RAP1. The target site for the GNEs targeting T486 is highlighted by a red line while the other detected GNEs target sites are shown by a gray line. c Tetrad dissections confirm most RAP1 GNE induced mutations indeed have strong fitness effects, as well as other substitutions targeting these sites. Source data are available in the Source Data file.
Fig. 6
Fig. 6. gRNA and target properties affect mutagenesis efficiency.
a Since Target-AID can generate both C to G and C to T mutations, many codons can be targeted to create premature stop codons. The TGG (W) codon is the only one targeted on the non-coding strand as ACC. b GNE ratio for SGGs targeting different codons in essential genes, split by co-editing risk categories, where 1 and 2 represent low or very low co-editing risk while 3 or 4 represent moderate to high co-editing risk. c Cumulative z-score density of SGGs grouped by the mutational outcome generating the stop codon. A higher rate of GNE is observed for gRNAs for which a C-to-G mutation at the highest editing activity position generates a stop codon mutation. The significance threshold is shown as a black dotted line. d Cumulative z-score density of gRNAs that do not generate stop codons targeting either the coding or non-coding strand. e SGG and non-SGG GNE enrichment compared to the expected GNE ratio for different melting temperature ranges. f GC, C, and G content of NSGs and GNEs. Distribution medians are shown as black dotted lines and means are shown as red lines. P-values were calculated using Welch’s t-tests. Boxplots represent the upper and lower quartiles of the data, and whiskers extend to 1.5 times the interquartile range (Q3–Q1) at most. Outliers are shown in gray.

References

    1. Fowler DM, Fields S. Deep mutational scanning: a new style of protein science. Nat. Methods. 2014;11:801–807. doi: 10.1038/nmeth.3027. - DOI - PMC - PubMed
    1. Gray VE, Hause RJ, Luebeck J, Shendure J, Fowler DM. Quantitative missense variant effect prediction using large-scale mutagenesis data. Cell Syst. 2018;6:116–124.e3. doi: 10.1016/j.cels.2017.11.003. - DOI - PMC - PubMed
    1. Winzeler EA, et al. Functional characterization of the S. cerevisiae genome by gene deletion and parallel analysis. Science. 1999;285:901–906. doi: 10.1126/science.285.5429.901. - DOI - PubMed
    1. Giaever G, et al. Functional profiling of the Saccharomyces cerevisiae genome. Nature. 2002;418:387–391. doi: 10.1038/nature00935. - DOI - PubMed
    1. The C. elegans Deletion Mutant Consortium. Large-scale screening for targeted knockouts in the Caenorhabditis elegans Genome. G3 (Bethesda)2, 1415–1425 (2012). - PMC - PubMed

Publication types

LinkOut - more resources