. 2020 Apr 20;11(1):1914.
doi: 10.1038/s41467-020-15624-y.

The endoplasmic reticulum stress-autophagy pathway controls hypothalamic development and energy balance regulation in leptin-deficient neonates

Affiliations

The endoplasmic reticulum stress-autophagy pathway controls hypothalamic development and energy balance regulation in leptin-deficient neonates

Soyoung Park et al. Nat Commun. .

Abstract

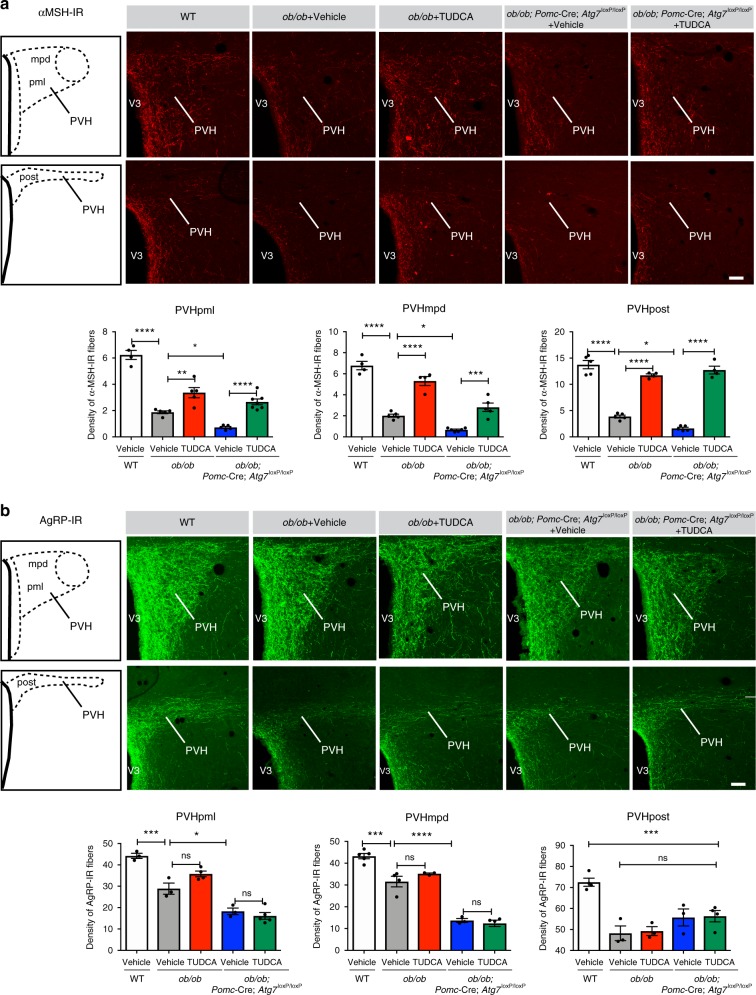
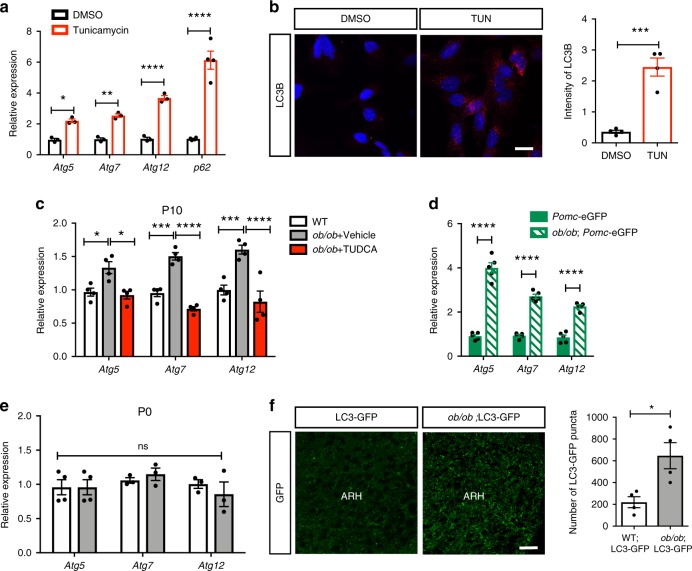
Obesity is associated with the activation of cellular responses, such as endoplasmic reticulum (ER) stress. Here, we show that leptin-deficient ob/ob mice display elevated hypothalamic ER stress as early as postnatal day 10, i.e., prior to the development of obesity in this mouse model. Neonatal treatment of ob/ob mice with the ER stress-relieving drug tauroursodeoxycholic acid (TUDCA) causes long-term amelioration of body weight, food intake, glucose homeostasis, and pro-opiomelanocortin (POMC) projections. Cells exposed to ER stress often activate autophagy. Accordingly, we report that in vitro induction of ER stress and neonatal leptin deficiency in vivo activate hypothalamic autophagy-related genes. Furthermore, genetic deletion of autophagy in pro-opiomelanocortin neurons of ob/ob mice worsens their glucose homeostasis, adiposity, hyperphagia, and POMC neuronal projections, all of which are ameliorated with neonatal TUDCA treatment. Together, our data highlight the importance of early life ER stress-autophagy pathway in influencing hypothalamic circuits and metabolic regulation.


Conflict of interest statement

The authors declare no competing interests.

Figures

Fig. 1
Fig. 1. Leptin deficiency increases endoplasmic reticulum stress markers in the developing hypothalamus.
Relative expression of activating transcription factor 4 (Atf4), 6 (Atf6), X-box binding protein (Xbp1), glucose regulated protein GRP78 (referred to as Bip), and CCAAT-enhancer-binding protein homologous protein (Chop) mRNA a in the hypothalamus of embryonic day (E)14.5 mice (n = 4–5 per group) and b in the arcuate nucleus (ARH) of postnatal day (P) 0 wild-type (WT) and leptin-deficient (ob/ob) mice (n = 5–6 per group). c Relative expression of Atf4, Atf6, Xbp1, Bip, and Chop mRNA in the ARH of P10 WT mice and ob/ob mice treated neonatally either vehicle or tauroursodeoxycholic acid (TUDCA) or leptin (WT, ob/ob + Vehicle, ob/ob + TUDCA n = 4, ob/ob + Leptin: n = 5 per group). d Representative images and quantification of Atf4, Atf6, Xbp1, Bip, and Chop mRNA (green) in arcuate pro-opiomelanocortin (Pomc)- (white) and agouti-related peptide (Agrp) (red) mRNA-expressing cells of WT and ob/ob mice at P10 (n = 3–4 per group). e Relative expression of Atf4, Atf6, Xbp1, Bip, and Chop mRNA in the ARH of 10-week-old adult WT mice and ob/ob mice treated neonatally either vehicle or TUDCA (n = 6 per group). Relative expression of Atf4, Atf6, Xbp1, Bip, and Chop mRNA in the paraventricular nucleus (PVH) of f P0 (n = 4 per group), g P10 (n = 6 per group), and h 10-week-old adult WT mice and ob/ob mice treated neonatally either vehicle or TUDCA (n = 6 per group). i Relative expression of Atf4, Atf6, Xbp1, Bip, and Chop mRNA in hypothalamic mHypoE-N43/5 cell lysates treated with dimethyl sulfoxide (DMSO, control) or leptin (LEP, 100 ng/ml) or tunicamycin (TUN, 0.1 µg/ml) or TUN + LEP for 5 h (n = 4 per group). Error bars represent the SEM. *P ≤ 0.05, **P ≤ 0.01, ***P ≤ 0.001, and ****P ≤ 0.0001 versus ob/ob mice (d, f), *P ≤ 0.05, **P ≤ 0.01, ****P ≤ 0.0001 versus vehicle-injected ob/ob mice (c, e, g, h). **P ≤ 0.01 and ****P ≤ 0.0001 versus tunicamycin treated group (i). Statistical significance was determined using two-way ANOVA followed by Tukey’s Multiple Comparison test (ai). Scale bar, 5 µm (d). Source data are provided as a Source Data file.
Fig. 2
Fig. 2. Neonatal TUDCA treatment causes long-term beneficial metabolic effects inob/obmice.
a Growth curves of wild-type (WT) mice and leptin-deficient (ob/ob) mice treated neonatally with vehicle or tauroursodeoxycholic acid (TUDCA) (n = 8 per group). b Food intake (WT: n = 5, ob/ob + Vehicle, ob/ob + TUDCA: n = 4 per group) and c body composition of 4- (n = 3 per group) and 10-week-old (n = 4–5 per group) WT mice and ob/ob mice treated neonatally with vehicle or TUDCA. d Respiratory exchange ratio (WT: n = 5, ob/ob + Vehicle, ob/ob + TUDCA: n = 4 per group), e energy expenditure (WT: n = 7, ob/ob + Vehicle, ob/ob + TUDCA: n = 3 per group), and f locomotor activity of 6-week-old WT mice and ob/ob mice treated neonatally with vehicle or TUDCA (WT: n = 7, ob/ob + Vehicle, ob/ob + TUDCA: n = 3 per group). g, h Glucose tolerance tests (GTT) and area under the curve (AUC) quantification of 4-week-old (WT: n = 5, ob/ob + Vehicle, ob/ob + TUDCA: n = 8 per group) (g) and 8-week-old (WT: n = 5, ob/ob + Vehicle: n = 6, ob/ob + TUDCA: n = 10 per group) (h) WT mice and ob/ob mice treated neonatally with vehicle or TUDCA (n = 5–10 per group). i Insulin tolerance test (ITT) and area under the ITT curve (AUC) of 9-week-old WT mice and ob/ob mice treated neonatally with vehicle or TUDCA (WT, ob/ob + Vehicle: n = 5, ob/ob + TUDCA: n = 9 per group). j Serum insulin levels of 10- to 12-week-old fed WT mice and ob/ob mice treated neonatally with vehicle or TUDCA (n = 7 per group). Error bars represent the SEM. *P < 0.05, **P ≤ 0.01, ***P ≤ 0.001, and ****P ≤ 0.0001 versus vehicle-injected ob/ob mice (a, gi), #P < 0.05, ##P ≤ 0.01, ###P ≤ 0.001, and ####P ≤ 0.0001 versus WT mice (a, gi). *P < 0.05, ***P ≤ 0.001, and ****P ≤ 0.0001 versus WT mice and *P < 0.05, **P ≤ 0.01, and ****P ≤ 0.0001 versus vehicle-injected ob/ob mice (bf, j). Statistical significance between groups was determined using two-tailed Student’s t test (f), one-way ANOVA (b, c, e, f, j) and AUCs in gj and two-way ANOVA (a, d, gi) followed by Tukey’s multiple comparison test. Source data are provided as a Source Data file.
Fig. 3
Fig. 3. Neonatal tauroursodeoxycholic acid treatment improves pro-opiomelanocortin axonal projections.
a, b Representative images and quantification of the density of a α-melanocyte-stimulating hormone (αMSH)—(red) and b agouti-related peptide (AgRP)—(green) immunoreactive fibers innervating the neuroendocrine (PVHpml and PVHmpd) and preautonomic (postPVH) compartments of the PVH of 10- to 12-week-old wild-type (WT) mice, leptin-deficient (ob/ob) mice treated neonatally with vehicle or tauroursodeoxycholic acid (TUDCA), and ob/ob; Pomc-Cre; Atg7loxP/loxP mice treated neonatally with vehicle or TUDCA (n = 3–6 per group). Error bars represent the ±SEM. *P ≤ 0.05, **P < 0.01, ***P ≤ 0.001, and ****P ≤ 0.0001 versus all groups. Statistical significance was determined by one-way ANOVA followed by Tukey’s multiple comparison test (a, b). PVH, paraventricular nucleus of the hypothalamus; PVH, paraventricular nucleus; PVHmpd, dorsal component of the medial parvicellular PVH; PVHpml, lateral magnocellular part of the PVH; post PVH, posterior part of the PVH; V3, third ventricle. Scale bar, 50 µm (a, b). Source data are provided as a Source Data file.
Fig. 4
Fig. 4. Neonatal tauroursodeoxycholic acid treatment improves parasympathetic innervation in the pancreas.
Representative images and quantification of islet size and the density of vesicular acetylcholine transporter(VAChT)-immunoreactive fibers (red) in the insulin+ islets (green) of 10- to 12-week-old wild-type (WT) mice, leptin-deficient (ob/ob) mice treated neonatally with vehicle or tauroursodeoxycholic acid (TUDCA), and ob/ob; Pomc-Cre; Atg7loxP/loxP mice treated neonatally with vehicle or TUDCA (n = 6–7 per group). Error bars represent the SEM. *P ≤ 0.05, **P < 0.01, and ****P ≤ 0.0001 versus all groups. Statistical significance was determined by one-way ANOVA followed by Tukey’s multiple comparison test. Scale bar, 100 µm. Source data are provided as a Source Data file.
Fig. 5
Fig. 5. Induction of ER stress and leptin deficiency promote autophagy genes.
a Relative expression of autophagy-related protein (Atg) 5, Atg7, and Atg12 mRNA in mouse hypothalamic mHypoE-N43/5 treated with DMSO (control) or tunicamycin (0.1 µg/ml) for 5 h (n = 3–4 per group). b Representative images and quantification of microtubule-associated protein light chain 3 (LC3B)-immunoreactive puncta (red) in mouse hypothalamic mHypoE-N43/5 cells treated with DMSO (control) or tunicamycin (0.1 µg/ml) for 5 h (n = 4 per group). c Relative expression of Atg5, Atg7, and Atg12 mRNA in the arcuate nucleus (ARH) of postnatal day (P)10 wild-type (WT) mice and leptin-deficient (ob/ob) mice treated with either vehicle or tauroursodeoxycholic acid (TUDCA) neonatally (n = 4 per group). d, e Relative expression of Atg5, Atg7, and Atg12 mRNA in (d) sorted Pomc-GFP cells (n = 5 per group) and e the arcuate nucleus (ARH) of P0 WT (white bars) and ob/ob (gray bars) mice (n = 3–4 per group). f Representative images and quantification of LC3-GFP+ puncta (green) in the ARH of P10 WT (white bars) and ob/ob (gray bars) mice (n = 4 per group). Error bars represent the SEM. *P ≤ 0.05, **P ≤ 0.01, ***P ≤ 0.001, and ****P ≤ 0.0001 versus DMSO-treated cells (a, b); *P ≤ 0.05, ***P ≤ 0.001, and ****P ≤ 0.0001 versus vehicle-injected ob/ob mice (c); ****P ≤ 0.0001 versus Pomc-GFP mice (d); *P ≤ 0.05 versus LC3-GFP mice (f). Statistical significance between groups was determined using two-tailed Student’s t test (b, f) and two-way ANOVA (a, c, d, e) followed by Tukey’s multiple comparison test. ARH, arcuate nucleus of the hypothalamus. Scale bars, 100 µm (b), and 20 µm (f). Source data are provided as a Source Data file.
Fig. 6
Fig. 6. Neonatal tauroursodeoxycholic acid treatment ameliorates metabolic defects inob/ob;Pomc-Cre;Atg7loxP/loxPmice.
a Representative images and quantification of ubiquitin-binding protein (p62) immunoreactivity (red) in the arcuate nucleus (ARH) of 10-week-old wild-type (WT) mice, leptin-deficient (ob/ob) mice treated neonatally with vehicle or tauroursodeoxycholic acid (TUDCA), and ob/ob; Pomc-Cre; Atg7loxP/loxP mice treated neonatally with vehicle or TUDCA (n = 5–7 per group). b Pre- (ob/ob, ob/ob; Pomc-Cre; Atg7loxP/loxP + Vehicle: n = 9, ob/ob; Pomc-Cre; Atg7loxP/loxP + TUDCA: n = 8 per group) and (c) post-weaning growth curves of ob/ob mice and ob/ob; Pomc-Cre; Atg7loxP/loxP mice treated neonatally with vehicle or TUDCA (ob/ob, ob/ob; Pomc-Cre; Atg7loxP/loxP + Vehicle: n = 7, ob/ob; Pomc-Cre; Atg7loxP/loxP + TUDCA: n = 6 per group). d Blood glucose concentration after intraperitoneal injection of glucose and area under the glucose tolerance test (GTT) curve (AUC) (ob/ob, ob/ob; Pomc-Cre; Atg7loxP/loxP + TUDCA: n = 6, ob/ob; Pomc-Cre; Atg7loxP/loxP + Vehicle: n = 10 per group) and e serum insulin levels of 8-week-old fed ob/ob mice and ob/ob; Pomc-Cre; Atg7loxP/loxP mice treated neonatally with vehicle or TUDCA (n = 7 per group). f Food intake of 10-week-old ob/ob mice and ob/ob; Pomc-Cre; Atg7loxP/loxP mice treated neonatally with vehicle or TUDCA (n = 3–5 per group). g Body composition of 4- (n = 3 per group) and 10-week-old ob/ob mice and ob/ob; Pomc-Cre; Atg7loxP/loxP mice treated neonatally with vehicle or TUDCA (n = 4–5 per group). Error bars represent the SEM. *P ≤ 0.05, and **P < 0.01 versus all groups (a), *P ≤ 0.05, **P < 0.01, ***P ≤ 0.001, and ****P ≤ 0.0001 versus vehicle-treated ob/ob; Pomc-Cre; Atg7loxP/loxP mice (bg), #P < 0.05, ##P ≤ 0.01, ###P ≤ 0.001, and ####P ≤ 0.0001 versus WT mice (d). Statistical significance between groups was determined using one-way ANOVA (a, AUC in d, eg) and two-way ANOVA (bd) followed by Tukey’s multiple comparison test. ARH, arcuate nucleus of the hypothalamus; me, median eminence; V3, third ventricle. Scale bar, 50 µm (a). Source data are provided as a Source Data file.

References

    1. Hales CM, Carroll MD, Fryar CD, Ogden CL. Prevalence of obesity among adults and youth: United States, 2015–2016. NCHS Data Brief. 2017;288:1–8. - PubMed
    1. Halaas JL, et al. Weight-reducing effects of the plasma protein encoded by the obese gene. Science. 1995;269:543–546. doi: 10.1126/science.7624777. - DOI - PubMed
    1. Friedman JM, Halaas JL. Leptin and the regulation of body weight in mammals. Nature. 1998;395:763–770. doi: 10.1038/27376. - DOI - PubMed
    1. Sohn J-W, Elmquist JK, Williams KW. Neuronal circuits that regulate feeding behavior and metabolism. Trends Neurosci. 2013;36:504–512. doi: 10.1016/j.tins.2013.05.003. - DOI - PMC - PubMed
    1. Mistry A, Swick A, Romsos D. Leptin alters metabolic rates before acquisition of its anorectic effect in developing neonatal mice. Am. J. Physiol. 1999;277:R742–R747. - PubMed

MeSH terms