. 2020 Apr 20;11(1):1875.
doi: 10.1038/s41467-020-15626-w.

α-Synuclein-specific T cell reactivity is associated with preclinical and early Parkinson's disease

Affiliations

α-Synuclein-specific T cell reactivity is associated with preclinical and early Parkinson's disease

Cecilia S Lindestam Arlehamn et al. Nat Commun. .

Abstract

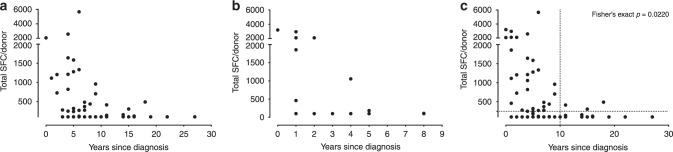
A diagnosis of motor Parkinson's disease (PD) is preceded by a prolonged premotor phase with accumulating neuronal damage. Here we examined the temporal relation between α-synuclein (α-syn) T cell reactivity and PD. A longitudinal case study revealed that elevated α-syn-specific T cell responses were detected prior to the diagnosis of motor PD, and declined after. The relationship between T cell reactivity and early PD in two independent cohorts showed that α-syn-specific T cell responses were highest shortly after diagnosis of motor PD and then decreased. Additional analysis revealed significant association of α-syn-specific T cell responses with age and lower levodopa equivalent dose. These results confirm the presence of α-syn-reactive T cells in PD and show that they are most abundant immediately after diagnosis of motor PD. These cells may be present years before the diagnosis of motor PD, suggesting avenues of investigation into PD pathogenesis and potential early diagnosis.


Conflict of interest statement

The authors declare no competing interests.

Figures

Fig. 1
Fig. 1. α-Syn-specific T cell responses in a longitudinal case study of PD.
a Total magnitude of response expressed as total SFC (sum of IFNγ, IL-5, and IL-10 responses) per 106 cultured PBMC against a pool of α-syn peptides (furthest to the right) and all individual α-syn peptides included in the pool. Representative data from PBMC collected in 2006. bd After eliminating non-lymphocytes and doublet cells by forward and side-scatter, and dead cells by Live/Dead stain, CD3+ T cells were gated based on their CD4 and CD8 expression (CD8+, CD8+CD4+, CD4+, CD8CD4), and other populations as indicated; CD3CD19 and CD19+ (Supplementary Fig. 5), percentage cytokine of live cells from each of these were plotted. b IFNγ (n = 6), c IL-4 (n  =  6), and d IL-10 (n = 3). Each point represents a sample collected between 1998 and 2015 (1998, 2005, 2006, 2007, 2013, and 2015); median ± interquartile range is indicated. e Total magnitude of response expressed as total SFC (sum of IFNγ, IL-5, and IL-10 responses) per 106 cultured PBMC against a pool of α-syn peptides or PHA. The time period spans 1998 (pre-2001) to 2018. Median ± interquartile range is indicative of individual experimental replicates. Pre- March-01 n = 10, Oct-05 n = 4, Jul-06 n = 3, Mar-07 n = 9, Apr-07 n = 3, May-07 n = 5, Oct-07 n = 1, Jan-13 n = 4, Aug-15 n = 12, and May-18 n = 2. f Total magnitude of response divided into pre- (1998–2006) (n = 17) and (2007–2008) (n = 18), which reflects the period this individual experienced shingles) and post- (2009–2018) (n = 18) PD onset/diagnosis for α-syn-specific responses (left) and PHA (right). Each point represents an individual independent experimental replicate; the median ± interquartile range is indicated. Two-tailed Mann–Whitney test. The data are displayed on a logarithmic scale.
Fig. 2
Fig. 2. Reactivity to α-syn in patients with PD or AD as compared with HC.
Magnitude of responses a IFNγ, b IL-5, c IL-10, and d sum of IFNγ, IL-5, and IL-10 against the α-syn peptide pool as SFC per 106 cultured PBMC. Each point represents one participant. Closed circles, patients with PD (n = 77); open circles, controls (n = 69). One-tailed Mann–Whitney test. As many participants showed no response, numerous points are at the limit of detection (100 SFC). Median ± interquartile range is displayed, but note that median values are at the limit of detection. The top interquartile range is visible in d. e Sum of IFNγ, IL-5, and IL-10 against the α-syn peptide pool as SFC per 106 cultured PBMC. Each point represents one participant. Gray circles, patients with AD (n = 38); open circles, controls (n = 41). Two-tailed Mann–Whitney test. As many participants showed no response, numerous points are at the limit of detection (100 SFC). Median ± interquartile range is plotted, but the median values are at the limit of detection. The top interquartile range is visible for HC.
Fig. 3
Fig. 3. Correlation between T cell reactivity and time since diagnosis.
a Cohort 1 (n = 76 PD patients from UCSD, RUMC, LJI, and UAB), b Cohort 2 (n = 20 PD patients from UAB), c Cohorts 1 and 2 combined (n = 96 PD patients). The Y-axis shows the magnitude of responses (sum of IFNγ, IL-5, and IL-10) against the α-syn peptide pool as SFC per 106 cultured PBMC. The X-axis shows the years since PD diagnosis. Each point represents one donor. Because many participants showed no response, there are overlapping points at the limit of detection (100 SFC). Two-tailed Fisher’s exact test.
Fig. 4
Fig. 4. Correlation between individual cytokine responses and time since diagnosis.
Cohorts 1 and 2 combined (n = 96 PD patients). The Y-axis shows the magnitude of responses a IFNγ, b IL-5, and c IL-10, against the α-syn peptide pool as SFC per 106 cultured PBMC. The X-axis shows the years since PD diagnosis. Each point represents one donor. Because many participants showed no response, there are overlapping points at the limit of detection (100 SFC). The number of patients in each quadrant is indicated in each graph. Two-tailed Fisher’s exact test.
Fig. 5
Fig. 5. IFNγ, IL-4, and IL-10 are produced by distinct T cells in response to α-syn.
ad After eliminating non-lymphocytes/monocytes and doublet cells by forward and side-scatter and dead cells by Live/Dead stain, cells were gated based on their cytokine expression and then cytokine-expressing cells were gated based on their CD3+ and CD56+ expression. CD3+ T cells were gated based on their CD4 and CD8 expression (CD8+, CD8+CD4+, CD4+, CD8CD4), and other populations based on CD3CD56 and other markers as indicated; CD14CD19+ (B cells), CD14+CD19 (Monocytes), CD14CD19 (other) (Supplementary Fig. 5), and percentage live cells expressing cytokine from each of these were plotted. Samples with a frequency of cytokines below 0.02% of live lymphocytes after removal of background were excluded from this analysis. a IFNγ (n = 13), b IL-4 (n = 9), and c IL-10 (n = 6). Median ± interquartile range is indicated. d Boolean gating for combinations of cytokines shown as percentage of live cells, n = 20. Median ± interquartile range is indicated. The gating strategy is shown in Supplementary Fig. 5. e Plots were gated on IL-10+CD4+ T cells following negative control (DMSO) or α-syn stimulation. The gating strategy leading up to this step is shown in Supplementary Fig. 5. IL-10+ cells were then gated further on CD25 and CD127 expression (top row). Plots were gated on CD25+CD127loCD4+ T cells and then on IL-10 production (bottom row).
Fig. 6
Fig. 6. Correlation between α-syn-specific T cell reactivity and clinical variables.
a Age (n = 97): dotted lines indicate 250 SFC and 70-year-old cut-off for two-tailed Fisher’s exact test. b Frequency and magnitude of T cell responses in males (n = 71) and females (n = 26) with PD. The dotted line indicates 250 SFC for Fisher’s exact test. c MoCA score (n = 85), d UPDRS score (n = 85), and e LED score (n = 86); dotted lines indicate 250 SFC and 1000 LED cut-off for two-tailed Fisher’s exact test. f Correlation between LED score and time since diagnosis (n = 86); dotted lines indicate 10 years since diagnosis and 1000 LED cut-off for two-tailed Fisher’s exact test. Correlation is indicated by Spearman r and associated p value. g Segregation of subjects with PD in low (<1000) and high (≥1000) LED score with diagnosis <10 and ≥10 years ago. Number of data points per condition is indicated in the figure (Total No.). Two-tailed Fisher’s exact test comparing individuals with <1000 LED, <10 years ago since diagnosis and >250 SFC (left in graph) vs. the three other groups. h Segregation of subjects with PD based on LED score (cut-off 1000), years since diagnosis (cut-off 10) and age (cut-off 70). Two-tailed Fisher’s exact test comparing individuals with <1000 LED, <10 years ago since diagnosis, >70 years old, and >250 SFC (left in graph) vs. the seven other groups. Total number of PD responding to α-syn peptide pool (n = 28). Total SFC is defined as the magnitude of responses (sum of IFNγ, IL-5, and IL-10) against the α-syn peptide pool as SFC per 106 cultured PBMC. b, g, h Median ± interquartile range is indicated.

Comment in

References

    1. Postuma RB, Berg D. Advances in markers of prodromal Parkinson disease. Nat. Rev. Neurol. 2016;12:622–634. doi: 10.1038/nrneurol.2016.152. - DOI - PubMed
    1. Fahn S, Sulzer D. Neurodegeneration and neuroprotection in Parkinson disease. NeuroRx. 2004;1:139–154. doi: 10.1602/neurorx.1.1.139. - DOI - PMC - PubMed
    1. Kordower JH, et al. Disease duration and the integrity of the nigrostriatal system in Parkinson’s disease. Brain. 2013;136:2419–2431. doi: 10.1093/brain/awt192. - DOI - PMC - PubMed
    1. Pilotto A, et al. Application of the movement disorder society prodromal Parkinson’s disease research criteria in 2 independent prospective cohorts. Mov. Disord. 2017;32:1025–1034. doi: 10.1002/mds.27035. - DOI - PubMed
    1. Sulzer D, Surmeier DJ. Neuronal vulnerability, pathogenesis, and Parkinson’s disease. Mov. Disord. 2013;28:41–50. doi: 10.1002/mds.25095. - DOI - PMC - PubMed

Publication types