. 2020 Jun;4(6):820-830.
doi: 10.1038/s41559-020-1156-z. Epub 2020 Apr 20.

Deeply conserved synteny resolves early events in vertebrate evolution

Affiliations

Deeply conserved synteny resolves early events in vertebrate evolution

Oleg Simakov et al. Nat Ecol Evol. 2020 Jun.

Abstract

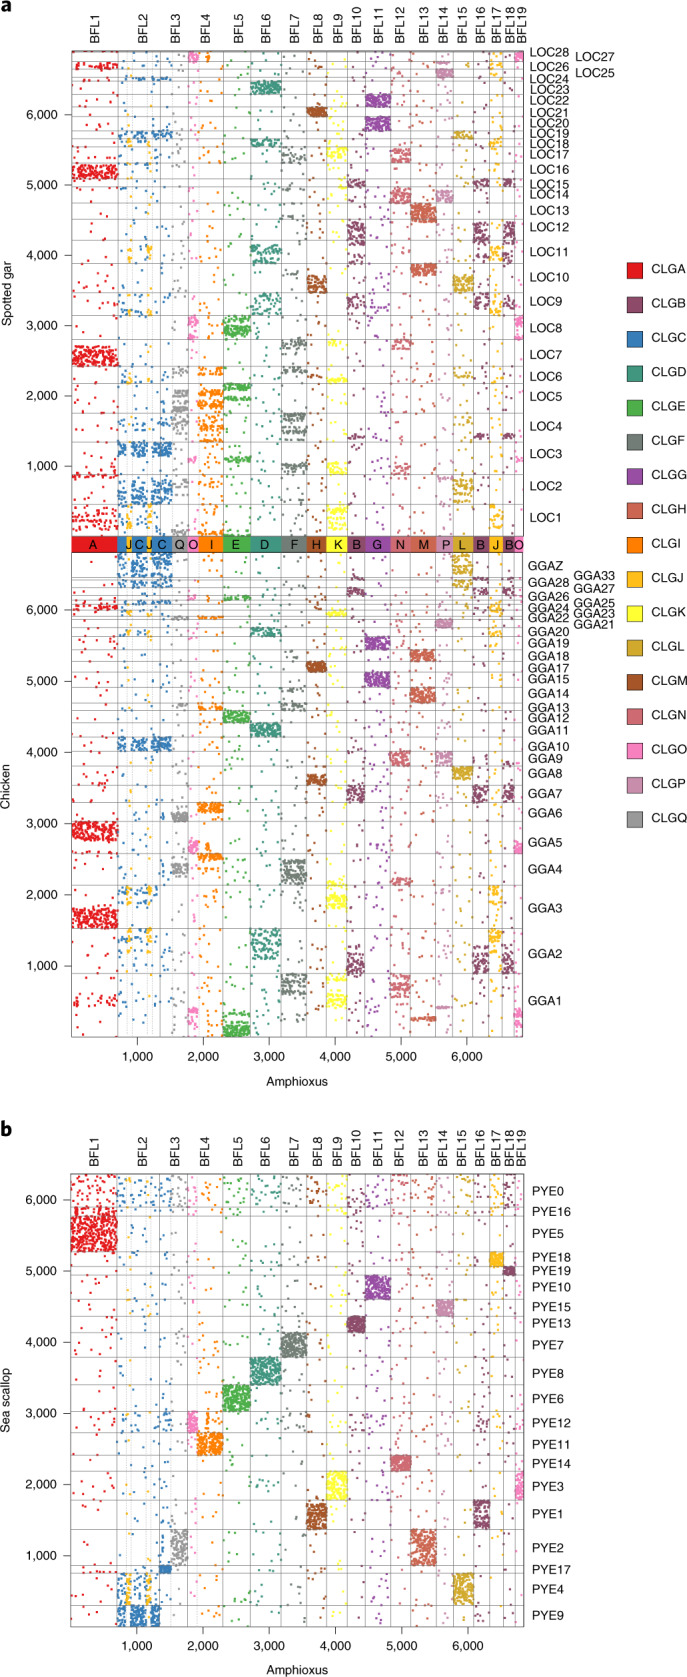
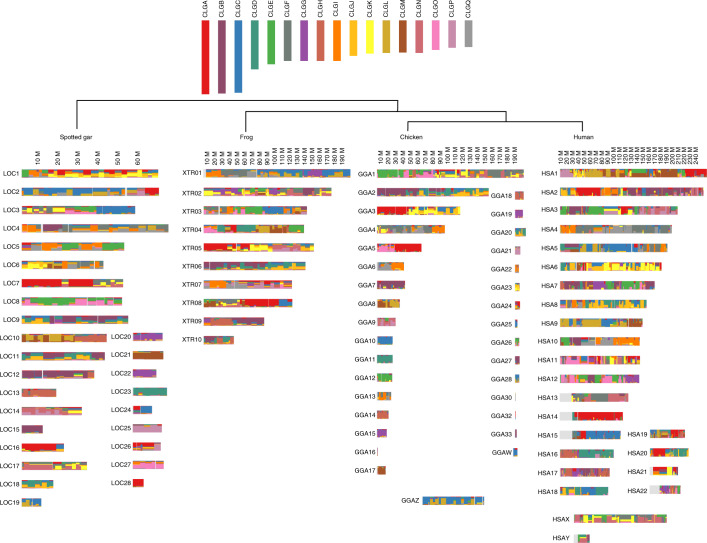
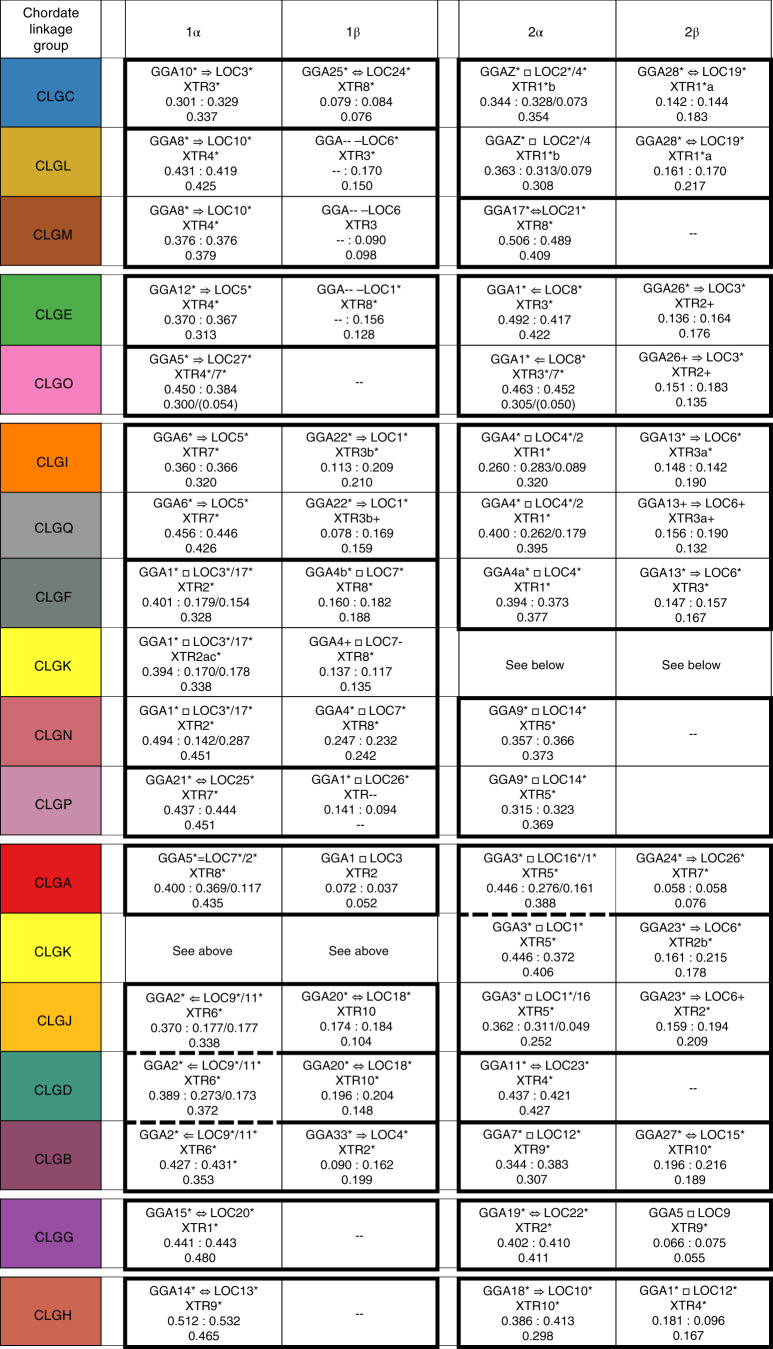
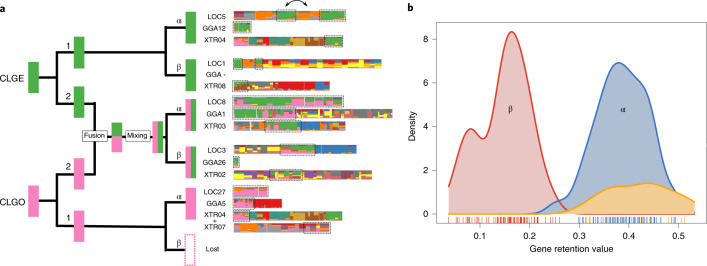
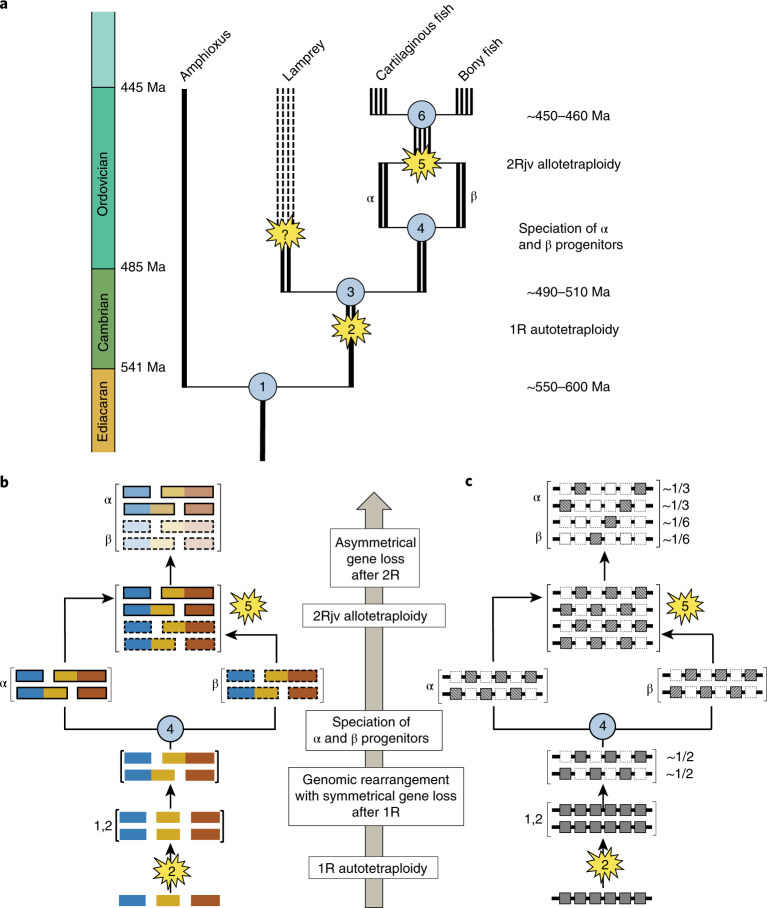
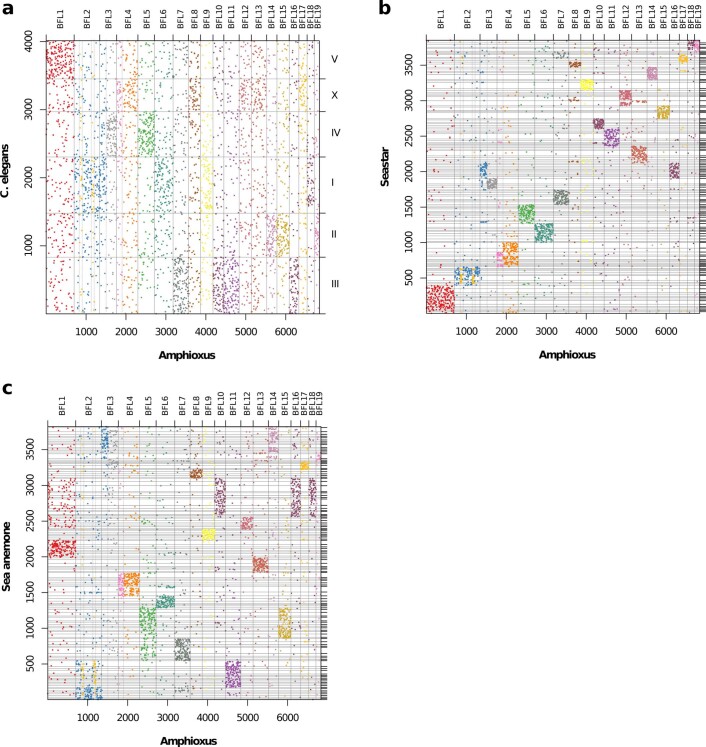
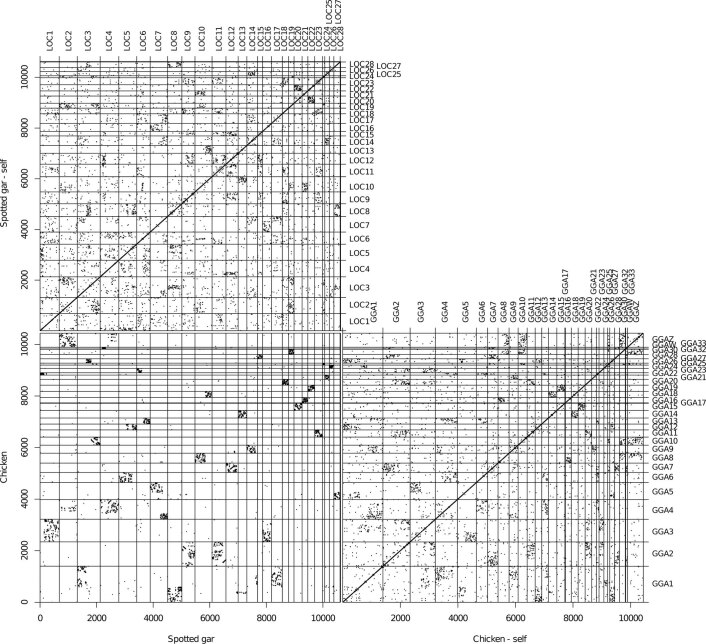
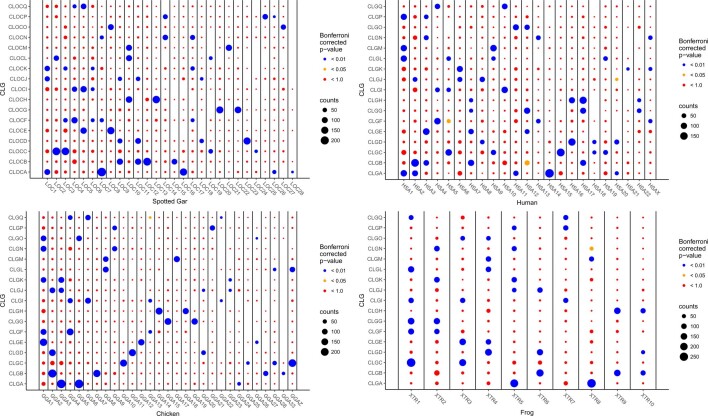
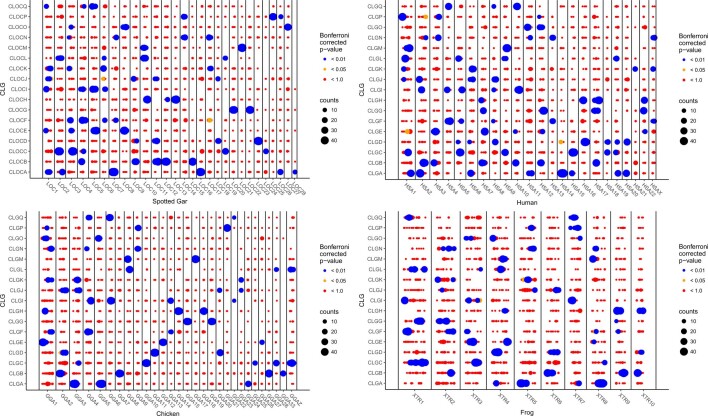
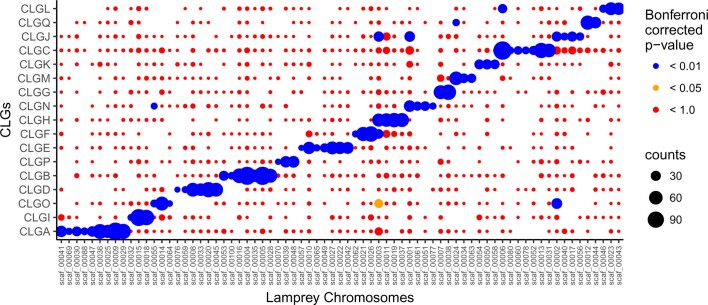
Although it is widely believed that early vertebrate evolution was shaped by ancient whole-genome duplications, the number, timing and mechanism of these events remain elusive. Here, we infer the history of vertebrates through genomic comparisons with a new chromosome-scale sequence of the invertebrate chordate amphioxus. We show how the karyotypes of amphioxus and diverse vertebrates are derived from 17 ancestral chordate linkage groups (and 19 ancestral bilaterian groups) by fusion, rearrangement and duplication. We resolve two distinct ancient duplications based on patterns of chromosomal conserved synteny. All extant vertebrates share the first duplication, which occurred in the mid/late Cambrian by autotetraploidization (that is, direct genome doubling). In contrast, the second duplication is found only in jawed vertebrates and occurred in the mid-late Ordovician by allotetraploidization (that is, genome duplication following interspecific hybridization) from two now-extinct progenitors. This complex genomic history parallels the diversification of vertebrate lineages in the fossil record.


Conflict of interest statement

D.S.R. is a member of the Scientific Advisory Board of Dovetail Genomics. R.E.G. is the founder of Dovetail Genomics. N.H.P. is an employee of Dovetail Genomics. D.S.R., R.E.G. and N.H.P. are all shareholders in Dovetail Genomics. The other authors declare no competing interests.

Figures

Fig. 1
Fig. 1. Conserved syntenies between amphioxus and various species.
a, Oxford dot plot of orthologous genes between amphioxus and two representative bony vertebrates: spotted gar (Lepisosteus oculatus; top) and chicken (Gallus gallus; bottom). The axes show the index of 6,843 orthologous gene families anchored by mutual best hits from gar, chick, frog and human to amphioxus, with chromosome boundaries indicated. Dashed vertical lines show the location of synteny breakpoints for amphioxus that are consistent in comparisons with other vertebrate (Extended Data Figs. 2 and 3) and invertebrate genomes (see b; Extended Data Fig. 4). Genes are coloured according to this partitioning, defining 17 ancestral CLGs, with labels shown to the right. b, Mutual best-hit dot plot of amphioxus versus scallop, using the same colouring as in a. Syntenic discontinuities in amphioxus (indicated by the dashed lines) are consistent in the scallop. Note that CLGB (dark purple) is distributed across three pairs of homologous chromosomes, implying that this CLG existed as three distinct linkage groups in the scallop–amphioxus common ancestor.
Fig. 2
Fig. 2. Contributions of the 17 ancestral CLGs to contemporary vertebrate genomes.
The CLG ancestries of four jawed vertebrate genomes are shown by the local fraction of genes that are derived from each CLG, in windows of approximately 20 genes (see Methods). Note that, in contrast with Fig. 1, the chromosomal position is shown as physical coordinates (that is, base pairs), so area is not proportional to gene number. Colours are the same as in Fig. 1. The statistical significance of the associations between CLGs and vertebrate chromosomes is reported in Fig. 3.
Fig. 3
Fig. 3. Organization of bony vertebrate chromosomes after 2R.
The majority of CLGs have four copies in bony vertebrates; the remainder have three. Organizing these copies by chromosome fusion (solid rectangles joining cells) and gene retention (numbers in cells) shows that chicken, spotted gar and frog chromosomes can be sorted into ‘α–β’ pairs that share the same patterns of CLG fusion, and these pairs themselves form ‘1–2’ pairs. Bold dashed lines separating CLGA-2α and CLGB-1α from their fusions with other CLGs indicate either fusions in the α-lineage or fissions in β. Due to this ambiguity, the β pairings in these two rows are arbitrary. Similarly, the β copies for CLGG and CLGH are arbitrarily assigned to 2. In several cases (for example, CLGO) two distinct copies are found on the same chromosome of one species; these are indicated as a and b. Arrows imply that the entire source chromosome is orthologous to the target; double-headed arrows indicate reciprocal orthology; boxes indicate that segments of the chromosomes are orthologous; -- indicates undetected enrichment. The significance of associations between CLG and jawed vertebrate chromosomes was determined as described in Methods. Significance determined using 50-gene windows (P < 0.01) is indicated by an asterisk. Significance determined using 50-gene windows (P < 0.05), 100-gene windows (P < 0.01) and/or at the whole-chromosome level (P < 0.05) is determined by a plus sign. All P values were Bonferroni corrected.
Fig. 4
Fig. 4. Duplications, fusions and mixing in bony vertebrates.
a, Right: chromosomal descendants of CLGE (green) and CLGO (pink) are organized into five groups. Each chromosome is represented as in Fig. 2, with corresponding segments outlined by black dotted rectangles. The double-headed arrow indicates probable inversion that separated two CLG blocks. Within each group, segments with the CLGE and/or CLGO ancestry are orthologous among the chicken, gar and frog, and groups are paralogous to each other. Note that the frog chromosome XTR4 has distinct CLGE and CLGO segments with distinct ancestry (see Supplementary Note 6). Left: cladogram showing the most parsimonious evolutionary history leading to these vertebrate chromosomes, starting from CLGE and CLGO ancestors. This includes an early duplication (producing copies labelled 1 and 2), a fusion and subsequent mixing, and then a second duplication (producing copies labelled α and β). The CLGO-1β copy was not found, as indicated by a dashed pink rectangle. CLGE-1β was not found in chicken, as indicated by the dash. CLGO-1α was found split across XTR04 and XTR07, as indicated by the plus sign. b, Distribution of gene retention for the α and β segments listed in Fig. 3, with rug plot and kernel density estimator. The upper curves are for α–β pairs, whereas the orange curve is for α segments without β counterparts (presumed lost or possessing limited gene content and therefore undetected).
Fig. 5
Fig. 5. Auto- then allotetraploidy scenario for vertebrate evolution.
Schematic of the auto- then allotetraploidy scenario described in the main text. a, Each line represents a chromosomal lineage. Single lines represent diploids, paired lines represent tetraploids, and so on, relative to the ancestral chordate chromosome complement. Dashed lines later in the lamprey lineage reflect one or more additional genomic duplications. Labelled nodes: (1) divergence of amphioxus and vertebrates (last common chordate ancestor); (2) 1R autotetraploidy, resulting in genome doubling; (3) divergence of (tetraploid) lamprey and gnathostome progenitor lineages; (4) speciation of palaeotetraploid gnathostome progenitors; (5) 2Rjv allotetraploidy, in which palaeotetraploid gnathostome progenitors hybridize to form the crown gnathostome lineage, which is quadrupled relative to the chordate ancestor; (6) divergence of extant jawed vertebrate lineages. The question mark indicates one or more additional duplication(s) that may have occurred in the lamprey lineage. b, Schematic showing the evolution of three ancestral CLGs. Relevant nodes are labelled as in a. Bold and dashed boundaries around chromosomes in the α and β lineages, respectively, represent divergences that accumulate in each lineage. Differential shading after node 5 indicates subsequent gene loss. c, Schematic of the evolutionary history of six linked chordate genes through vertebrate duplications. Gene loss is symmetrical after autotetraploidy (node 2) but asymmetrical after allotetraploidy (node 5). For simplicity in this diagram, gene order changes are not shown. Cross-hatching indicates independent differentiation in α and β lineages. Empty dashed boxes follow the fate of lost genes.
Extended Data Fig. 1
Extended Data Fig. 1. Chromatin and genetic maps of amphioxus genome.
(a): Chromatin conformation capture contact map for amphioxus genome assembly. Density of read-pairs representing three-dimensional chromatin contacts are shown as a heat map. (b): Maternal meiotic linkage map of amphioxus from a 96 progeny F1 cross. Markers represent phased 500 kb windows of the chromosomal assembly; consecutive windows are combined when there is no evidence for recombination in the genotyped progeny. Amphioxus linkage groups and the 19 longest assembled scaffolds are in 1:1 correspondence, confirming the Hi-C-based chromosome-scale assembly. (See Supplementary Note 4.).
Extended Data Fig. 2
Extended Data Fig. 2. Dot-plots showing conserved syntenies between amphioxus and human and frog.
Dots represent mutual best hits between amphioxus and frog (Xenopus tropicalis, XTR) and human (Homo sapiens, HSA). Only mutual-best-hits involving the 6,843 genes of Fig. 1 are considered. (These gene families are anchored by mutual best hits between the four jawed vertebrate representatives and amphioxus.) Genes are colored based on their CLG membership as in main Fig. 1. Horizontal and vertical solid lines represent chromosome boundaries; vertical dashed lines represent inferred synteny breakpoints in amphioxus as in Fig. 1 (Methods).
Extended Data Fig. 3
Extended Data Fig. 3. Dot-plots showing conserved syntenies between lamprey and amphioxus.
Dots represent mutual best hits between the (germline) genome of the sea lamprey (Petromyzon marinus) and amphioxus. Genes are colored based on their CLG assignment, and lamprey chromosomes are sorted according to their CLG content. Panel a shows these distribution of orthologous genes vs. amphioxus chromosomes, revealing the same discontinuities (vertical dashed lines) in amphioxus-lamprey synteny as found for amphioxus-bony vertebrate comparisons shown in Fig. 1 and Extended Data Fig. 2. Panel b shows these same orthologous gene pairs versus CLGs.
Extended Data Fig. 4
Extended Data Fig. 4. Dot-plots showing conserved syntenies between amphioxus and selected invertebrates.
Dots represent mutual best hits between amphioxus and the genomes of the Crown Of Thorns sea star Acanthaster planci, the soil nematode Caenorhabditis elegans, and the starlet sea anemone Nematostella vectensis. The N. vectensis and A. planci genomes are not yet assembled into chromosomes, and only scaffolds containing 20 or more genes (counting only mutual-best-hit vs. amphioxus) are shown. Scaffolds are sorted based on clustering using similarity of their CLG content. Vertical dashed lines are as shown in and Fig. 1, with the same CLG-based coloring, showing that the partitioning of amphioxus found using jawed vertebrates is also consistent with diverse invertebrates, and that sea star and sea anemone scaffolds can be grouped according to conserved synteny with amphioxus. C. elegans chromosomes arose by fusion, translocation, and mixing of the ancestral bilaterian units that are still retained in amphioxus.
Extended Data Fig. 5
Extended Data Fig. 5. Chicken-spotted gar orthologs and paralogs.
“Oxford’ dotpot between chicken (Gallus gallus, GGA) and spotted gar (Lepisosteus oculatus, LOC). Dots in the lower left corner represent mutual best hits between chicken and spotted gar, showing the clear orthologous blocks conserved synteny that allows chicken and spotted gar chromosome segments to be placed in correspondence with each other. Upper left and lower right show intra-genomic non-self best hits that identify paralogous regions within the chicken and spotted gar genome, respectively. Paralogous chromosomal regions share the same chordate linkage group ancestry, but arose through duplication.
Extended Data Fig. 6
Extended Data Fig. 6. Oxford grid between bony vertebrate chromosomes and chordate linkage groups (CLGs).
Circles represent the number of orthologous genes between human (Homo sapiens, HSA), chicken (Gallus gallus, GGA), frog (Xenopus tropicalis, XTR), and spotted gar (Lepisosteus oculatus, LOC) and the seventeen chordate linkage groups (CLGs) described in the text. Orthology is operationally defined by mutual best hits, restricted to 6,843 gene families anchored by mutual best hits of the four jawed vertebrates to amphioxus. The area of each circle is proportional to the number of orthologous genes for each chromosome-CLG pair, and the color indicates the significance of the association relative to a null model in which the position of the orthologous genes are randomly shuffled (Methods).
Extended Data Fig. 7
Extended Data Fig. 7. Oxford grid showing associations between 50 gene segments of bony vertebrate chromosomes and chordate linkage groups (CLGs).
Given the evident localization of orthologs along bony vertebrate chromosomes shown in the ‘Oxford’ dotplots of Fig. 1 and Extended Data Figs. 2 and 3, we assessed the significance of associations between sub-chromosomal regions and the chordate linkage groups. Each vertebrate chromosome was divided into overlapping 50 gene windows (offset by 25 genes). Only 6,843 genes with amphioxus-bony vertebrate mutual best hits are used. Circle areas are proportional to the number of orthologous genes for each chromosome-CLG pair, and the color indicates the significance of the association relative to a null model in which the position of the orthologous genes are randomly shuffled. Comparing Extended Data Figs. 6 and 7 shows additional significant associations that are missed based on whole chromosome analyses.
Extended Data Fig. 8
Extended Data Fig. 8. Oxford grid between sea lamprey germline chromosomes and chordate linkage groups (CLGs).
Circles show the number of orthologous genes between germline chromosomes of sea lamprey (Petromyzon marinus, PMA, denoted scaff_XXXXX following Smith et al.) and the seventeen CLGs described in the main text. As in Extended Data Fig. 6 the area of each circle is proportional to the number of orthologous genes for each chromosome-CLG pair, and the color indicates the significance of the association relative to a null model in which the position of the orthologous genes are randomly shuffled. Sea lamprey chromosomes and CLGs are both sorted to exhibit the striking correspondence between them. Each of the 17 CLGs is represented by at least one lamprey chromosome, and typically 6-8 lamprey chromosomes are associated with teach CLG. Compare Fig. 4b of Smith and Keinath 2015, which compares lamprey chromosomes to ‘putative ancestral linkage groups’ derived by Putnam 2008 through clustering of amphioxus scaffolds These putative ancestral linkage groups are in 1:1 correspondence with the CLGs shown here to be represented as large chromosomal segments of amphioxus.

References

    1. Ohno, S. Evolution by Gene Duplication (Springer, 1970).
    1. Garcia-Fernández J, Holland PW. Archetypal organization of the amphioxus Hox gene cluster. Nature. 1994;370:563–566. - PubMed
    1. Spring J. Vertebrate evolution by interspecific hybridisation—are we polyploid? FEBS Lett. 1997;400:2–8. - PubMed
    1. Escriva H, Holland ND, Gronemeyer H, Laudet V, Holland LZ. The retinoic acid signaling pathway regulates anterior/posterior patterning in the nerve cord and pharynx of amphioxus, a chordate lacking neural crest. Development. 2002;129:2905–2916. - PubMed
    1. Pebusque M-J, Coulier F, Birnbaum D, Pontarotti P. Ancient large-scale genome duplications: phylogenetic and linkage analyses shed light on chordate genome evolution. Mol. Biol. Evol. 1998;15:1145–1159. - PubMed

Publication types