. 2020 May;15(5):398-405.
doi: 10.1038/s41565-020-0642-4. Epub 2020 Apr 20.

Probing myeloid cell dynamics in ischaemic heart disease by nanotracer hot-spot imaging

Affiliations

Probing myeloid cell dynamics in ischaemic heart disease by nanotracer hot-spot imaging

Max L Senders et al. Nat Nanotechnol. 2020 May.

Abstract

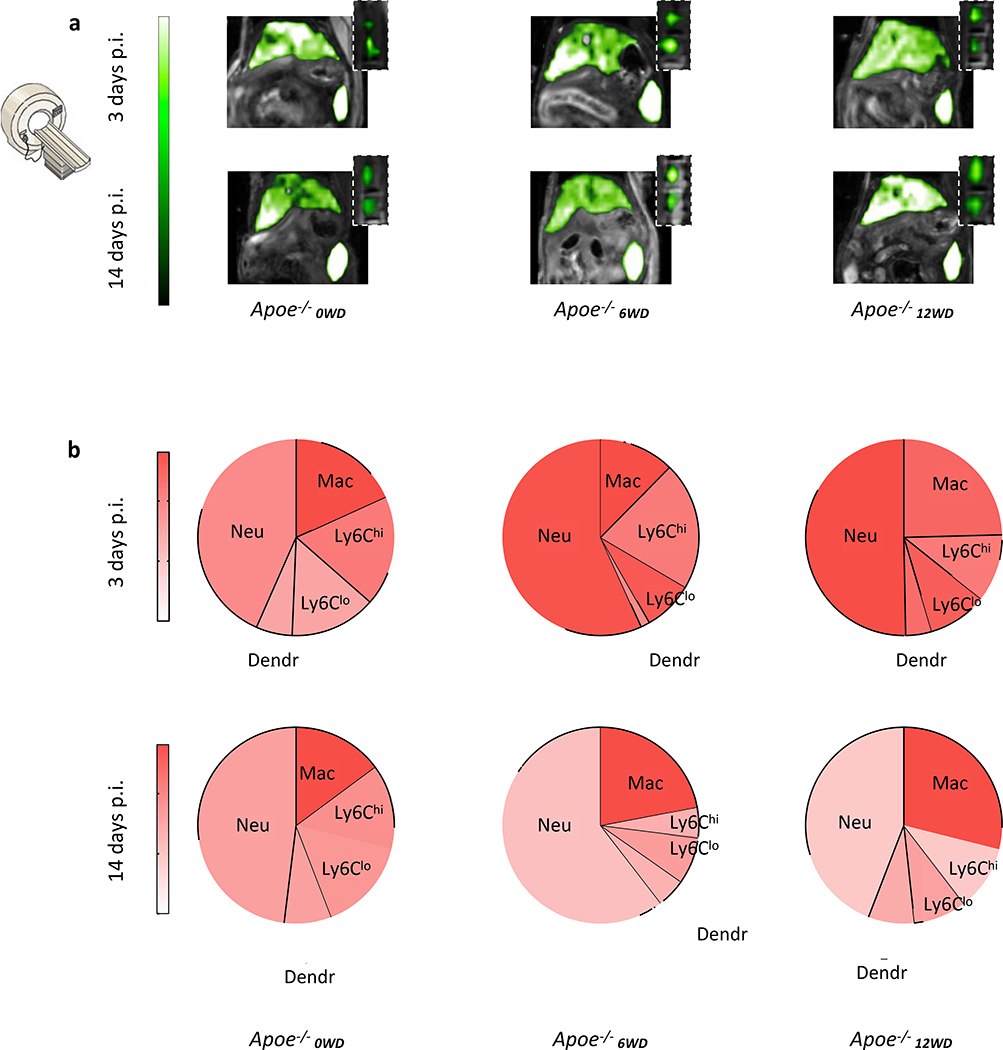
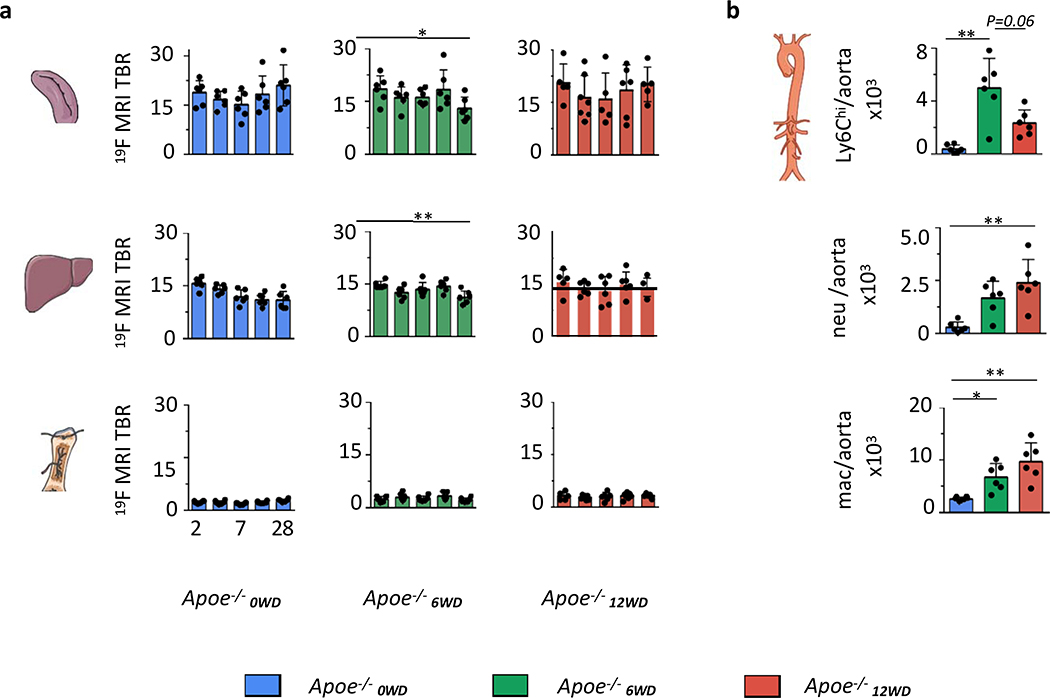
Ischaemic heart disease evokes a complex immune response. However, tools to track the systemic behaviour and dynamics of leukocytes non-invasively in vivo are lacking. Here, we present a multimodal hot-spot imaging approach using an innovative high-density lipoprotein-derived nanotracer with a perfluoro-crown ether payload (19F-HDL) to allow myeloid cell tracking by 19F magnetic resonance imaging. The 19F-HDL nanotracer can additionally be labelled with zirconium-89 and fluorophores to detect myeloid cells by in vivo positron emission tomography imaging and optical modalities, respectively. Using our nanotracer in atherosclerotic mice with myocardial infarction, we observed rapid myeloid cell egress from the spleen and bone marrow by in vivo 19F-HDL magnetic resonance imaging. Concurrently, using ex vivo techniques, we showed that circulating pro-inflammatory myeloid cells accumulated in atherosclerotic plaques and at the myocardial infarct site. Our multimodality imaging approach is a valuable addition to the immunology toolbox, enabling the study of complex myeloid cell behaviour dynamically.


Conflict of interest statement

Competing interests

The authors declare no competing interests.

Figures

Fig. 1.
Fig. 1.. Nanotracer platform with multimodal evaluation in ischemic heart disease.
a. The nanotracer platform consists of a perfluoro-crown ether (PFCE) core surrounded by a phospholipid layer stabilized by apoAI. Additional labeling with Zirconium-89 and BODIPY allows positron emission tomography (PET) imaging and optical assays, respectively. We developed three 19F-HDL nanotracer formulations of varying size: “small (~40 nm)”, “intermediate (~105 nm)” and “large (~180 nm)”; the lines represent their respective dynamic light scattering (DLS)-determined size distribution. b. Myeloid cell dynamics in the context of ischemic heart disease. A mouse is injected with the nanotracer, which accumulates in the spleen and bone marrow as it is taken up by neutrophils (neu), monocytes (mono) and macrophages (mac). Egress from the spleen and bone marrow leads to subsequent nanotracer accumulation at the infarcted myocardium and atherosclerotic plaque.
Fig. 2.
Fig. 2.. Developing and characterizing multimodal nanotracers.
a. i) Schematic overview of 19F-HDL’s different sizes: small (~40 nm, left), intermediate (~105 nm, middle) and large (~180 nm, right) particles. ii) transmission electron microscopy (TEM) images showing different nanotracers’ sizes and shapes (bar represents 200 nm). iii) representative fused 1H and 19F-magnetic resonance imaging (MRI) images 48 hours post injection (p.i.) of the nanotracers. MRI was repeated for n = 4 (small, intermediate) and n = 6 (large) biologically independent samples. b. Quantification of all three formulations in spleen (left), bone marrow (middle) and liver (right) expressed as target-to-background (TBR) in which muscle serves as “background” signal. n = 4 mice (small, intermediate); n = 6 mice (large). *P=0.001 in spleen, **P=0.0023 for bone marrow. c. Mean fluorescence intensity (MFI) for different cells in spleen (left) and bone marrow (right). n = 8 mice (spleen); n = 6 mice (bone marrow). *P < 0.0001. d. Biodistribution 48 hours after 89Zr-19F-HDL injection in healthy mice with three different labeling strategies, DFO conjugated with apoAI (top), DFO conjugated with liposomes (middle) or C34-DFO incorporated in the liposome layer (bottom). (n = 5 mice per labelling strategy). *P=0.0042 for DFO conjugated with apoAI, *P=0.0005 for DFO conjugated with liposomes, *P=0.0018 for C34-DFO e. Representative fused positron emission tomography/computed tomography (PET/CT) images at 5 minutes, 1 hour and 48 hours after 89Zr-19F-HDL injection (DFO conjugated with apoAI), including a magnified femur showing bone marrow (bm). Dynamic PET/CT was repeated for n = 4 biologically independent samples. f. Pharmacokinetic curve of 89Zr-19F-HDL in healthy mice. Data are shown as mean±s.e.m. (n = 3 independent samples for three first time points, n = 5 independent samples for the latter time points). g. Representative fused 1H/19F MRI images longitudinally evaluate 19F-HDL 3, 7 and 14 days p.i. with magnified parts of the spine. The experiments were repeated twice independently with similar results; n = 6 biologically independent samples for each repetition. h. Quantified 19F-HDL signal on different days after injection using longitudinal 19F MRI in the bone marrow (left) and spleen (right) respectively. n = 5 mice, one mouse excluded based on Grubb’s test for outliers. A one-way Kruskal-Wallis with Dunn’s test for multiple comparisons was used unless otherwise stated. Data are shown as mean±sd in b, c, d, h. Abbreviations: neu=neutrophils, Ly6Chi=Ly6Chigh monocytes, Ly6Clo=Ly6Clow monocytes, mac=macrophages, DC=dendritic cells, lym=lymphocytes, liver (li), spleen (sp), kidneys (ki), bone marrow (spine or bm), percentage injected dose per gram of tissue (%ID/g).
Fig. 3.
Fig. 3.. Characterization in atherosclerosis.
a. Representative images of 1H/19F magnetic resonance imaging of upper abdominal area at 3 and 14 days post 19F-HDL injection with magnifications of the spine containing bone marrow. Similar results were obtained in six (Apoe−/−0WD, Apoe−/−6WD) and five (Apoe−/−12WD) independent experiments. b. Mean fluorescence intensity (MFI) for different myeloid cell subsets in spleen at 3, and 14 days post BODIPY-19F-HDL injection. The size of each wedge represents the relative contribution of each cell type to the total number of myeloid cells in the spleen. n = 5 for all groups Apoe−/−0WD and for Apoe−/−12WD 3 days; n = 6 for all groups Apoe−/−6WD and for Apoe−/−12WD 14 days. Atherosclerotic Apoe−/− mice had been fed Western diet for 0 (Apoe−/−0WD), 6 (Apoe−/−6WD) or 12 (Apoe−/−12WD) weeks at the time of injection.
Fig 4.
Fig 4.. Longitudinal evaluation of myeloid cell dynamics during atherosclerosis development.
a. Quantification of 19F MRI signal expressed as target-to-background ratio (TBR) at 2, 3, 7, 14 and 28 days for spleen, liver and bone marrow. n = 6 mice for Apoe−/−0WD; n = 6 mice for Apoe−/−6WD; for Apoe−/−12WD n = 5 mice at 2 d, 28 d, n = 7 at 3d, n = 6 at 14 d and n = 5 for spleen (one sample is excluded based on Grubb’s test for outlier) and n = 6 for bone marrow and liver at 7 d. One sample is excluded completely in Apoe−/−12WD at 7 days due to non-usable MRI data. A two-tailed Mann-Whitney U test was used for spleen and liver in Apoe−/−6WD between 2 and 28 days, *P=0.0152 and *P=0.0022, respectively. b. Flow cytometry quantification of cells in the aorta. n = 6. All data are shown as mean±sd. A one-tailed Kruskal-Wallis test with Dunn’s test for multiple comparisons was used unless otherwise stated. *P=0.0015 for Ly6Chi, *P=0.0039 for neutrophils and *P=0.0023 for macrophages in the aorta. Abbreviations: Ly6Chi=Ly6Chigh monocytes, neu=neutrophils, mac=macrophages. Atherosclerotic mice had been fed Western diet for 0 (blue), 6 (green) or 12 (red) weeks at the time of injection.
Fig. 5.
Fig. 5.. Multimodal imaging myeloid cell egress from hematopoietic organs and recruitment to inflammatory sites in myocardial infarction.
a. Schematic overview of performed experiments. b. Representative 1H/19F magnetic resonance images of Apoe−/− mice without (left) and with permanent (MI+, center) or transient (I/R, right) myocardial infarction and c. quantification of 19F-HDL in bone marrow, spleen and liver 3 days post 19F-HDL injection (p.i.). expressed as target-to-background (TBR) in which muscle serves as “background” signal. n = 6 for MI, I/R and control groups except for MI+ spleen where n = 5, one sample is excluded based on Grubb’s test for outliers. Two-sided Mann-Whitney U- test was used for bone marrow (*P=0.0022), spleen (*P=0.0043) and liver (*P=0.0022) d. Representative 1H/19F MR images of Apoe−/− mice without (left) and with permanent (center) or transient (right) myocardial infarction and e. quantification of 19F -HDL in bone marrow, spleen and liver 14 days p.i. n = 6 for all groups. Two-sided Mann-Whitney U- test was used for bone marrow (*P=0.0043), spleen (*P=0.0022), and liver (*P=0.0022). f. Representative autoradiography of sliced heart sections and whole aortas from Apoe−/− mice without (left) or 1 day after permanent (center) or transient (right) myocardial infarction 3 days after 89Zr-19F-HDL injection. n = 7 (MI-); n = 8 (MI+); n = 4 (I/R). g. Gamma counting quantification of whole hearts and aortas from Apoe−/− mice without (green) or 1 day after permanent (red) or transient (yellow) myocardial infarction and 3 days p.i. 89Zr-19F-HDL. n = 9 for MI-, n = 11 for MI+ and n = 4 for I/R groups. Two-sided Mann-Whitney U-test was used. *P=0.0276 MI+ heart %ID/g compared to MI-, P=0.3418 for MI+ aorta %ID/g compared to MI-. In b,d experiments were repeated in n = 6 mice per group with similar results. All data are shown as mean±sd. Abbreviations: I/R = ischemia/reperfusion, bm or spine indicates bone marrow, percentage injected dose per gram of tissue (%ID/g). Apoe−/− without MI are indicated in green, with MI are indicated in red (permanent ligation) and yellow (transient ligation).

References

    1. Moore KJ & Tabas I Macrophages in the pathogenesis of atherosclerosis. Cell 145, 341–355 (2011). - PMC - PubMed
    1. Yona S et al. Fate mapping reveals origins and dynamics of monocytes and tissue macrophages under homeostasis. Immunity 38, 79–91 (2013). - PMC - PubMed
    1. Geissmann F et al. Development of Monocytes, Macrophages, and Dendritic Cells. Science (80-. ). 327, 656–661 (2010). - PMC - PubMed
    1. Swirski FK & Nahrendorf M Leukocyte behavior in atherosclerosis, myocardial infarction, and heart failure. Science 339, 161–6 (2013). - PMC - PubMed
    1. Dutta P et al. Myocardial infarction accelerates atherosclerosis. Nature 487, 325–329 (2012). - PMC - PubMed

References for Method section

    1. Nakashima Y, Plump AS, Raines EW, Breslow JL & Ross R ApoE-deficient mice develop lesions of all phases of atherosclerosis throughout the arterial tree. Arterioscler. Thromb 14, 133–40 (1994). - PubMed
    1. Plump AS et al. Severe hypercholesterolemia and atherosclerosis in apolipoprotein E-deficient mice created by homologous recombination in ES cells. Cell 71, 343–53 (1992). - PubMed
    1. Tarnavski O et al. Mouse Cardiac Surgery: Comprehensive Techniques for the Generation of Mouse Models of Human Diseases and Their Application for Genomic Studies. Physiol. Genomics 349–360 (2003). doi:10.1152/physiolgenomics.00041.2003 - DOI - PubMed

Publication types

MeSH terms