. 2020 Jul;4(7):725-735.
doi: 10.1038/s41562-020-0854-5. Epub 2020 Apr 20.

Investigating the effect of changing parameters when building prediction models for post-stroke aphasia

Affiliations

Investigating the effect of changing parameters when building prediction models for post-stroke aphasia

Ajay D Halai et al. Nat Hum Behav. 2020 Jul.

Abstract

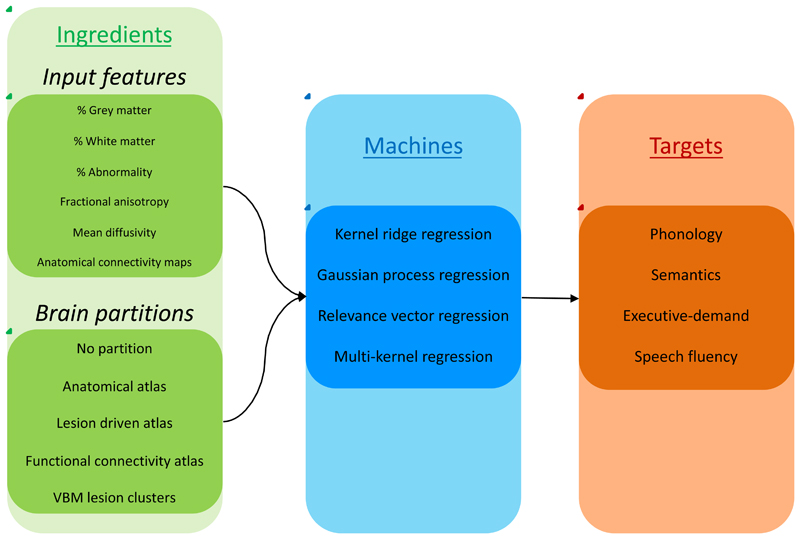
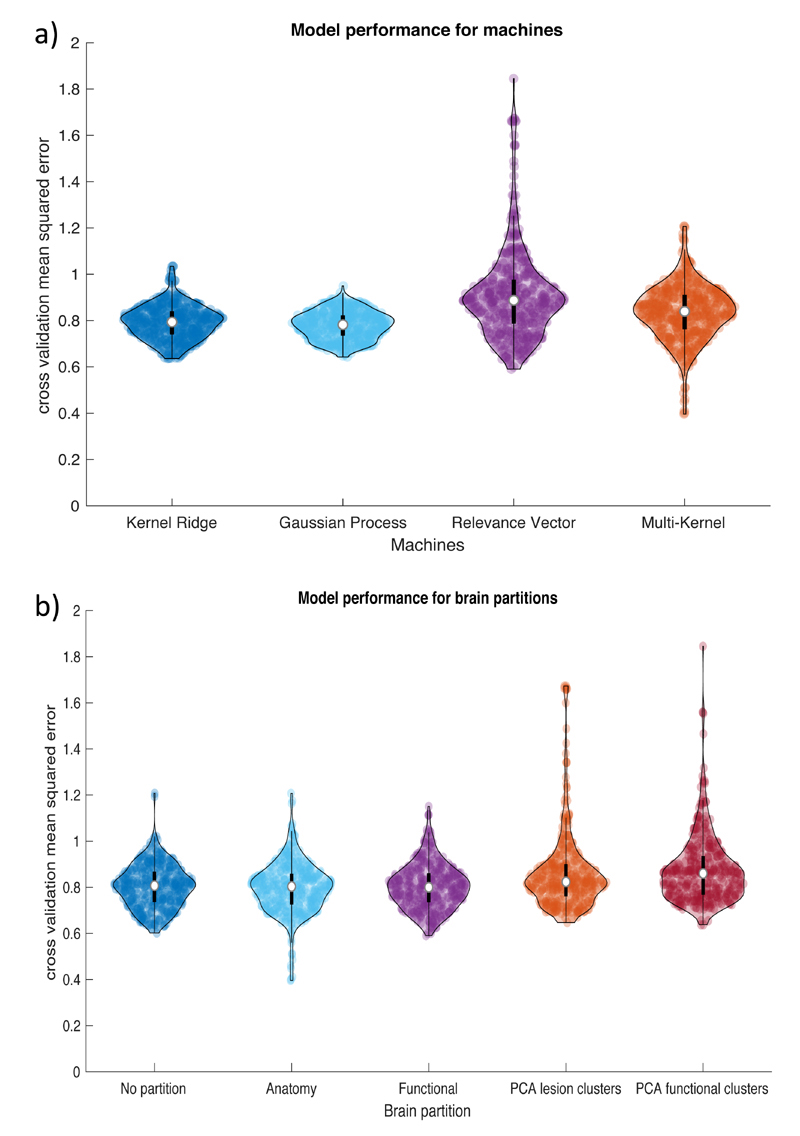
Neuroimaging has radically improved our understanding of how speech and language abilities map to the brain in normal and impaired participants, including the diverse, graded variations observed in post-stroke aphasia. A handful of studies have begun to explore the reverse inference: creating brain-to-behaviour prediction models. In this study, we explored the effect of three critical parameters on model performance: (1) brain partitions as predictive features, (2) combination of multimodal neuroimaging and (3) type of machine learning algorithms. We explored the influence of these factors while predicting four principal dimensions of language and cognition variation in post-stroke aphasia. Across all four behavioural dimensions, we consistently found that prediction models derived from diffusion-weighted data did not improve performance over models using structural measures extracted from T1 scans. Our results provide a set of principles to guide future work aiming to predict outcomes in neurological patients from brain imaging data.


Conflict of interest statement

Competing interests

The authors declare no competing interests.

Figures

Figure 1
Figure 1
A schematic representation of the prediction model creations. For each model we used one or more inputs features and selected one brain partition (green box), which were entered into one of the machines (blue box) for training in order to predict a behavioural component (red box). We iterated the inputs using: a) each single input, b) all pair-wise combinations, c) T1 or diffusion related inputs, separately and d) all inputs together.
Figure 2
Figure 2
Cross validation approach to determine optimal number of components for principal components analysis (PCA). The graph shows the results for 3-7 factors in the PCA model, which were used to predict left out data (using 5-fold cross validation). The y-axis represents the root mean square error (RMSE), where lower values indicate better performance. The lines represent different sample sizes, where the total dataset contained data from 70 chronic stroke patients. In order to make sure the sub samples were not biased we randomly selected N cases 100 times and for each iteration we randomly shuffled the order of the cases 100 times (to avoid ordering bias for venetian blinds sampling). The RMSE was calculated on each shuffle using a PCA model based on 1: test variables-1 factors and averaged across the 100 shuffles. Standard error bars are displayed for each point.
Figure 3
Figure 3
Lesion overlap map for 69 patients with left hemisphere post stroke aphasia. Colour scale indicates the percentage of patients with damage to each brain region (scale 1-80%). The voxel that was most frequently damaged (81.16% of cases) was located in the superior longitudinal fasciculus/central operculum cortex (MNI coordinate -38, -10, 24).
Figure 4
Figure 4
Violin plots showing model performance (mean squared error between observed and predicted) for each neural input feature set used in this study (see Model IDs on the right for information) Each coloured dot represents the result of one model configuration and the white central dot represents the median.
Figure 5
Figure 5
Violin plots showing model performance (mean squared error between observed and predicted) for: A) four machine learning regression algorithms and B) five brain partitions. Each dot represents the result for one model configuration and the white circle represents the median. Abbreviations: principal component analysis (PCA).

Comment in

References

    1. Adamson J, Beswick A, Ebrahim S. Is stroke the most common cause of disability? J Stroke Cerebrovasc Dis. 2004;13:171–177. - PubMed
    1. Berthier ML. Poststroke aphasia: Epidemiology, pathophysiology and treatment. Drugs and Aging. 2005;22:163–182. - PubMed
    1. Engelter ST, et al. Epidemiology of aphasia attributable to first ischemic stroke: Incidence, severity, fluency, etiology, and thrombolysis. Stroke. 2006;37:1379–1384. - PubMed
    1. Halai AD, Woollams AM, Lambon Ralph MA. Predicting the pattern and severity of chronic post-stroke language deficits from functionally-partitioned structural lesions. NeuroImage Clin. 2018;19:1–13. - PMC - PubMed
    1. Hope TMH, Leff AP, Price CJ. Predicting language outcomes after stroke: Is structural disconnection a useful predictor? NeuroImage Clin. 2018;19:22–29. - PMC - PubMed

Publication types

MeSH terms