. 2020 May;52(5):541-547.
doi: 10.1038/s41588-020-0613-6. Epub 2020 Apr 20.

Liability threshold modeling of case-control status and family history of disease increases association power

Affiliations

Liability threshold modeling of case-control status and family history of disease increases association power

Margaux L A Hujoel et al. Nat Genet. 2020 May.

Abstract

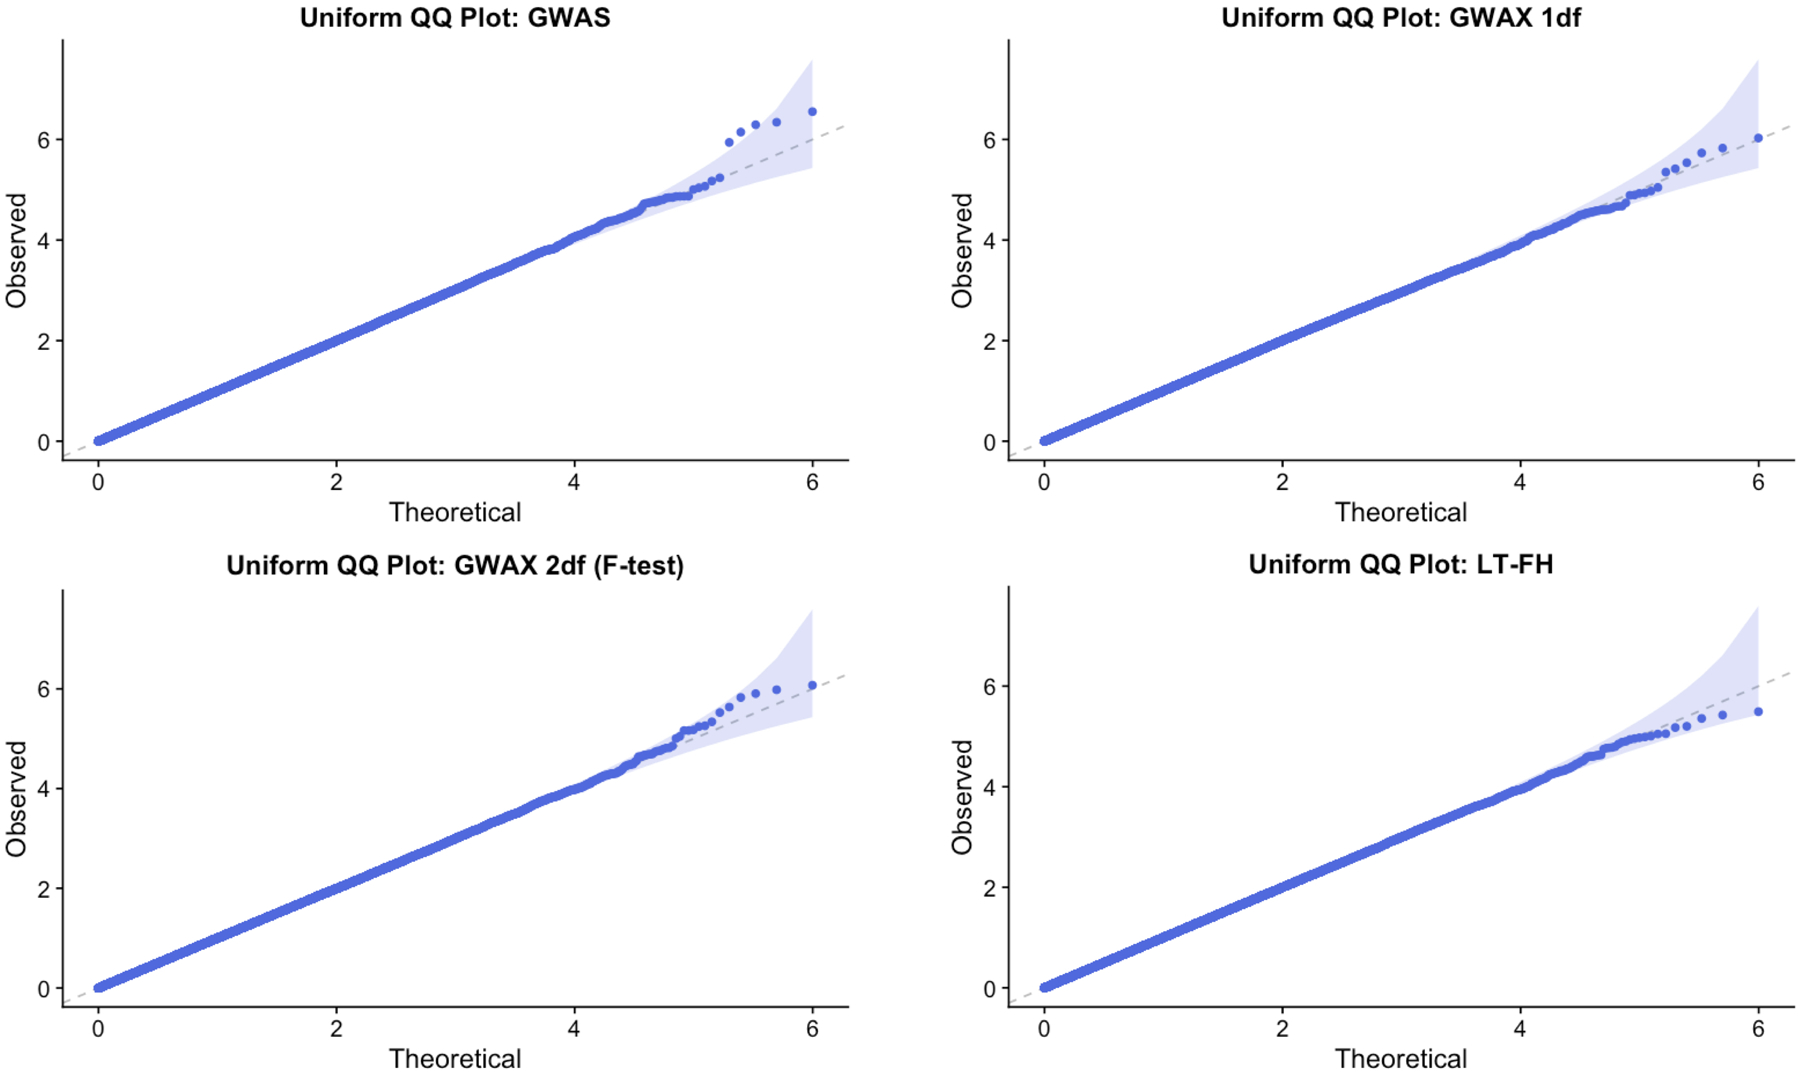
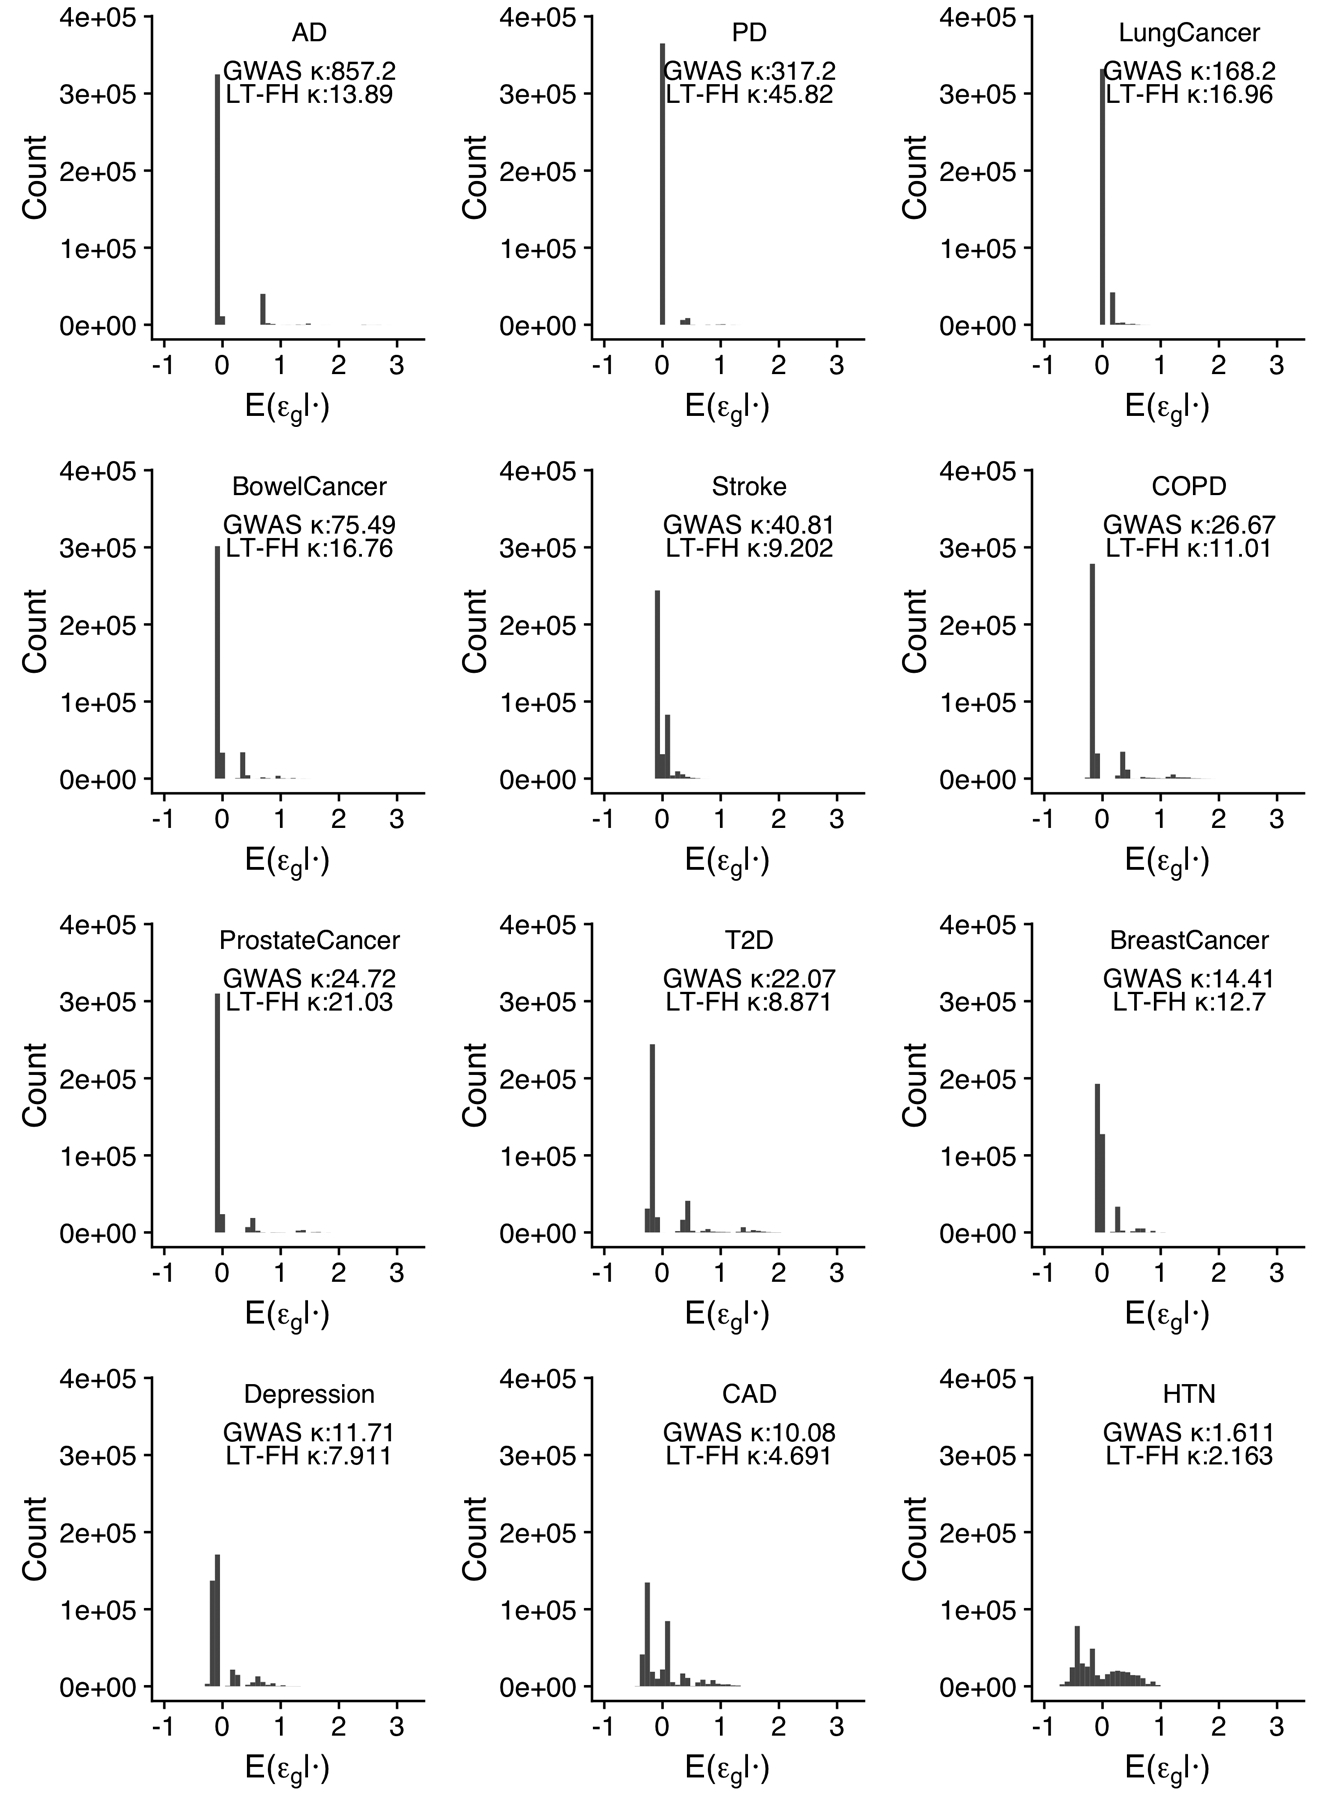
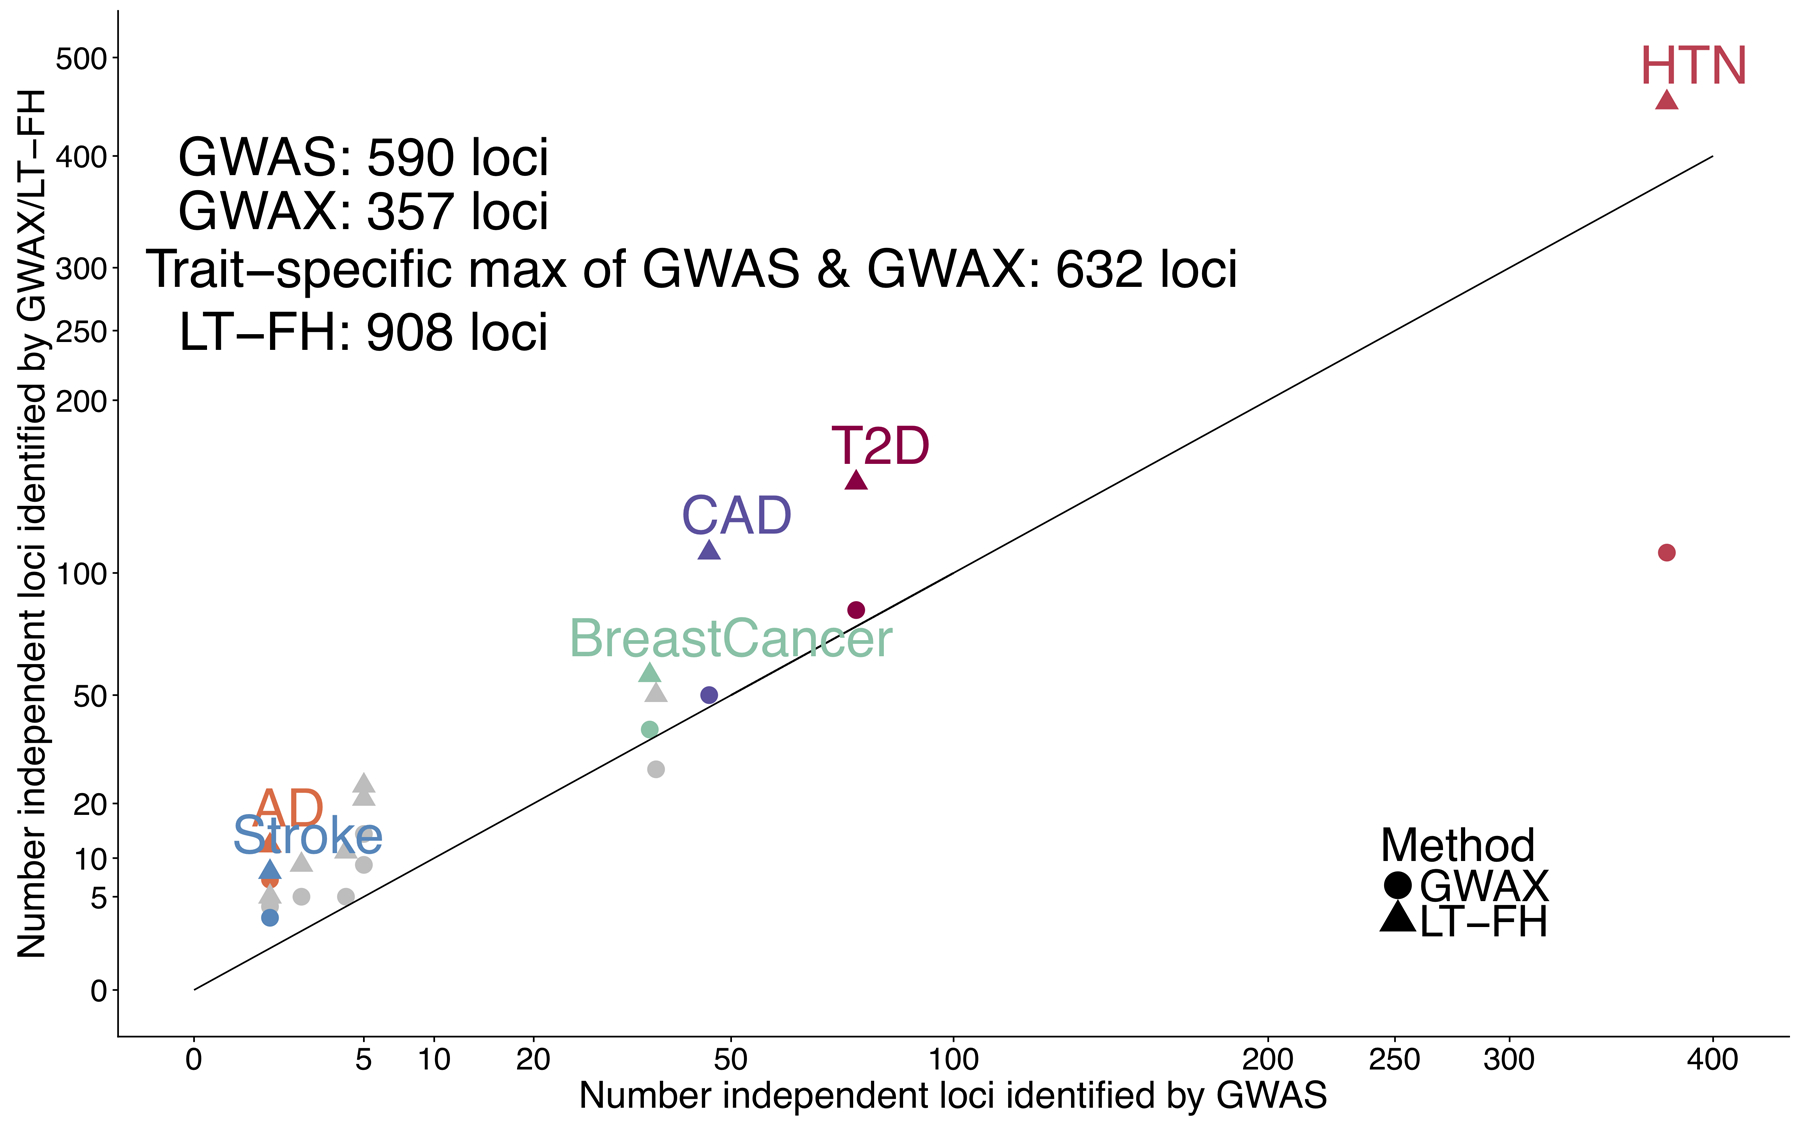
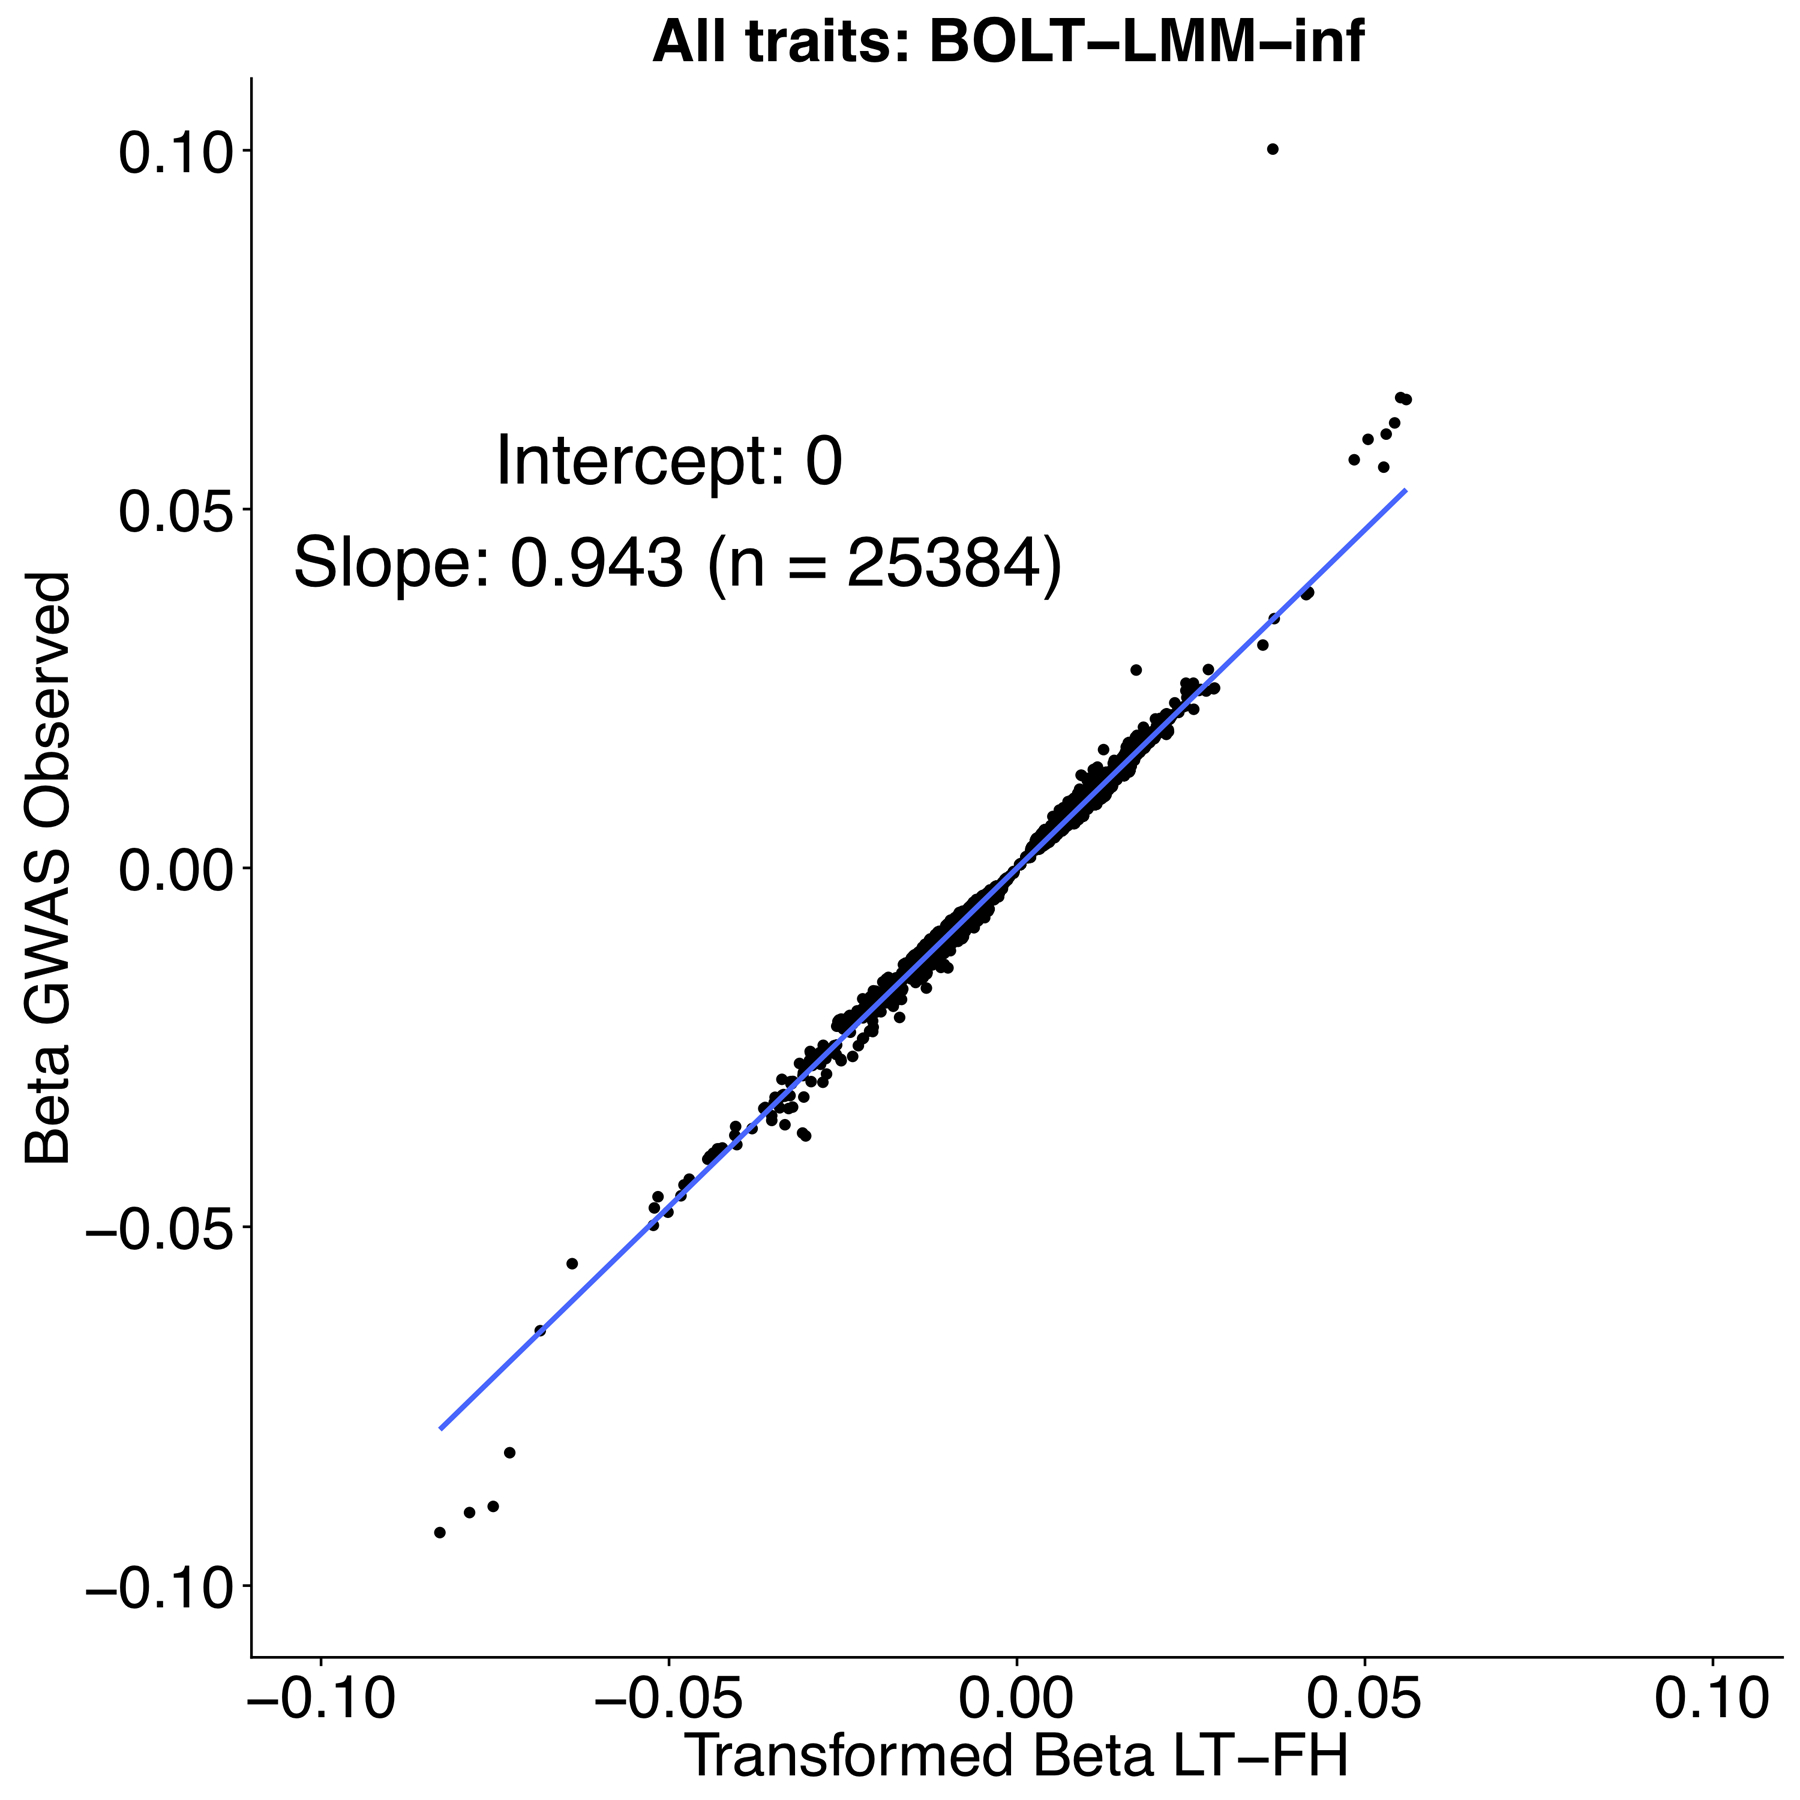
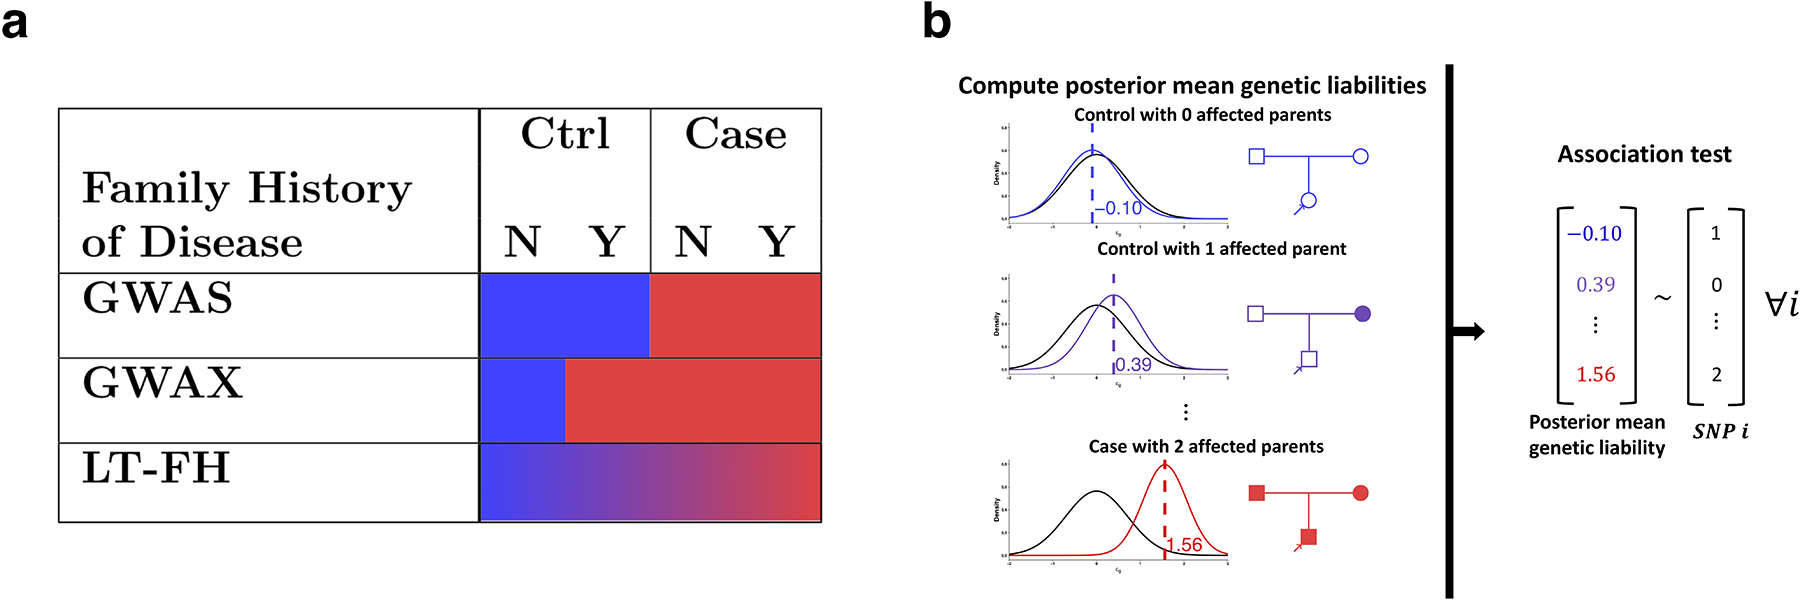
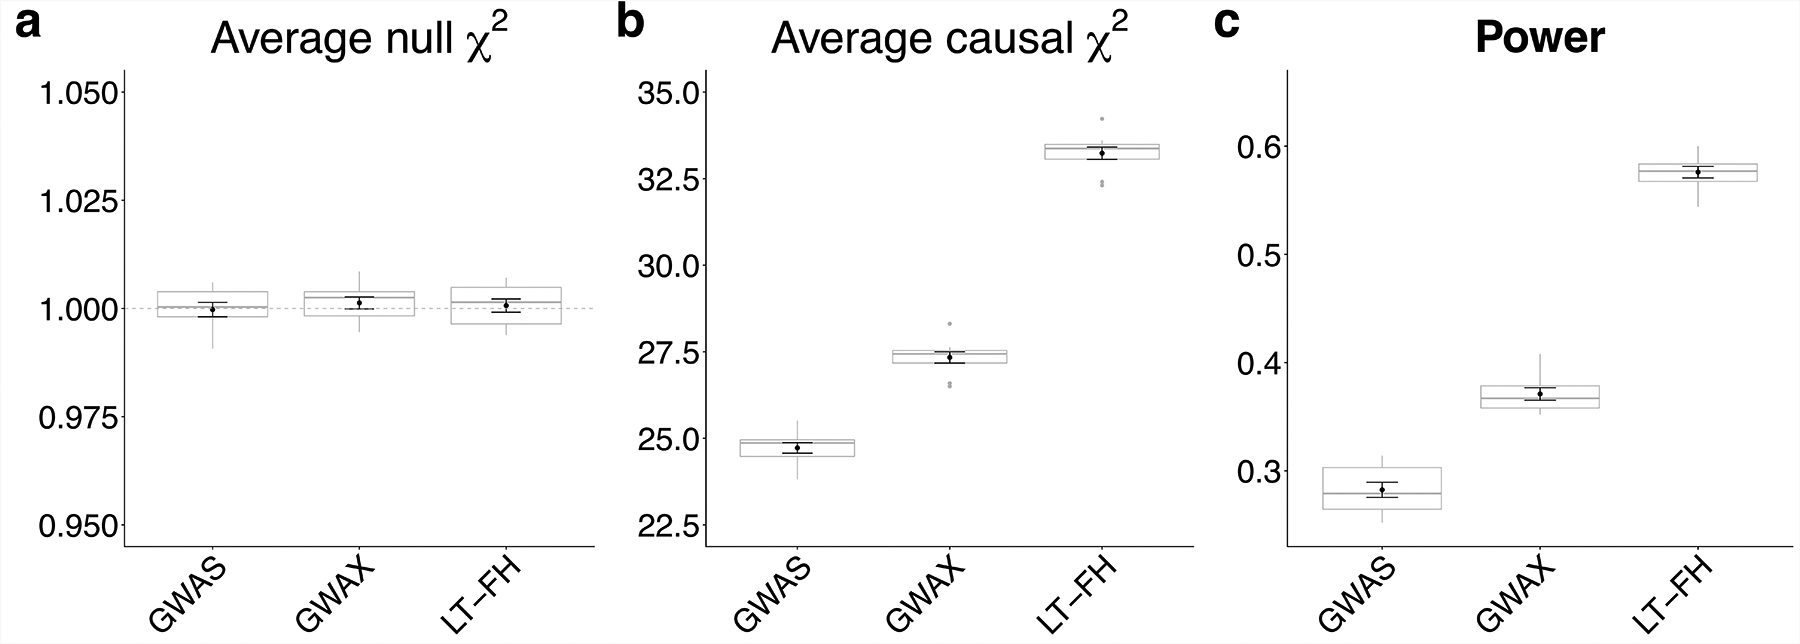
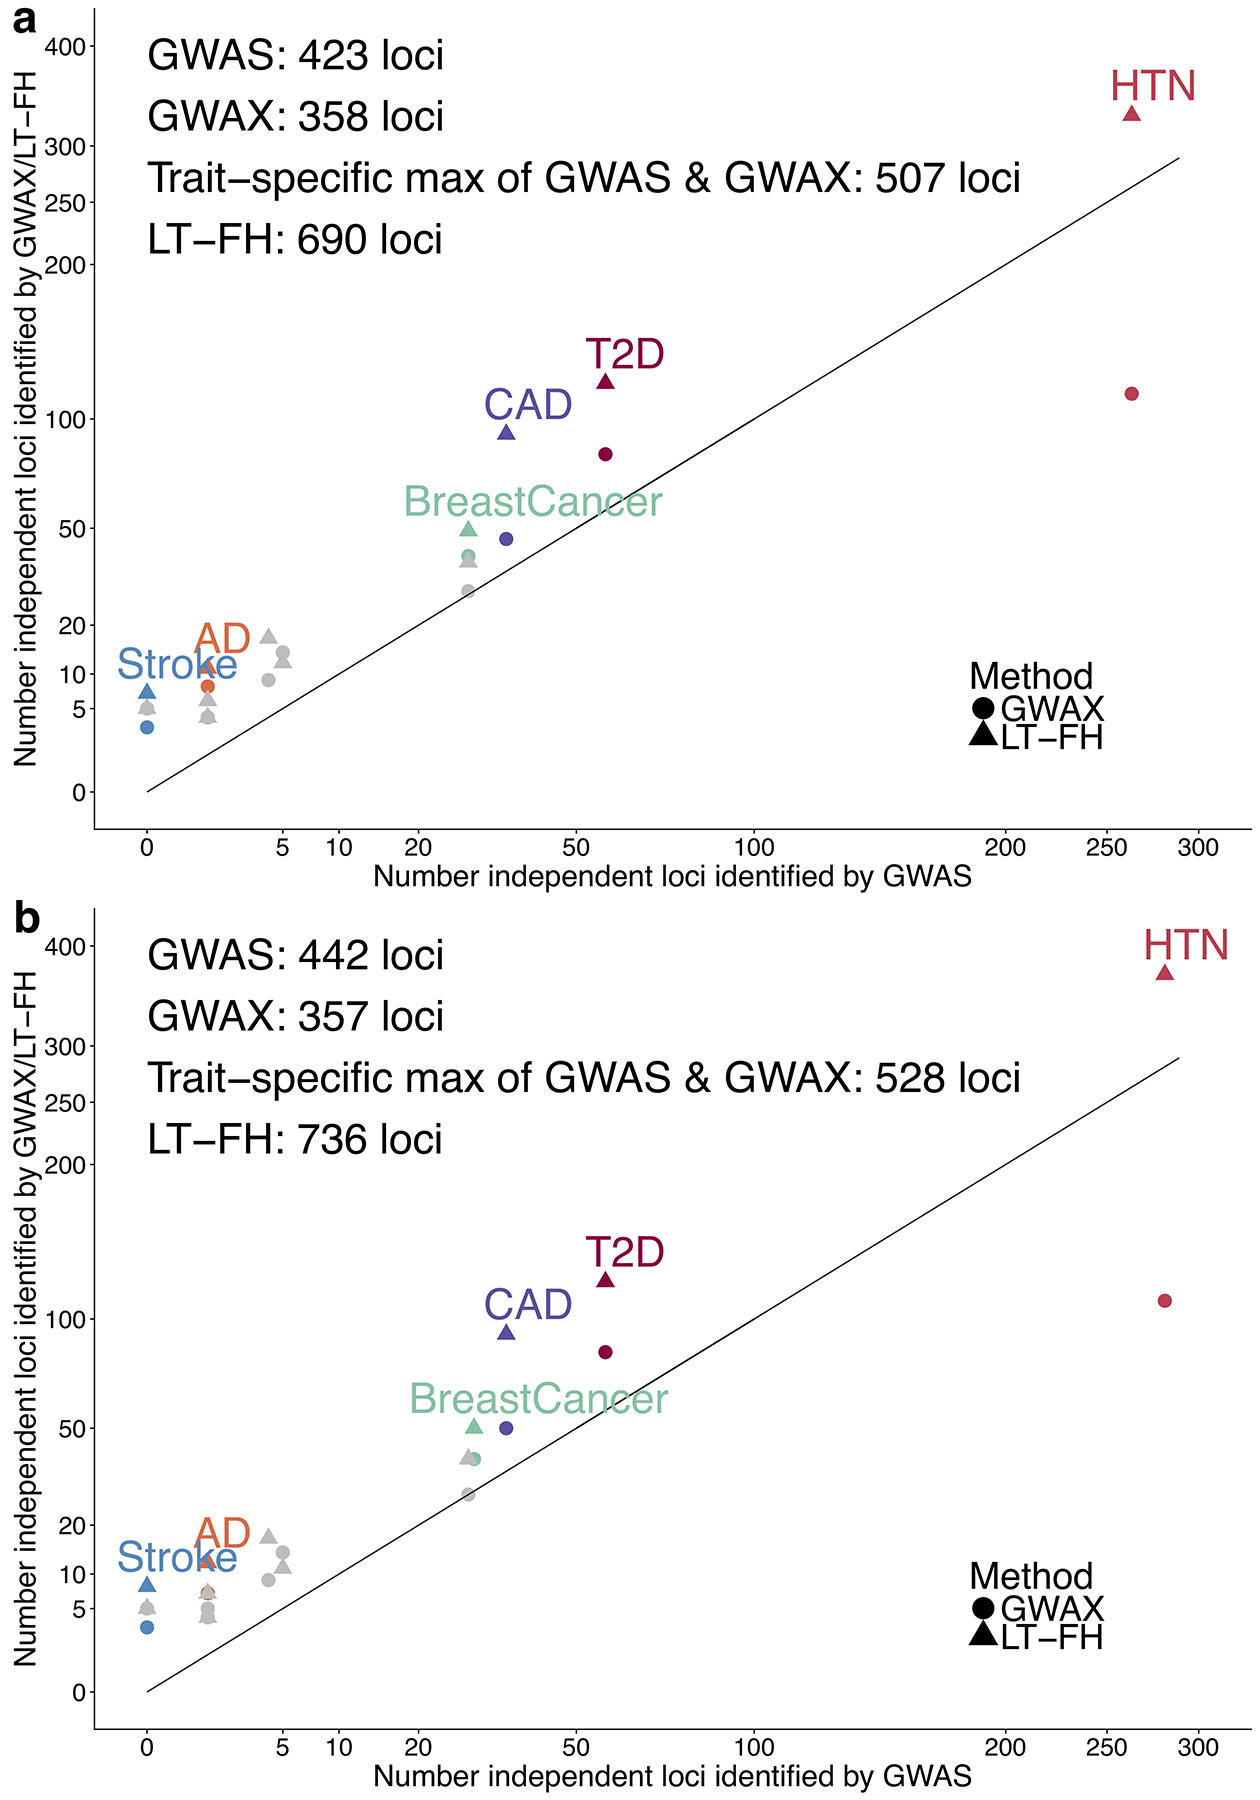
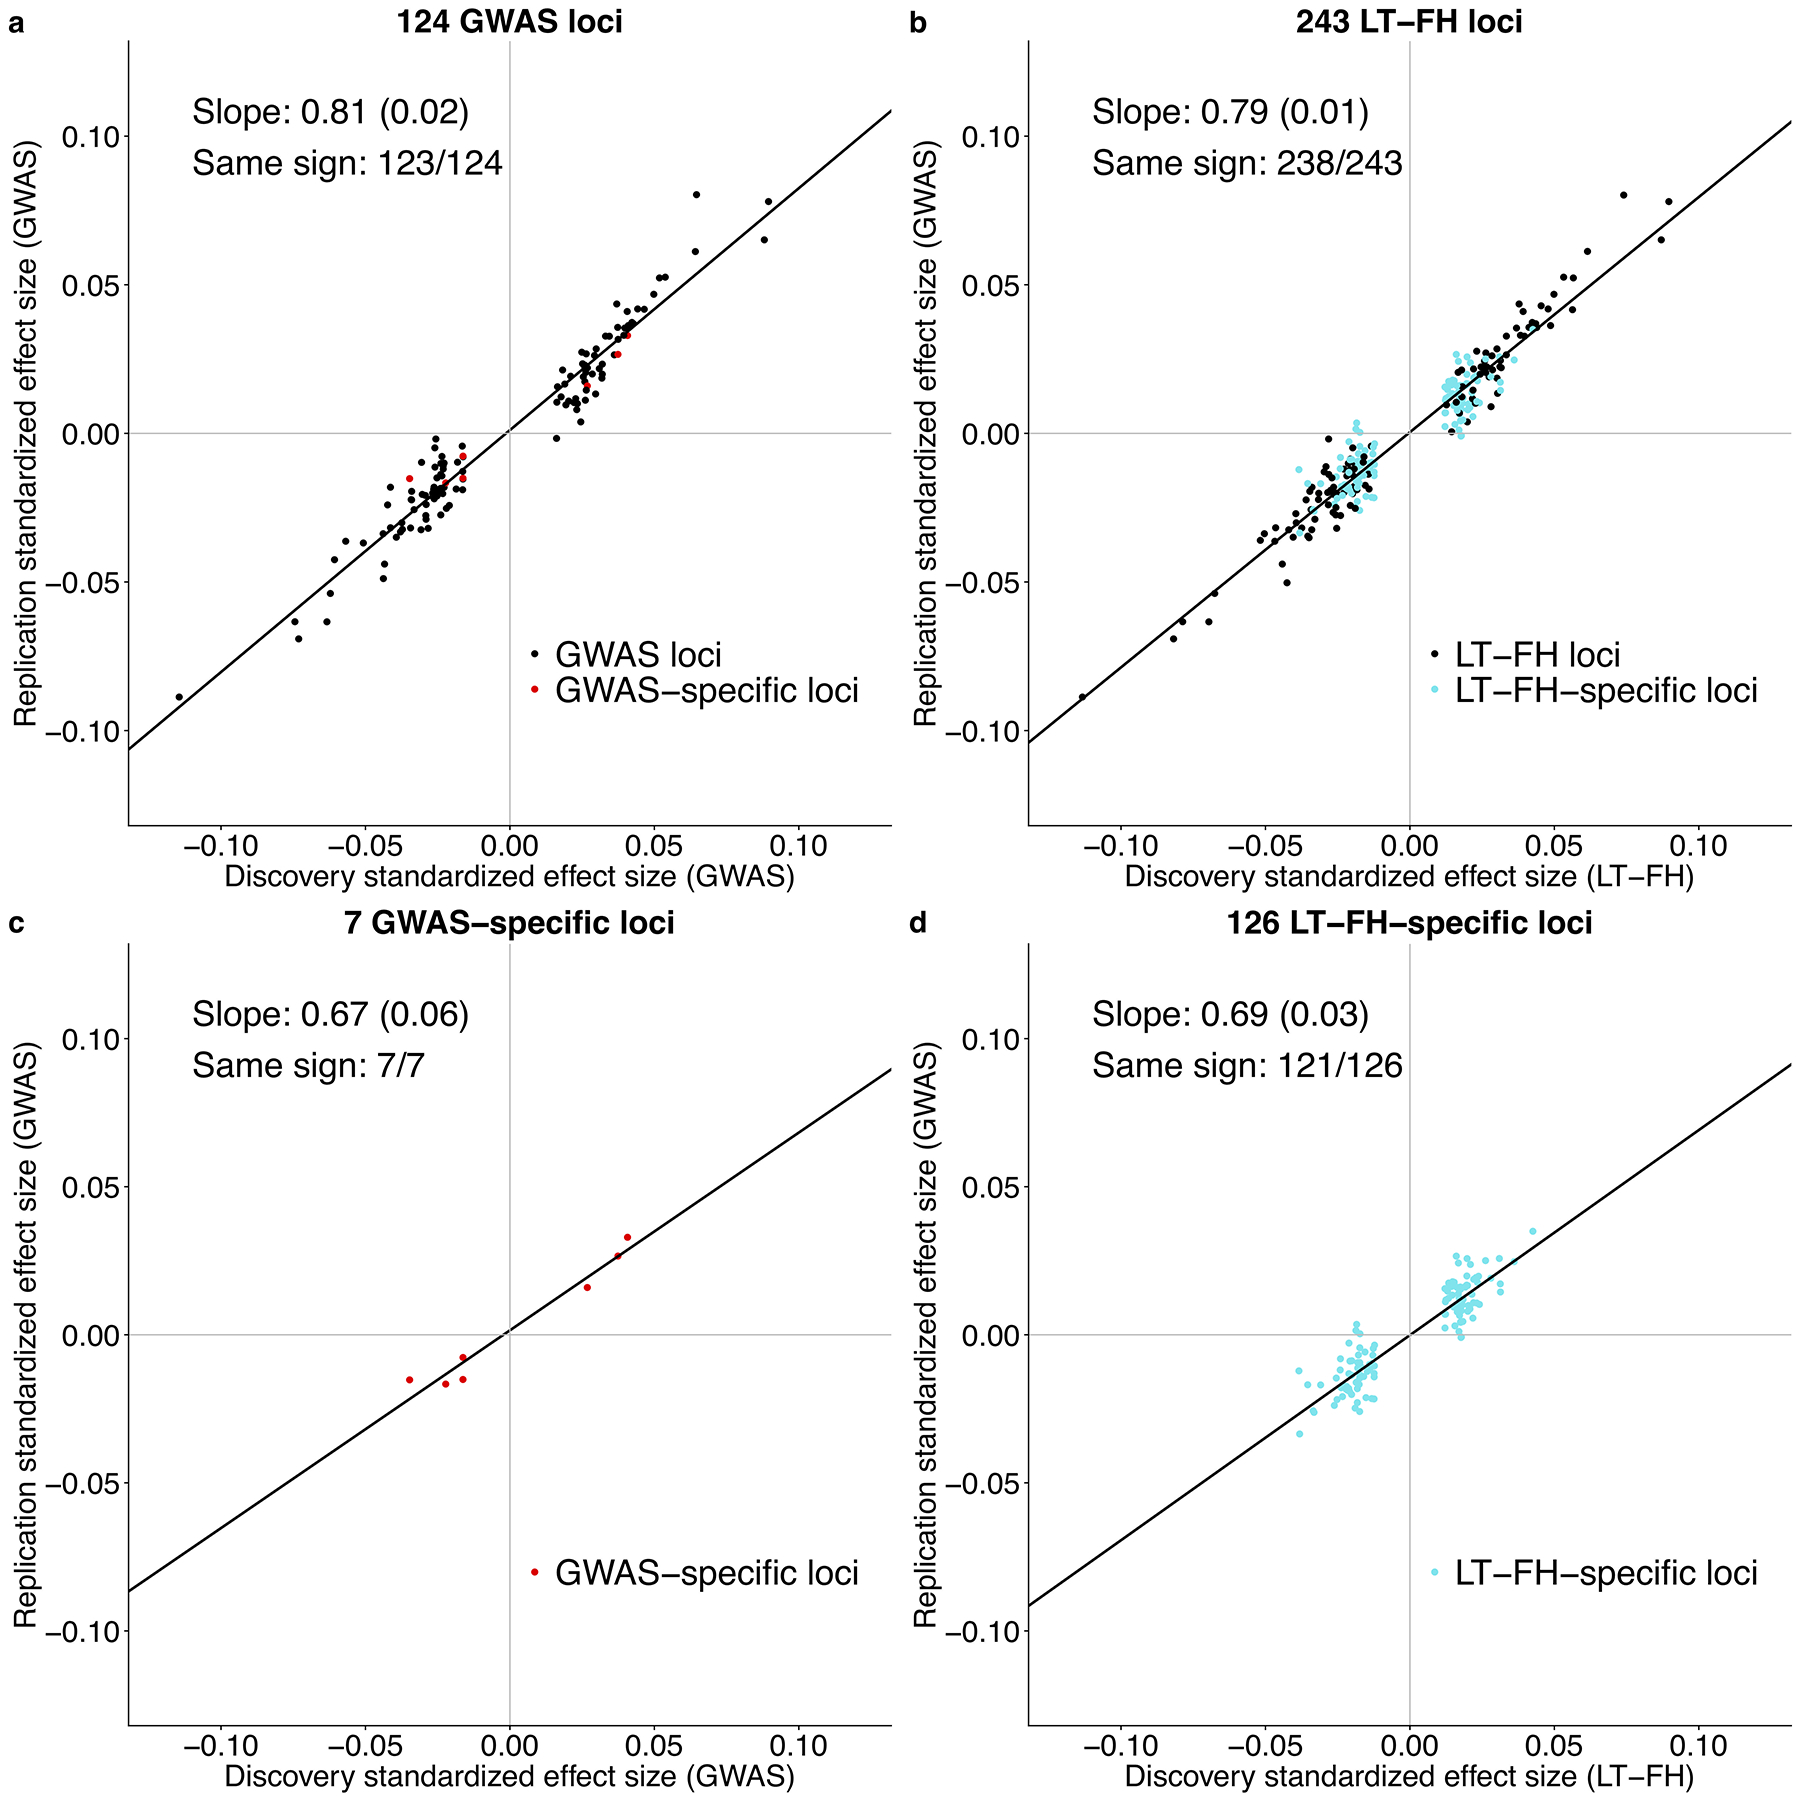
Family history of disease can provide valuable information in case-control association studies, but it is currently unclear how to best combine case-control status and family history of disease. We developed an association method based on posterior mean genetic liabilities under a liability threshold model, conditional on case-control status and family history (LT-FH). Analyzing 12 diseases from the UK Biobank (average N = 350,000) we compared LT-FH to genome-wide association without using family history (GWAS) and a previous proxy-based method incorporating family history (GWAX). LT-FH was 63% (standard error (s.e.) 6%) more powerful than GWAS and 36% (s.e. 4%) more powerful than the trait-specific maximum of GWAS and GWAX, based on the number of independent genome-wide-significant loci across all diseases (for example, 690 loci for LT-FH versus 423 for GWAS); relative improvements were similar when applying BOLT-LMM to GWAS, GWAX and LT-FH phenotypes. Thus, LT-FH greatly increases association power when family history of disease is available.


Conflict of interest statement

Competing Interests Statement

The authors declare no competing interests.

Figures

Extended Data Fig. 1
Extended Data Fig. 1. QQ plots from simulations with default parameter settings.
We report quantile-quantile (QQ) plots for null SNPs in simulations with default parameter settings. Results are based on 10 simulation replicates. These QQ plots compare the observed distribution of p-values with the standard uniform distribution. We plot the observed – log10(p) as a function of log10(rankn+1) and the 95% confidence bands are constructed pointwise using the beta distribution.
Extended Data Fig. 2
Extended Data Fig. 2. Distribution of LT-FH phenotypes for 12 UK Biobank diseases.
We plot the distribution of the LT-FH phenotype for each disease. We also report the kurtosis for both GWAS and LT-FH; Pearson’s measure of kurtosis, κ=E[(Xμ)4](E[(Xμ)2])2, is calculated using the R package moments.
Extended Data Fig. 3
Extended Data Fig. 3. Impact of modifying the LT-FH method to incorporate age information as a function of the liability threshold model parameter for age for 12 UK Biobank diseases.
We plot the increase in number of independent loci for LT-FHnosib,agePA relative to for LT-FHnosibPA (Table S32) against the liability threshold model parameter |cage| (Table S30).
Extended Data Fig. 4
Extended Data Fig. 4. LT-FH increases association power across 12 diseases from the UK Biobank in analyses incorporating related individuals.
We report results of GWAS using BOLT-LMM on related Europeans, GWAX using BOLT-LMM on unrelated Europeans, and LT-FH using BOLT-LMM on related Europeans using only case-control status for all sibling pairs and parent-offspring pairs within the set of target samples. Numerical results are reported in Table S37.
Extended Data Fig. 5
Extended Data Fig. 5. Strong concordance between GWAS BOLT-LMM-inf effect sizes and transformed LT-FH BOLT-LMM-inf effect sizes.
We plot GWAS BOLT-LMM-inf effect sizes and transformed LT-FH BOLT-LMM-inf effect sizes for genome-wide significant effect sizes (P ≤ 5 * 10−8 for both GWAS and LT-FH BOLT-LMM-inf). We note that BOLT-LMM only outputs effect size estimates for BOLT-LMM-inf, the BOLT-LMM approximation to the infinitesimal mixed model. Our effect size for GWAS is the outputted βGWAS,BOLT - LMM - in f (per-allele observed scale) and for LT-FH we estimate a (per-allele observed scale) effect size as β=βLTFH,BOLTLMMin fse(βLTFH,BOLTLMMin f)NGWAS*cK(1K)2(MAF)(1MAF), where c is the boost in Neff for LT-FH relative to GWAS, K is disease prevalence in GWAS and MAF is the minor allele frequency of the SNP.
Figure 1:
Figure 1:. Overview of LT-FH and other methods.
(a) GWAS uses binary case-control status, ignoring family history; GWAX uses binary proxy-case-control status, merging controls with family history of disease with disease cases; LT-FH uses continuous-valued posterior mean genetic liability, appropriately differentiating all case-control and family history configurations. (b) LT-FH computes posterior mean genetic liabilities (left panel) and then tests for association between genotype and posterior mean genetic liability (right panel).
Figure 2:
Figure 2:. LT-FH is well-calibrated and increases association power in simulations.
(a) Distribution of average χ2 for null SNPs (the dashed grey line shows the expected null value of 1). (b) Distribution of average χ2 for causal SNPs. (c) Distribution of power, defined as the proportion of causal SNPs with p < 5*10−8. Each grey boxplot represents estimates from 10 simulations, each simulation consists of 100,000 SNPs (500 causal SNPs). The center line denotes the median, the lower and upper hinges correspond to first and third quartiles, respectively, whiskers extend to the minimum and maximum estimates located within 1.5 × interquartile range (IQR) from the lower and upper hinge, respectively. Black points and error bars represent the mean and ± 1 standard error of the mean. Numerical results are reported in Supplementary Table 1.
Figure 3:
Figure 3:. LT-FH increases association power across 12 diseases from the UK Biobank.
We report results of GWAS, GWAX and LT-FH using either (a) linear regression or (b) BOLT-LMM on unrelated European individuals. Numerical results are reported in Supplementary Table 21 and Supplementary Table 35.
Figure 4:
Figure 4:. Loci identified by LT-FH replicate in independent data sets.
We plot standardized effect sizes (Z/Neff) in the non-UK Biobank replication data (average Neff = 99K for GWAS) vs. the UK Biobank discovery data (average Neff = 62K for GWAS, 102K for LT-FH), aggregated across 4 diseases (CAD, T2D, breast cancer and prostate cancer), for (a) the 124 loci identified by GWAS, (b) the 243 loci identified by LT-FH, (c) the 7 loci identified by GWAS but not LT-FH, and (d) the 126 loci identified by LT-FH but not GWAS. Numerical results are reported in Supplementary Table 25.

References

    1. Liu JZ, Erlich Y & Pickrell JK Case-control association mapping by proxy using family history of disease. Nat. Genet 49, 325–331 (2017). - PubMed
    1. So H-C, Kwan JSH, Cherny SS & Sham PC Risk Prediction of Complex Diseases from Family History and Known Susceptibility Loci, with Applications for Cancer Screening. Am. J. Hum. Genet 88, 548–565 (2011). - PMC - PubMed
    1. Visscher PM & Duffy DL The Value of Relatives With Phenotypes But Missing Genotypes in Association Studies for Quantitative Traits. Genet. Epidemiol 30, 30–36 (2006). - PubMed
    1. Hayes BJ, Bowman PJ, Chamberlain AJ & Goddard ME Genomic selection in dairy cattle: Progress and challenges. J. Dairy Sci 92, 433–443 (2008). - PubMed
    1. Misztal I, Legarra A & Aguilar I Computing procedures for genetic evaluation including phenotypic, full pedigree, and genomic information. J. Dairy Sci 92, 4648–4655 (2009). - PubMed

Publication types

MeSH terms