

Mapping local patterns of childhood overweight and wasting in low- and middle-income countries between 2000 and 2017
- PMID: 32313249
- PMCID: PMC7220891
- DOI: 10.1038/s41591-020-0807-6
Mapping local patterns of childhood overweight and wasting in low- and middle-income countries between 2000 and 2017
Erratum in
-
Author Correction: Mapping local patterns of childhood overweight and wasting in low- and middle-income countries between 2000 and 2017.Nat Med. 2020 Aug;26(8):1308. doi: 10.1038/s41591-020-0972-7. Nat Med. 2020. PMID: 32616917 Free PMC article.
Abstract
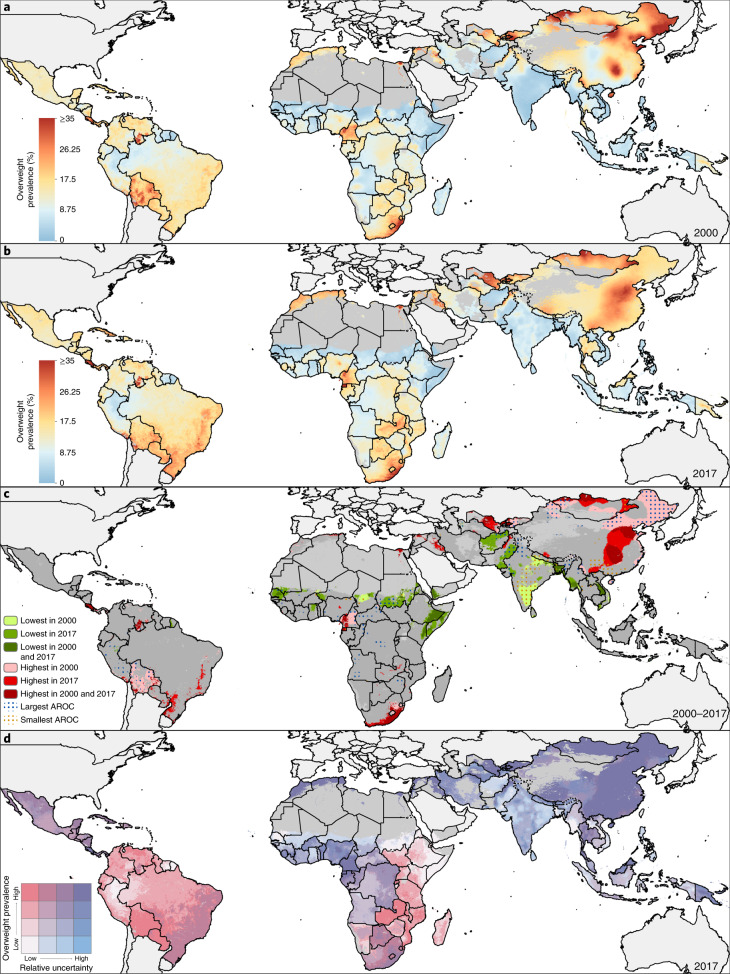
A double burden of malnutrition occurs when individuals, household members or communities experience both undernutrition and overweight. Here, we show geospatial estimates of overweight and wasting prevalence among children under 5 years of age in 105 low- and middle-income countries (LMICs) from 2000 to 2017 and aggregate these to policy-relevant administrative units. Wasting decreased overall across LMICs between 2000 and 2017, from 8.4% (62.3 (55.1-70.8) million) to 6.4% (58.3 (47.6-70.7) million), but is predicted to remain above the World Health Organization's Global Nutrition Target of <5% in over half of LMICs by 2025. Prevalence of overweight increased from 5.2% (30 (22.8-38.5) million) in 2000 to 6.0% (55.5 (44.8-67.9) million) children aged under 5 years in 2017. Areas most affected by double burden of malnutrition were located in Indonesia, Thailand, southeastern China, Botswana, Cameroon and central Nigeria. Our estimates provide a new perspective to researchers, policy makers and public health agencies in their efforts to address this global childhood syndemic.
Conflict of interest statement
This study was funded by the Bill & Melinda Gates Foundation. Co-authors employed by the Bill & Melinda Gates Foundation provided feedback on initial maps and drafts of this manuscript. Otherwise, the funders of the study had no role in study design, data collection, data analysis, data interpretation, writing of the final report or the decision to publish. The corresponding author had full access to all data in the study and had final responsibility for the decision to submit for publication. Dr Uddin reports personal fees from Deakin University Institute for Physical Activity and Nutrition, Australia, outside the submitted work. Dr Lorkowski reports personal fees from Akcea Therapeutics, Amedes MVZ für Laboratoriumsdiagnostik und Mikrobiologie, AMGEN, Berlin-Chemie, Boehringer Ingelheim Pharma, Daiichi Sankyo, MSD Sharp & Dohme, Novo Nordisk, Sanofi-Aventis, Synlab, Unilever and Upfield, as well as nonfinancial support from Preventicus outside the submitted work. Prof. Postma reports grants and personal fees from various pharmaceutical industries, all outside the submitted work. Prof. Postma holds stocks in Ingress Health and Pharmacoeconomics Advice Groningen and is advisor to Asc Academics, all pharmacoeconomic consultancy companies. Dr Remuzzi reports personal fees and nonfinancial support from Alnylam, personal fees and nonfinancial support from Boehringer Ingelheim, personal fees and nonfinancial support from Handock Inc., personal fees and nonfinancial support from Inception Sciences Canada and personal fees and nonfinancial support from Achillion, outside the submitted work. Dr. Jakovljevic reports grants from Ministry of Education Science and Technological Development of the Republic of Serbia outside the submitted work. Dr Flohr reports grants from European Union IMI grant scheme (Horizon 2020) outside the submitted work. Dr Jozwiak reports personal fees from ALAB LABORATORIA, nonfinancial support from SERVIER, nonfinancial support from MICROLIFE, personal fees from TEVA POLSKA, nonfinancial support from SUPERPHARM and nonfinancial support from MEDICOVER, outside the submitted work. W. Mendoza is currently Program Analyst Population and Development at the United Nations Population Fund-UNFPA Country Office in Peru, which does not necessarily endorse this study. Prof. Saxena reports grants from NIHR School for Public Health Research, grants from NIHR Applied Research Collaboration and grants from The Daily Mile Foundation supported by INEOS, outside the submitted work. Dr Dunachie reports grants from The Fleming Fund at UK Department of Health and Social Care, during the conduct of the study. Dr Mozaffarian reports research funding from the National Institutes of Health and the Gates Foundation; personal fees from GOED, Nutrition Impact, Bunge, Indigo Agriculture, Motif FoodWorks, Amarin, Acasti Pharma, Cleveland Clinic Foundation, America’s Test Kitchen and Danone; scientific advisory board, Brightseed, DayTwo, Elysium Health and Filtricine; and chapter royalties from UpToDate; all outside the submitted work. Dr J. Singh reports personal fees from Crealta/Horizon, Medisys, Fidia, UBM LLC, Medscape, WebMD, Clinical Care Options, Clearview Healthcare Partners, Putnam Associates, Spherix, the National Institutes of Health and the American College of Rheumatology, stock options in Amarin Pharmaceuticals and Viking Pharmaceuticals and participates in the steering committee of OMERACT, an international organization that develops measures for clinical trials receives arm’s length funding from 12 pharmaceutical companies and is also on the speaker’s bureau of Simply Speaking.
Figures


References
-
- Black RE, et al. Maternal and child undernutrition and overweight in low-income and middle-income countries. Lancet. 2013;382:427–451. - PubMed
-
- Black RE, et al. Maternal and child undernutrition: global and regional exposures and health consequences. Lancet. 2008;371:243–260. - PubMed
-
- World Health Organization. Double burden of malnutrition http://www.who.int/nutrition/double-burden-malnutrition/en/ (2018).
-
- de Onis M, Blössner M, Borghi E. Global prevalence and trends of overweight and obesity among preschool children. Am. J. Clin. Nutr. 2010;92:1257–1264. - PubMed
