

Workflow for Comparison of Chemical and Biological Metrics of Filter Collected PM2.5
- PMID: 32313426
- PMCID: PMC7170255
- DOI: 10.1016/j.atmosenv.2020.117379
Workflow for Comparison of Chemical and Biological Metrics of Filter Collected PM2.5
Abstract
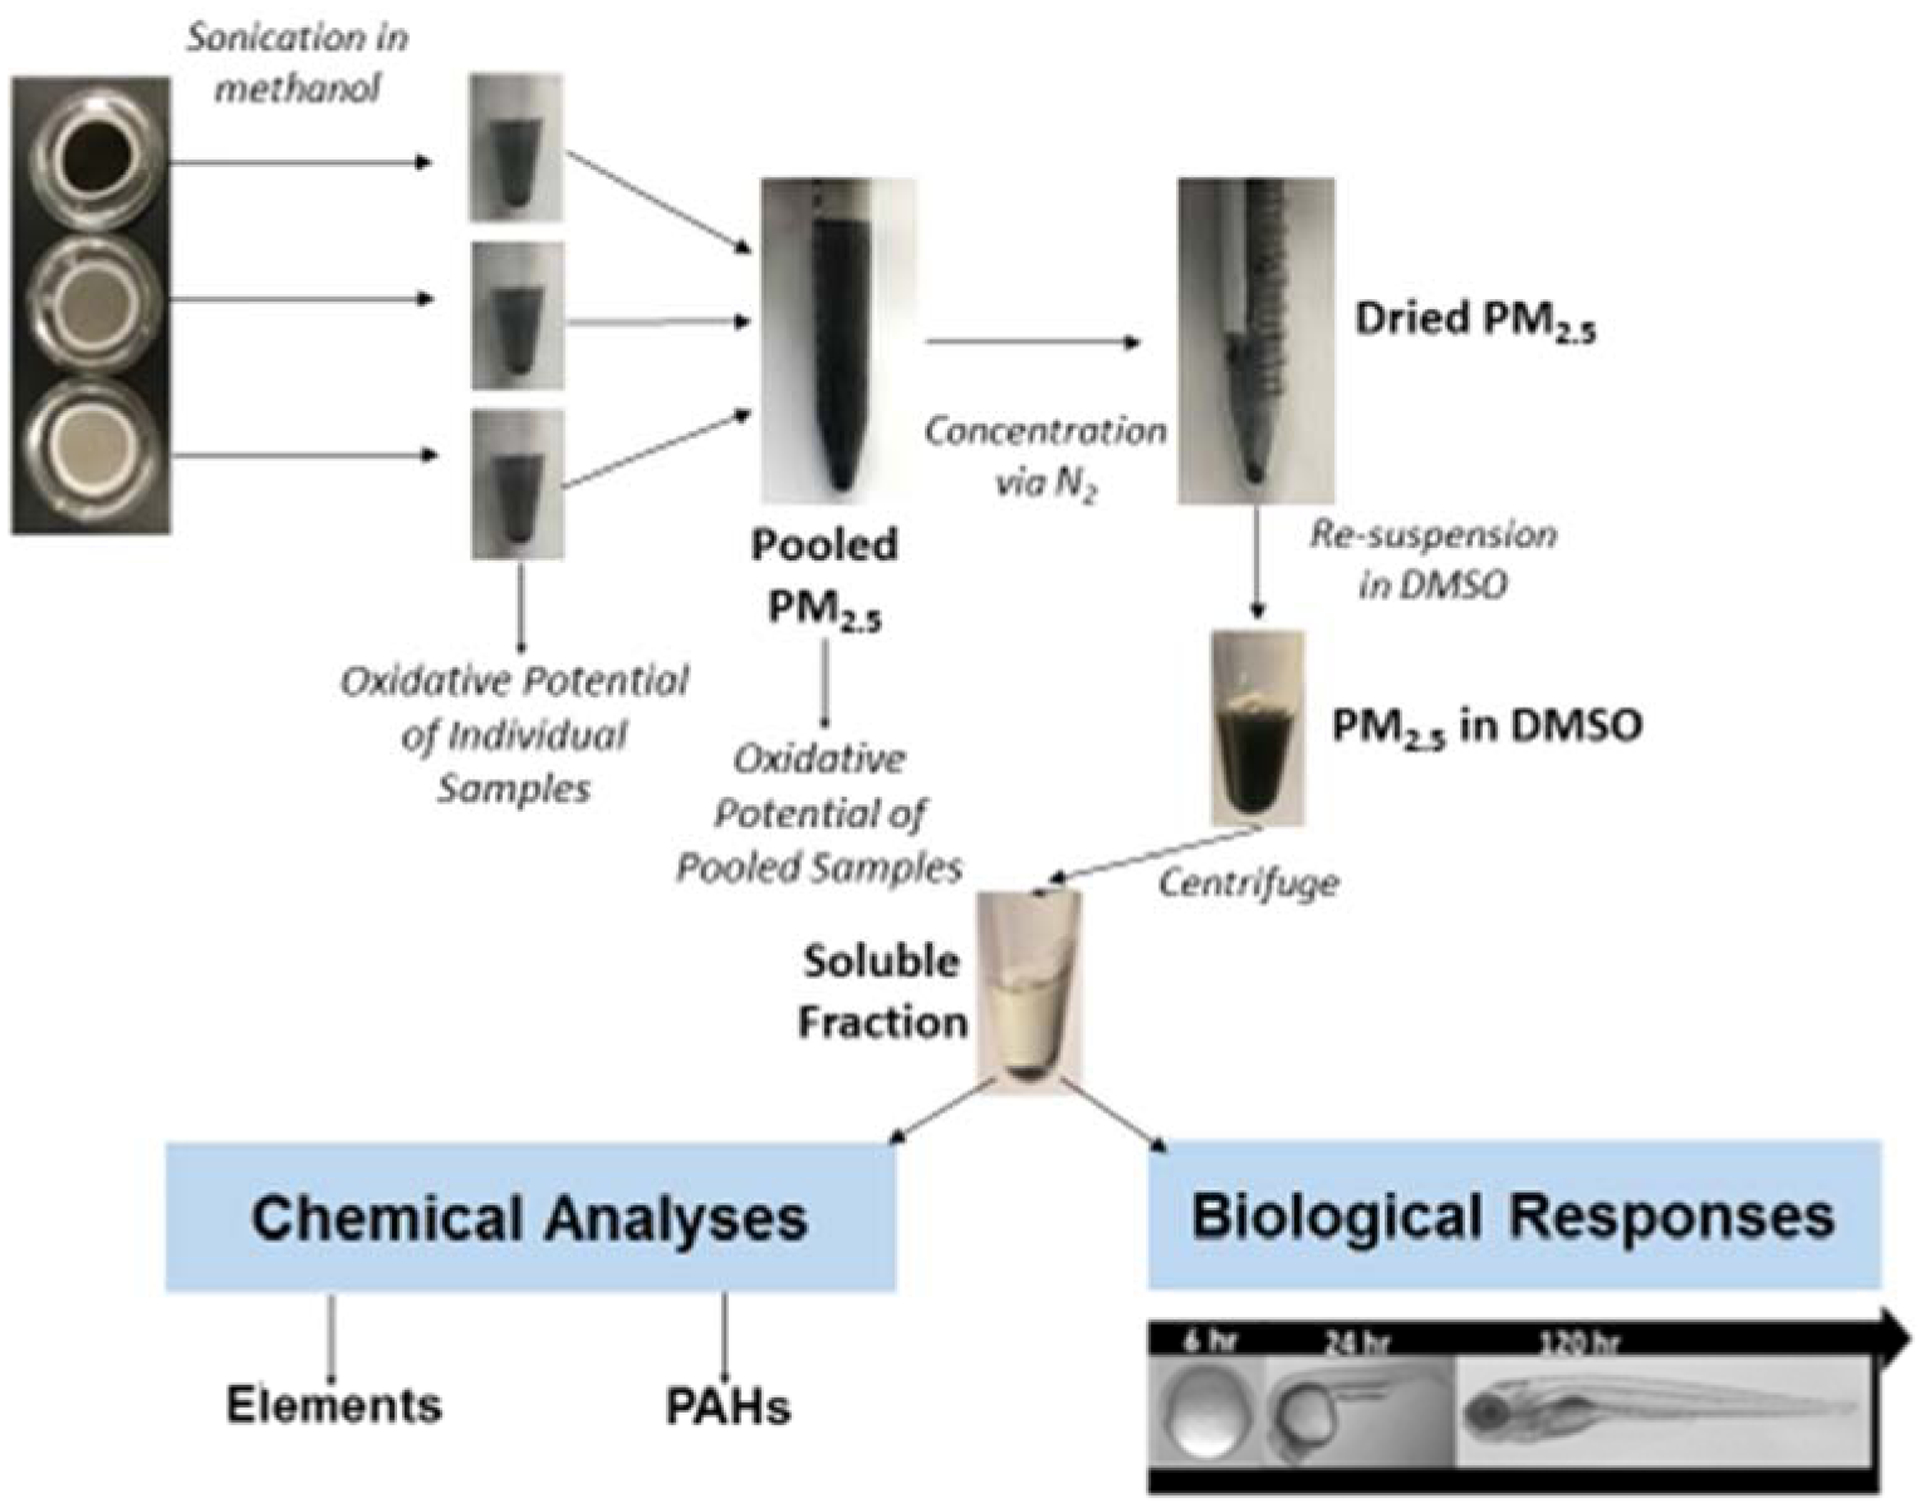
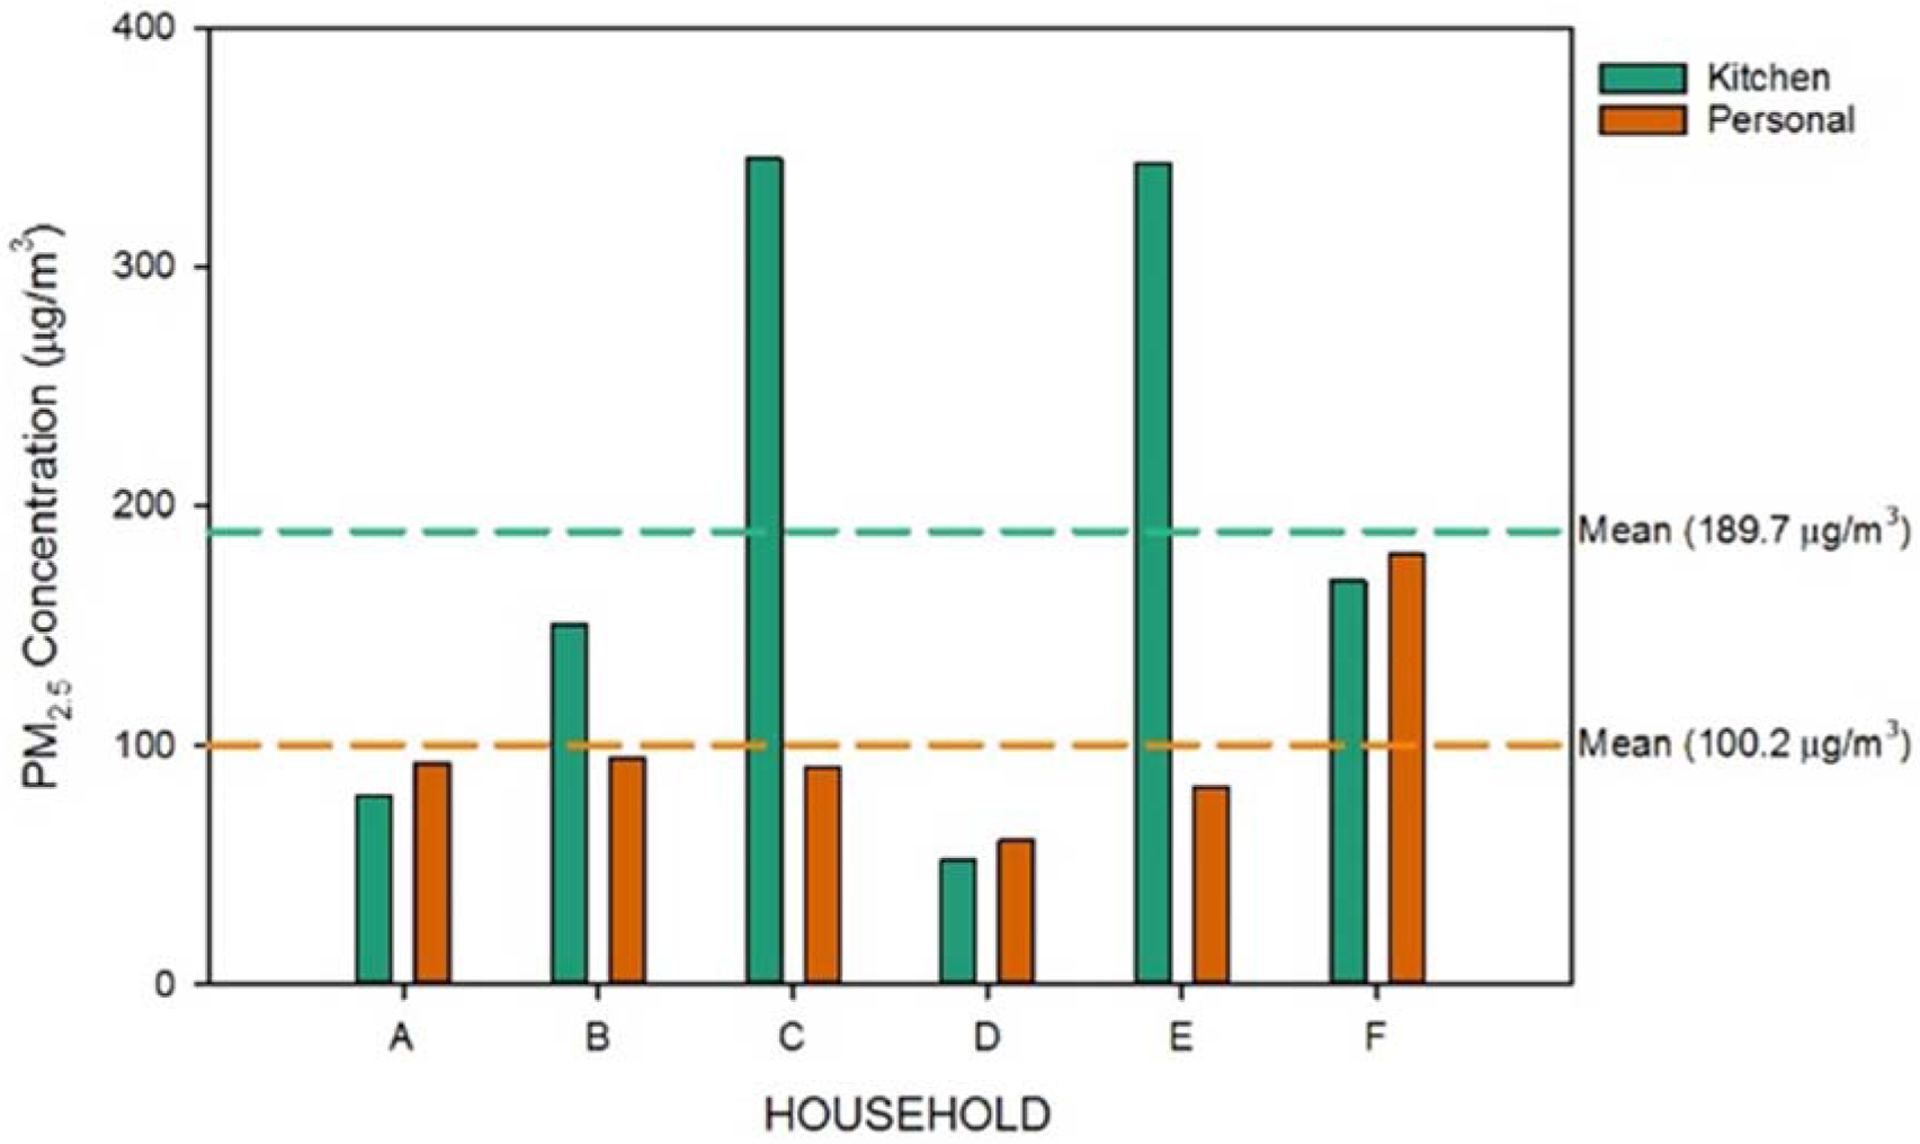
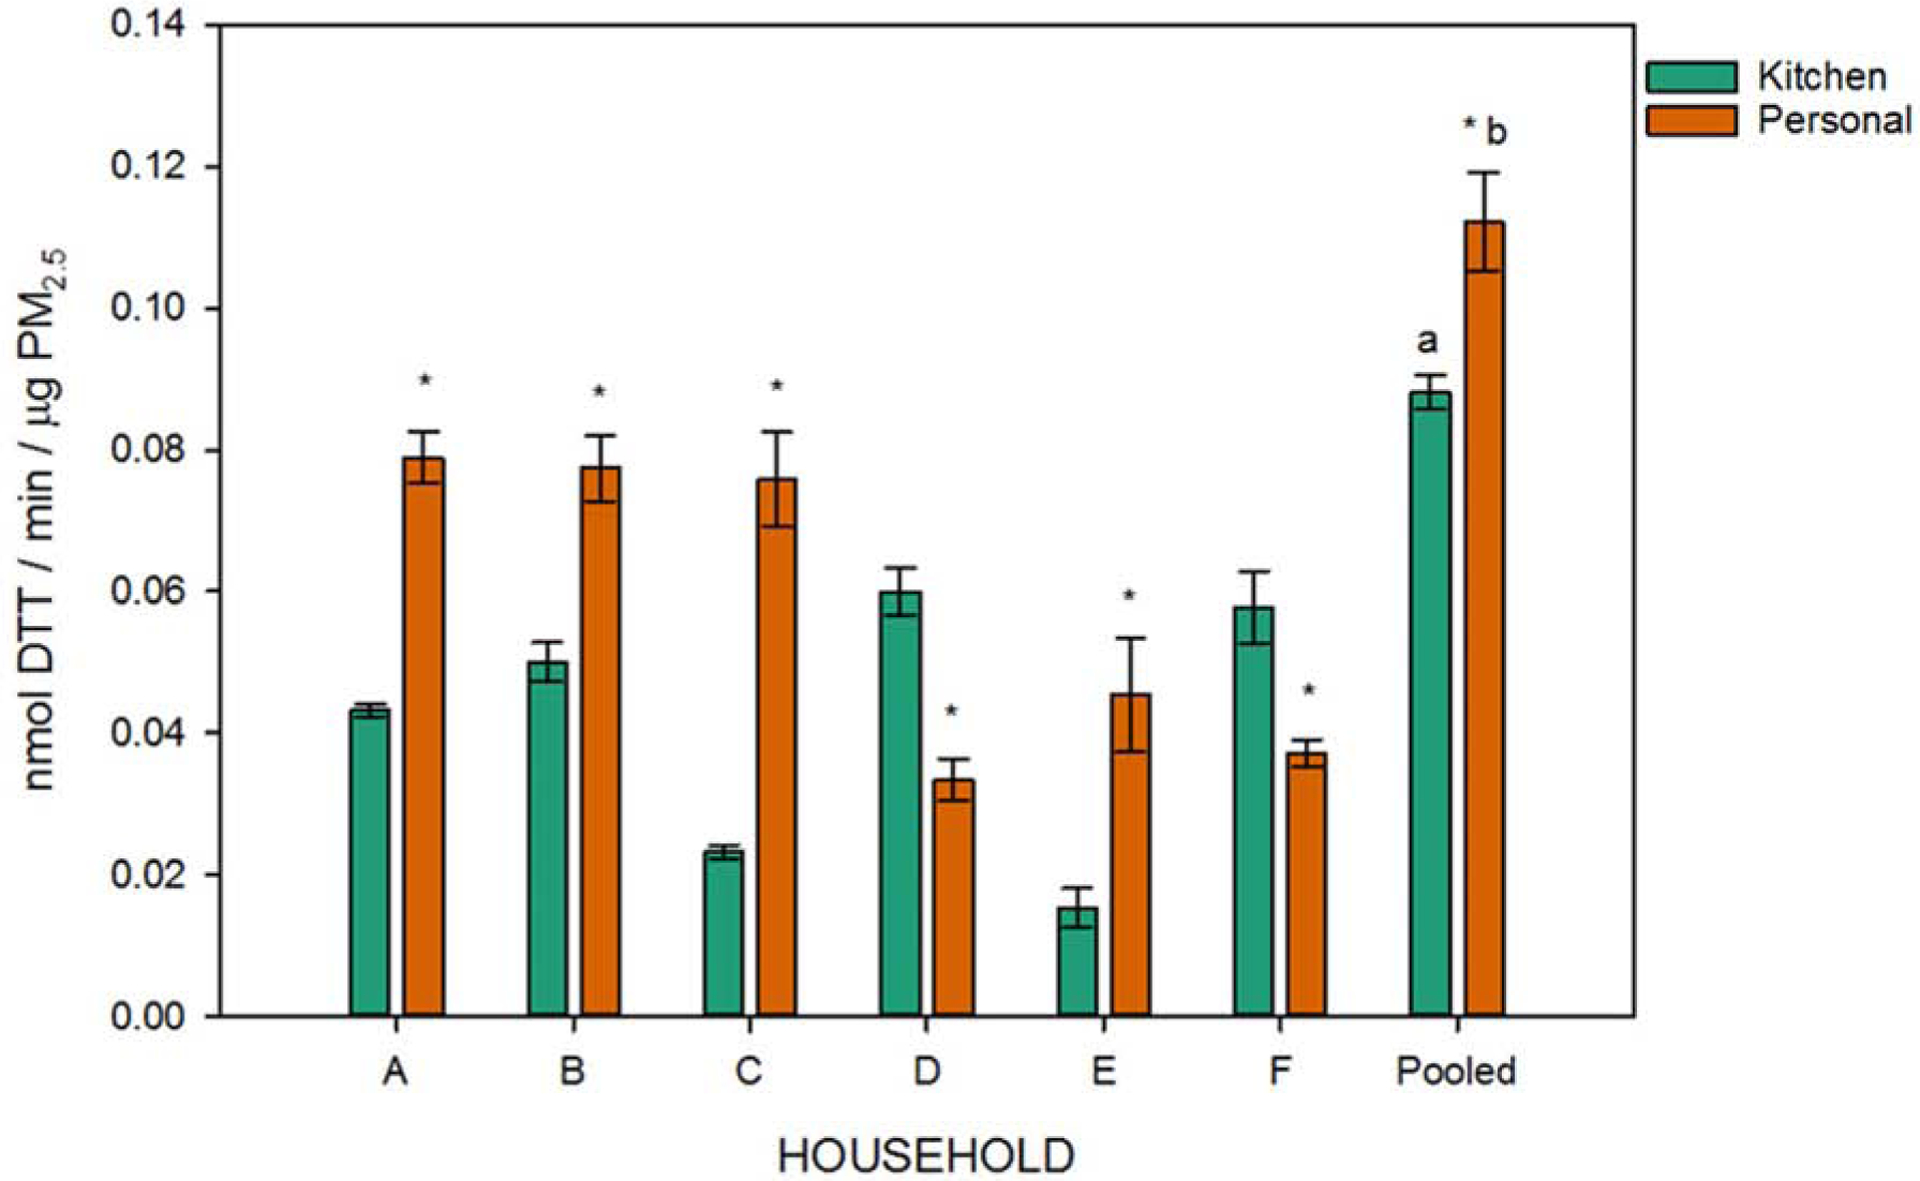
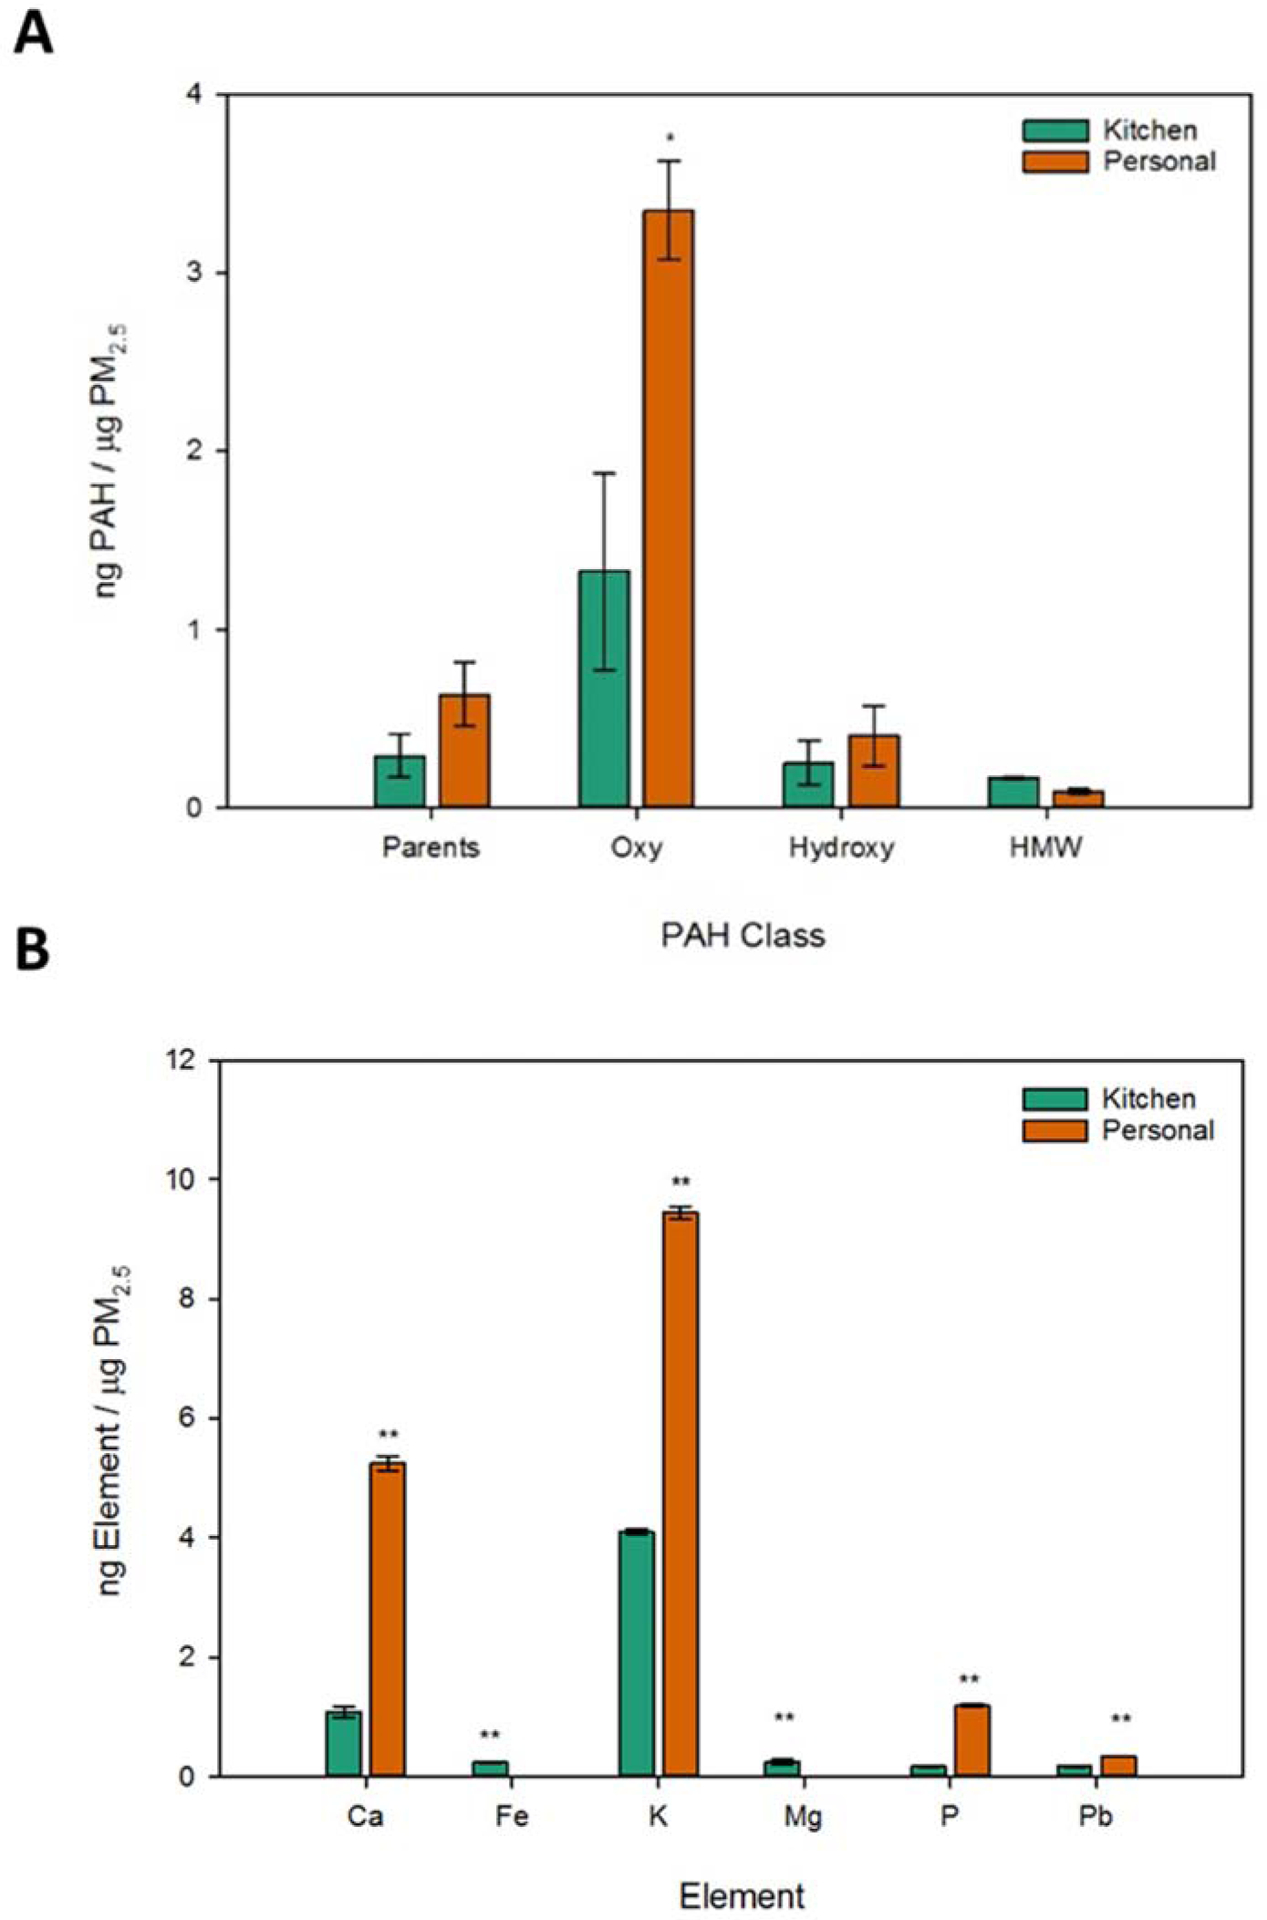
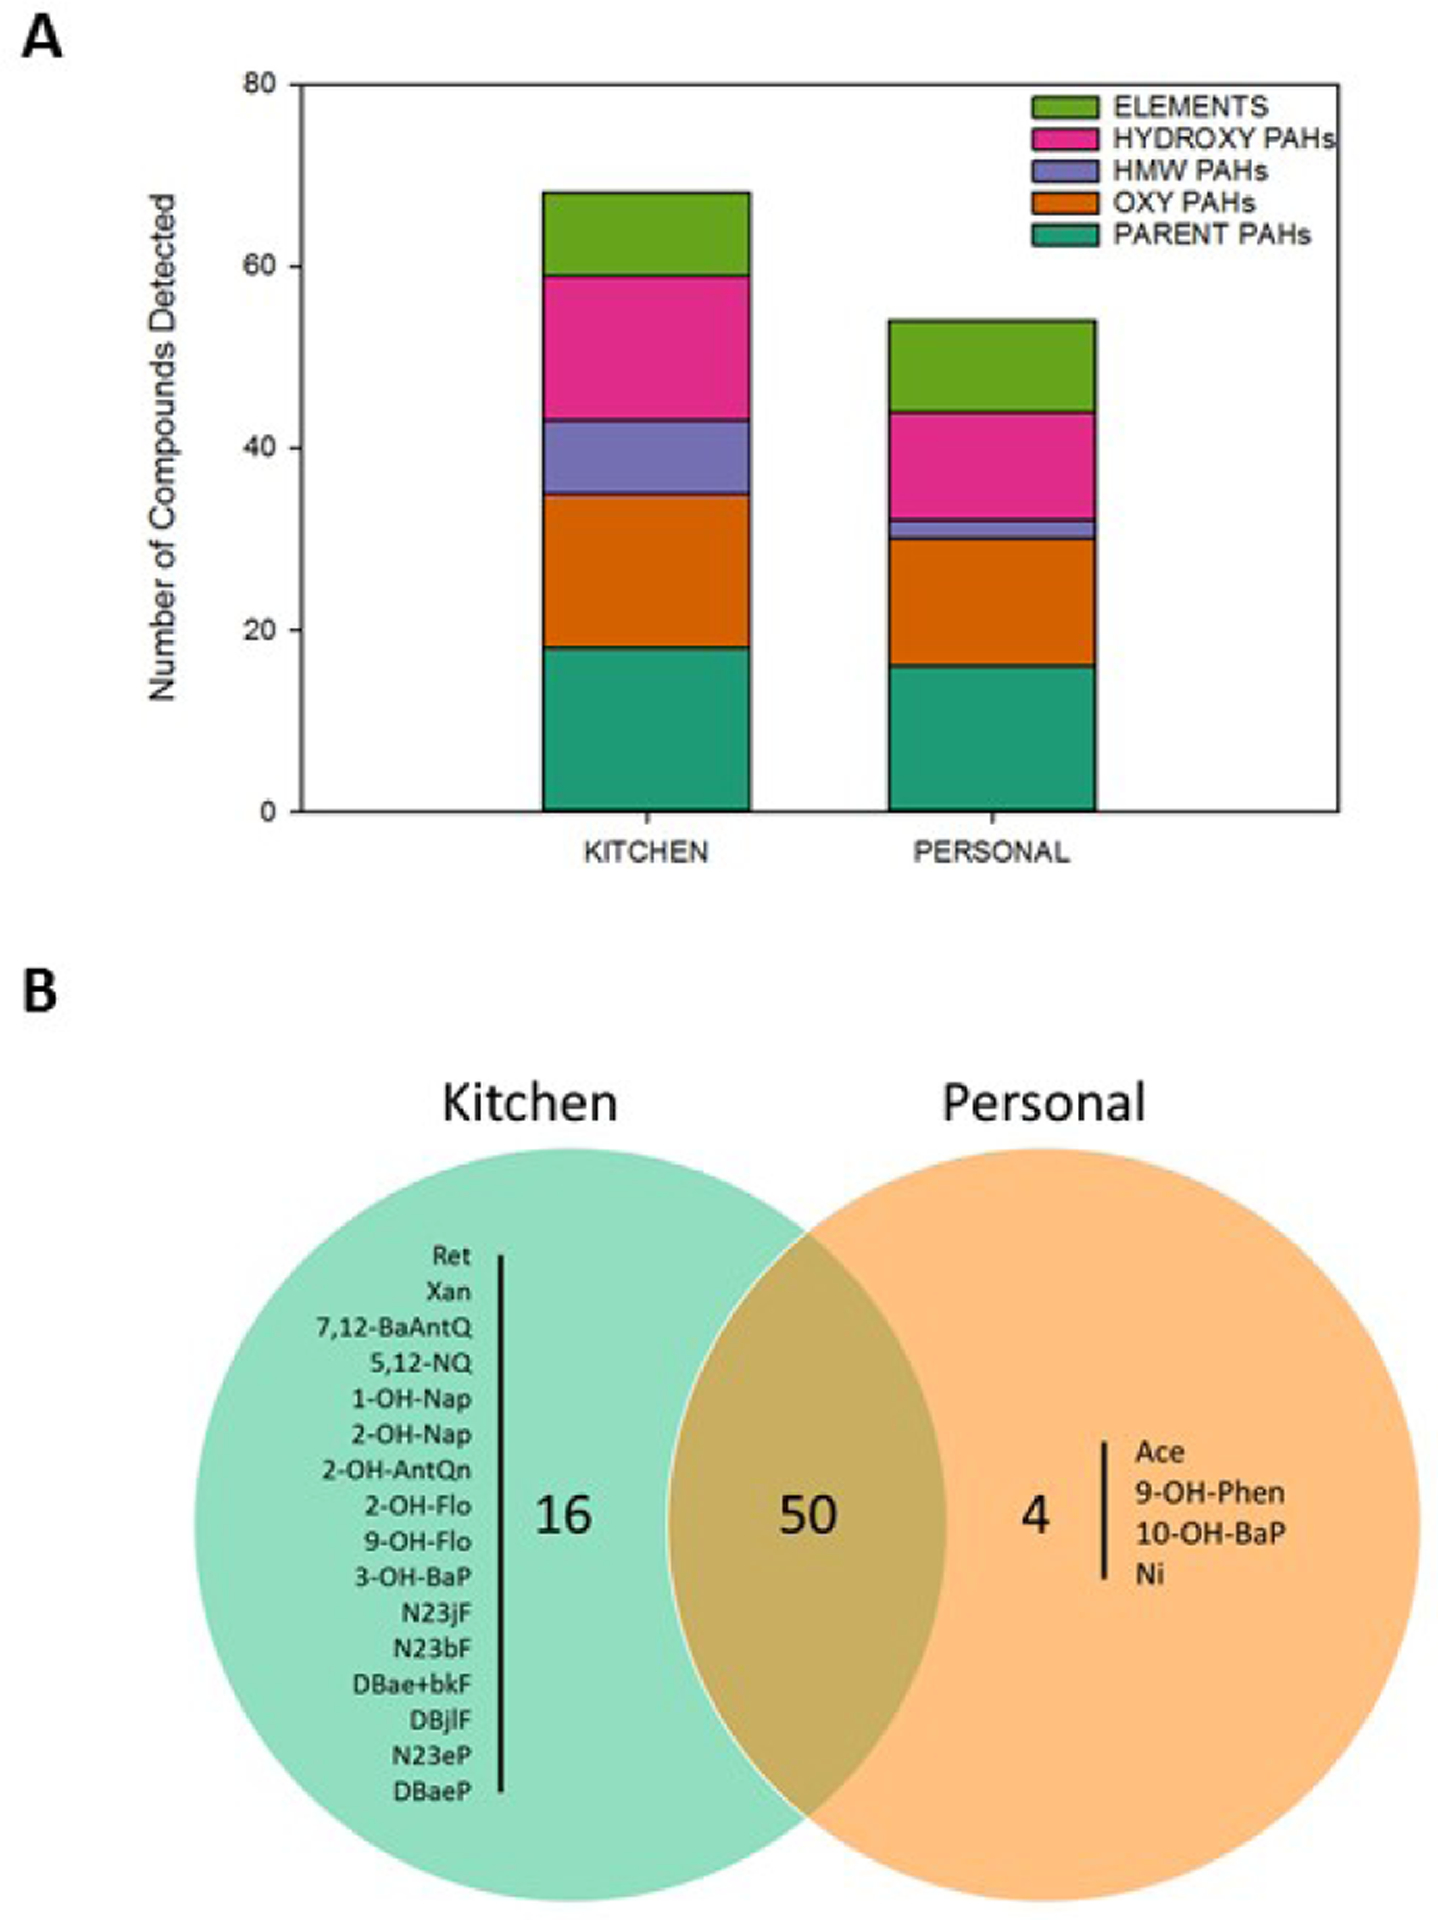
There is limited understanding of adverse health effect associations with chemical constituents of fine particulate matter (PM2.5) as well as the underlying mechanisms. We outlined a workflow to assess metrics, beyond concentration, using household and personal PM2.5 filter samples collected in India as a proof of concept for future large-scale studies. Oxidative potential, chemical composition (polycyclic aromatic hydrocarbons and elements), and bioactivity (developmental exposures in zebrafish) were determined. Significant differences were observed in all metrics between personal and household PM2.5 samples. This work established methods to characterize multiple metrics of PM2.5 to ultimately support the identification of more health-relevant metrics than concentration.
Keywords: Household air pollution; Indoor PM2.5; PAH diagnostic ratios; PM2.5 composition; oxidative potential; zebrafish.
Conflict of interest statement
Declaration of interests The authors declare that they have no known competing financial interests or personal relationships that could have appeared to influence the work reported in this paper. The authors declare the following financial interests/personal relationships which may be considered as potential competing interests:
Figures
Similar articles
-
Indoor and Personal PM2.5 Samples Differ in Chemical Composition and Alter Zebrafish Behavior Based on Primary Fuel Source.Environ Sci Technol. 2023 Dec 19;57(50):21260-21271. doi: 10.1021/acs.est.3c03585. Epub 2023 Dec 7. Environ Sci Technol. 2023. PMID: 38060427
-
Analysis of Personal and Home Characteristics Associated with the Elemental Composition of PM2.5 in Indoor, Outdoor, and Personal Air in the RIOPA Study.Res Rep Health Eff Inst. 2015 Dec;(185):3-40. Res Rep Health Eff Inst. 2015. PMID: 26934775
-
PM2.5 Filter Extraction Methods: Implications for Chemical and Toxicological Analyses.Environ Sci Technol. 2019 Jan 2;53(1):434-442. doi: 10.1021/acs.est.8b04308. Epub 2018 Dec 12. Environ Sci Technol. 2019. PMID: 30507171 Free PMC article.
-
A comparison of fine particulate matter (PM2.5) in vivo exposure studies incorporating chemical analysis.J Toxicol Environ Health B Crit Rev. 2022 Nov 17;25(8):422-444. doi: 10.1080/10937404.2022.2142345. Epub 2022 Nov 9. J Toxicol Environ Health B Crit Rev. 2022. PMID: 36351256 Review.
-
Indoor Exposure to Selected Air Pollutants in the Home Environment: A Systematic Review.Int J Environ Res Public Health. 2020 Dec 2;17(23):8972. doi: 10.3390/ijerph17238972. Int J Environ Res Public Health. 2020. PMID: 33276576 Free PMC article.
Cited by
-
Time-Related Alteration of Aqueous-Phase Anthracene and Phenanthrene Photoproducts in the Presence of TiO2 Nanoparticles.Environ Sci Technol. 2021 Mar 16;55(6):3727-3735. doi: 10.1021/acs.est.0c07488. Epub 2021 Mar 2. Environ Sci Technol. 2021. PMID: 33651588 Free PMC article.
-
Burn pit-related smoke causes developmental and behavioral toxicity in zebrafish: Influence of material type and emissions chemistry.Heliyon. 2024 Apr 14;10(8):e29675. doi: 10.1016/j.heliyon.2024.e29675. eCollection 2024 Apr 30. Heliyon. 2024. PMID: 38681659 Free PMC article.
-
Assessing the oxidative potential of PAHs in ambient PM2.5 using the DTT consumption assay.Environ Pollut. 2021 Sep 15;285:117411. doi: 10.1016/j.envpol.2021.117411. Epub 2021 May 19. Environ Pollut. 2021. PMID: 34051568 Free PMC article.
References
-
- Household air pollution and health https://www.who.int/news-room/fact-sheets/detail/household-air-pollution... (accessed Oct 30, 2019).
-
- Liao J; Zimmermann Jin A; Chafe ZA; Pillarisetti A; Yu T; Shan M; Yang X; Li H; Liu G; Smith KR The Impact of Household Cooking and Heating with Solid Fuels on Ambient PM 2.5 in Peri-Urban Beijing. Atmos. Environ 2017, 165, 62–72. 10.1016/j.atmosenv.2017.05.053. - DOI
Grants and funding
LinkOut - more resources
Full Text Sources