

What are the underlying transmission patterns of COVID-19 outbreak? An age-specific social contact characterization
- PMID: 32313879
- PMCID: PMC7165295
- DOI: 10.1016/j.eclinm.2020.100354
What are the underlying transmission patterns of COVID-19 outbreak? An age-specific social contact characterization
Abstract
Background: COVID-19 has spread to 6 continents. Now is opportune to gain a deeper understanding of what may have happened. The findings can help inform mitigation strategies in the disease-affected countries.
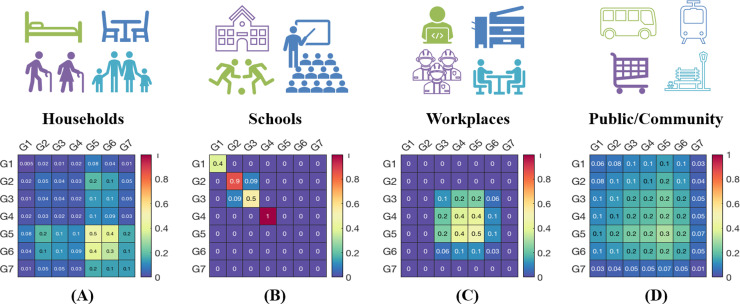
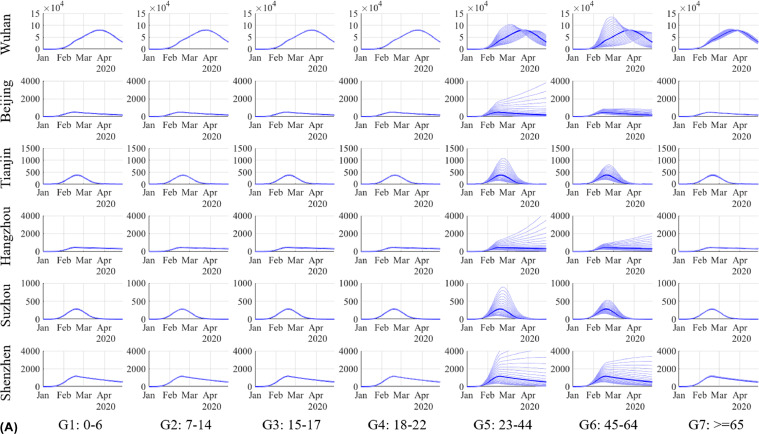
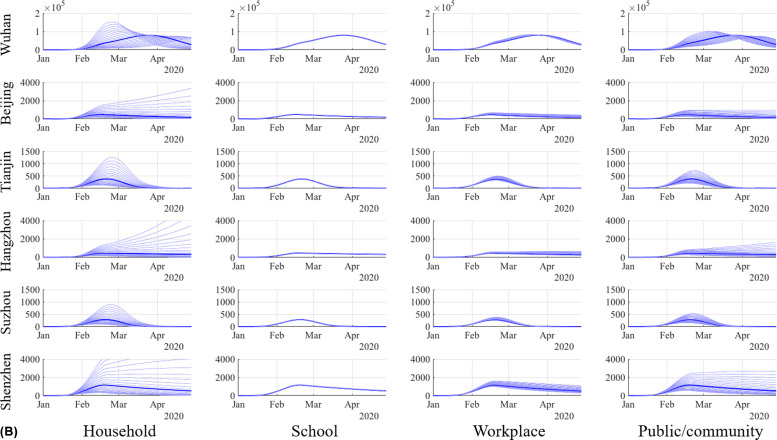
Methods: In this work, we examine an essential factor that characterizes the disease transmission patterns: the interactions among people. We develop a computational model to reveal the interactions in terms of the social contact patterns among the population of different age-groups. We divide a city's population into seven age-groups: 0-6 years old (children); 7-14 (primary and junior high school students); 15-17 (high school students); 18-22 (university students); 23-44 (young/middle-aged people); 45-64 years old (middle-aged/elderly people); and 65 or above (elderly people). We consider four representative settings of social contacts that may cause the disease spread: (1) individual households; (2) schools, including primary/high schools as well as colleges and universities; (3) various physical workplaces; and (4) public places and communities where people can gather, such as stadiums, markets, squares, and organized tours. A contact matrix is computed to describe the contact intensity between different age-groups in each of the four settings. By integrating the four contact matrices with the next-generation matrix, we quantitatively characterize the underlying transmission patterns of COVID-19 among different populations.
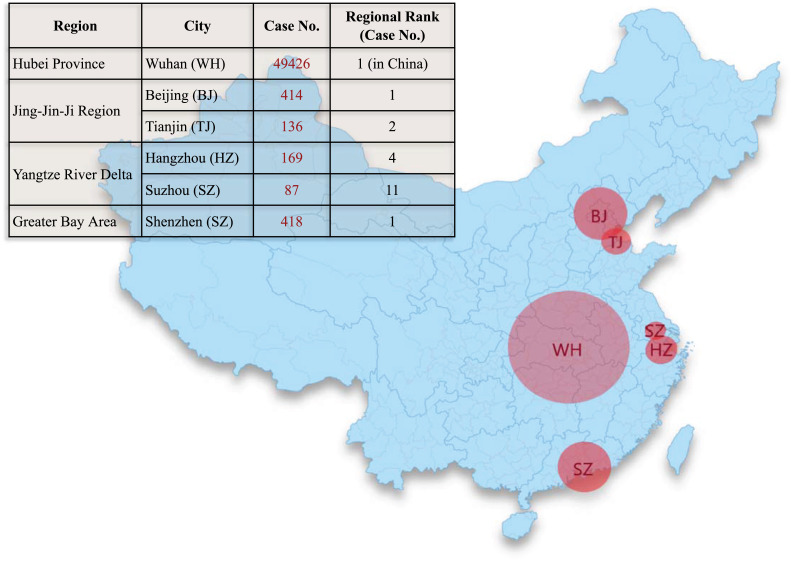
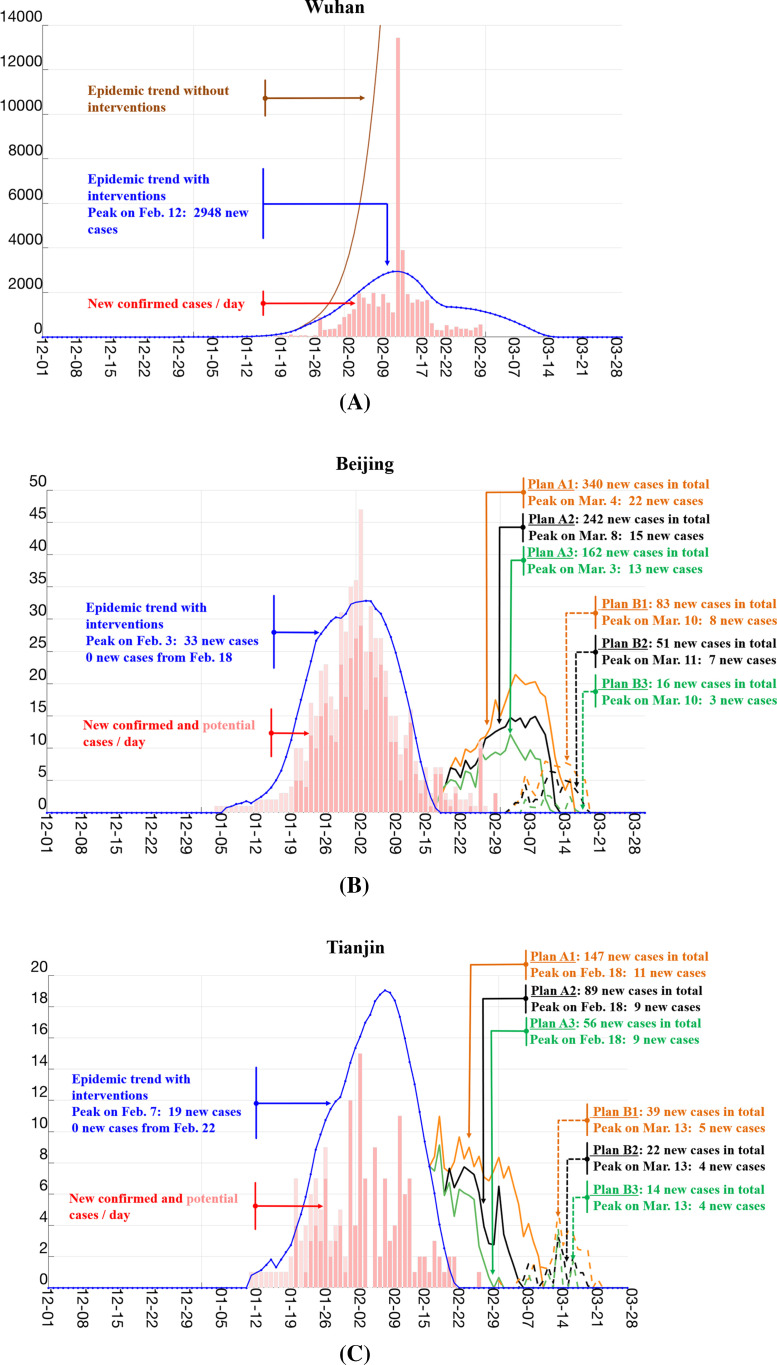
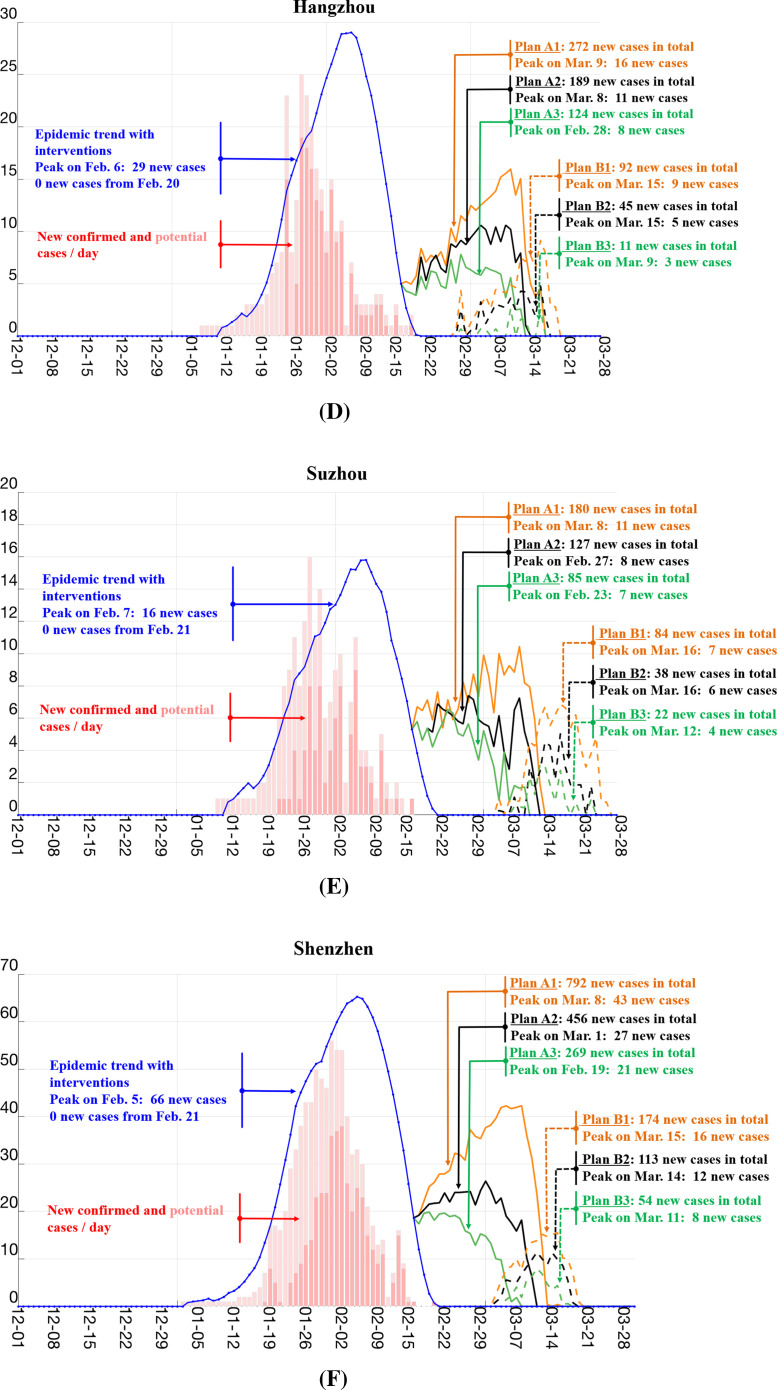
Findings: We focus our study on 6 representative cities in China: Wuhan, the epicenter of COVID-19 in China, together with Beijing, Tianjin, Hangzhou, Suzhou, and Shenzhen, which are five major cities from three key economic zones. The results show that the social contact-based analysis can readily explain the underlying disease transmission patterns as well as the associated risks (including both confirmed and unconfirmed cases). In Wuhan, the age-groups involving relatively intensive contacts in households and public/communities are dispersedly distributed. This can explain why the transmission of COVID-19 in the early stage mainly took place in public places and families in Wuhan. We estimate that Feb. 11, 2020 was the date with the highest transmission risk in Wuhan, which is consistent with the actual peak period of the reported case number (Feb. 4-14). Moreover, the surge in the number of new cases reported on Feb. 12 and 13 in Wuhan can readily be captured using our model, showing its ability in forecasting the potential/unconfirmed cases. We further estimate the disease transmission risks associated with different work resumption plans in these cities after the outbreak. The estimation results are consistent with the actual situations in the cities with relatively lenient policies, such as Beijing, and those with strict policies, such as Shenzhen.
Interpretation: With an in-depth characterization of age-specific social contact-based transmission, the retrospective and prospective situations of the disease outbreak, including the past and future transmission risks, the effectiveness of different interventions, and the disease transmission risks of restoring normal social activities, are computationally analyzed and reasonably explained. The conclusions drawn from the study not only provide a comprehensive explanation of the underlying COVID-19 transmission patterns in China, but more importantly, offer the social contact-based risk analysis methods that can readily be applied to guide intervention planning and operational responses in other countries, so that the impact of COVID-19 pandemic can be strategically mitigated.
Funding: General Research Fund of the Hong Kong Research Grants Council; Key Project Grants of the National Natural Science Foundation of China.
Keywords: Age-specific social contact patterns; COVID-19; Retrospective and prospective analysis; Underlying transmission patterns.
© 2020 The Author(s).
Conflict of interest statement
We declare no competing interests.
Figures
References
-
- Johns Hopkins Coronavirus Resource Center. https://coronavirus.jhu.edu/map.html.
-
- World Health Organization, Coronavirus disease 2019 (COVID-19) situation69. March 29 (2020). https://www.who.int/docs/default-source/coronaviruse/situation-reports/2....
-
- Strategy and Policy Working Group for NCIP Epidemic Response Chinese center for disease control and prevention, urgent research agenda for the novel coronavirus epidemic: transmission and non-pharmaceutical mitigation strategies. Chin J Epidemiol. 2020;41(2):135–138. http://chinaepi.icdc.cn/zhlxbx/ch/reader/create_pdf.aspx?file_no=001&fla... [in Chinese] - PubMed
-
- World Health Organization, Report of the WHO-china joint mission on coronavirus disease 2019 (COVID-19). February 28 (2020). https://reliefweb.int/sites/reliefweb.int/files/resources/who-china-join...
LinkOut - more resources
Full Text Sources
Miscellaneous
