

Chemical-induced craniofacial anomalies caused by disruption of neural crest cell development in a zebrafish model
- PMID: 32314458
- PMCID: PMC7384000
- DOI: 10.1002/dvdy.179
Chemical-induced craniofacial anomalies caused by disruption of neural crest cell development in a zebrafish model
Abstract
Background: Craniofacial anomalies are among the most frequent birth defects worldwide, and are thought to be caused by gene-environment interactions. Genetically manipulated zebrafish simulate human diseases and provide great advantages for investigating the etiology and pathology of craniofacial anomalies. Although substantial advances have been made in understanding genetic factors causing craniofacial disorders, limited information about the etiology by which environmental factors, such as teratogens, induce craniofacial anomalies is available in zebrafish.
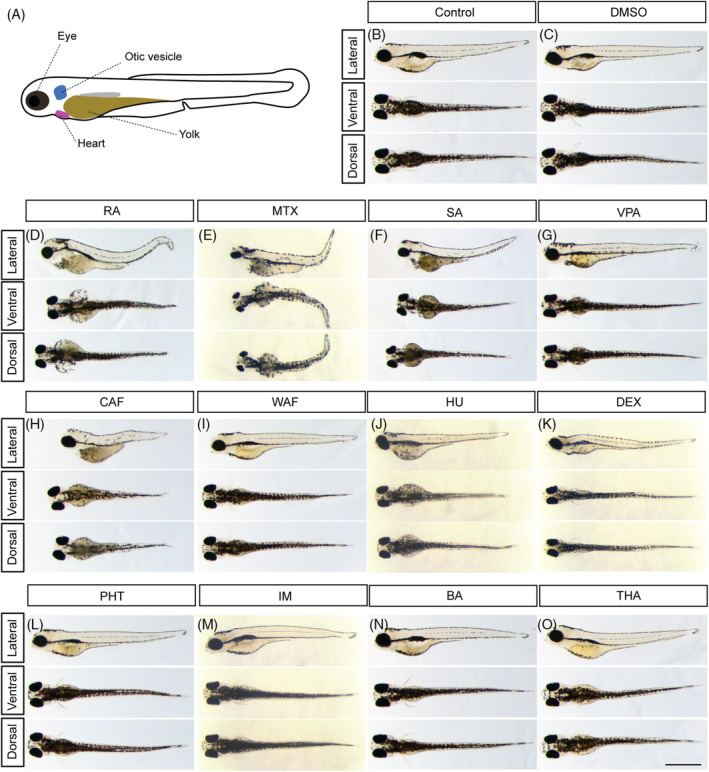
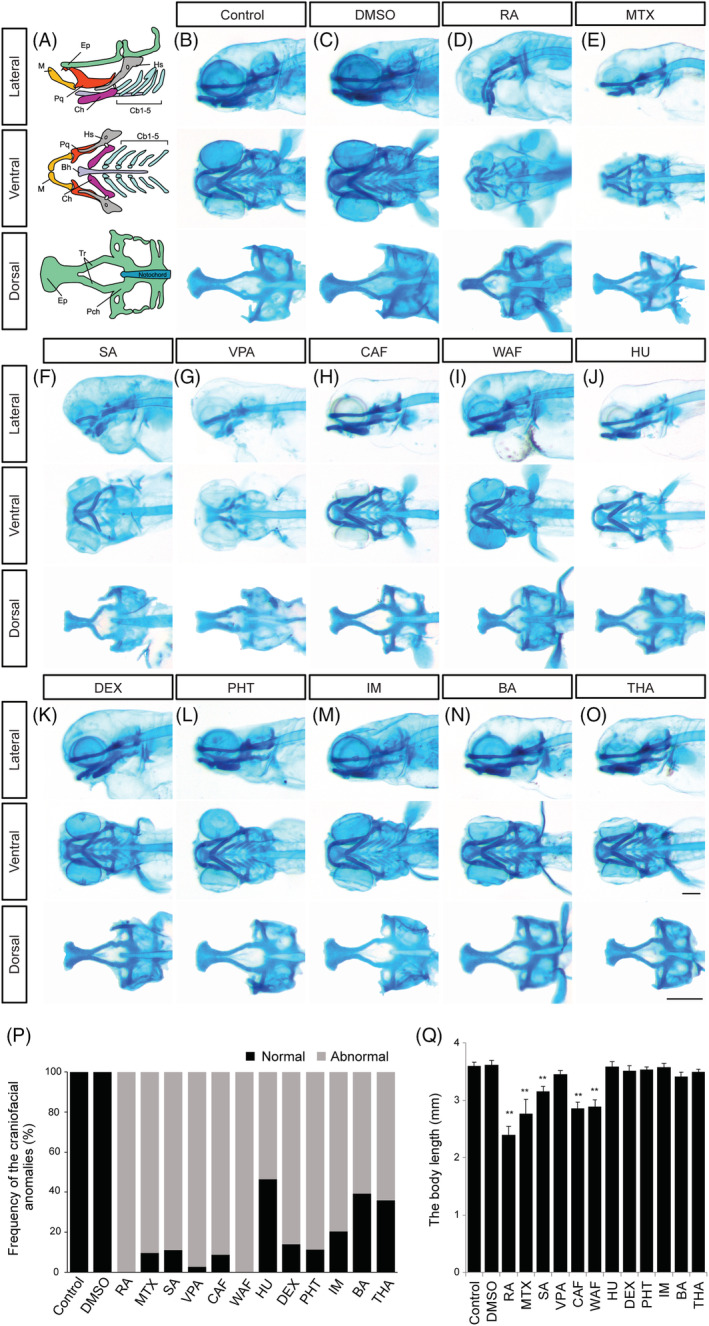
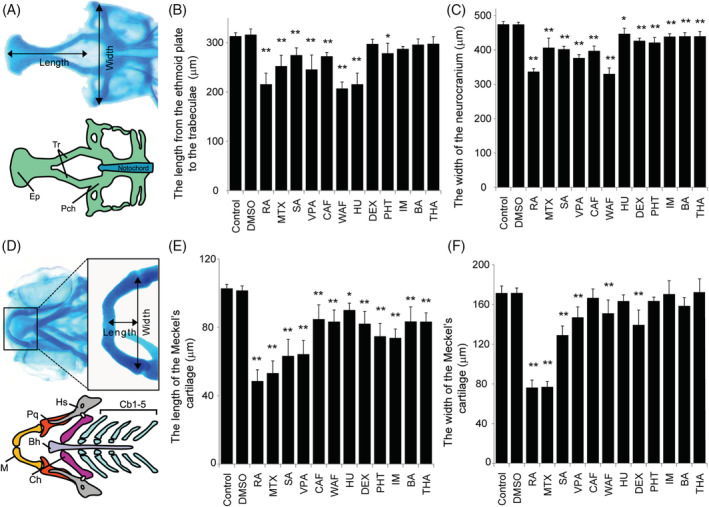
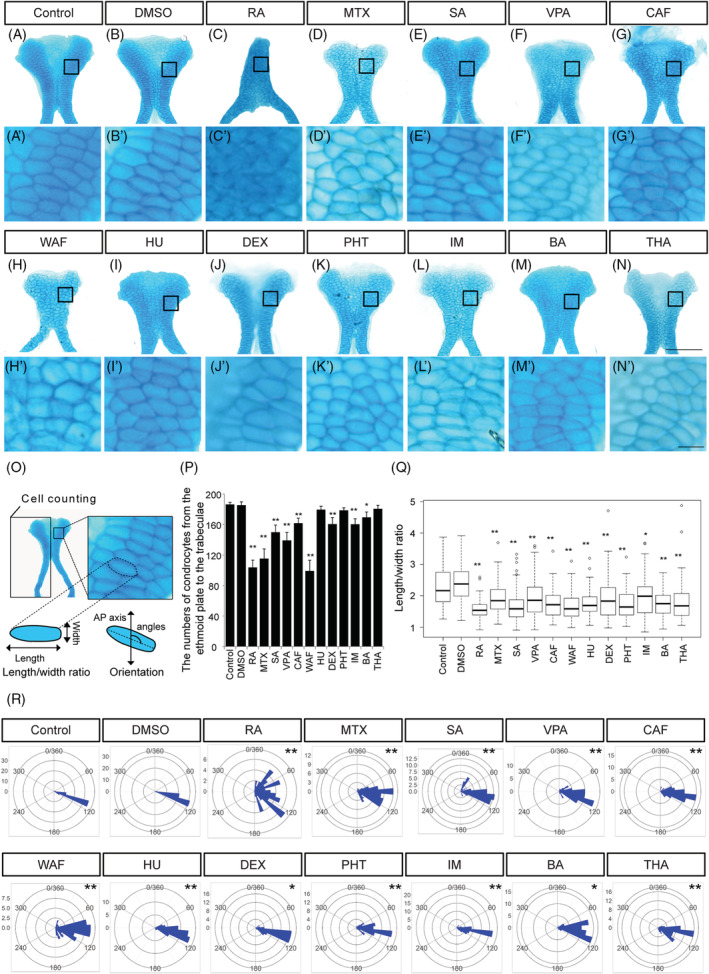
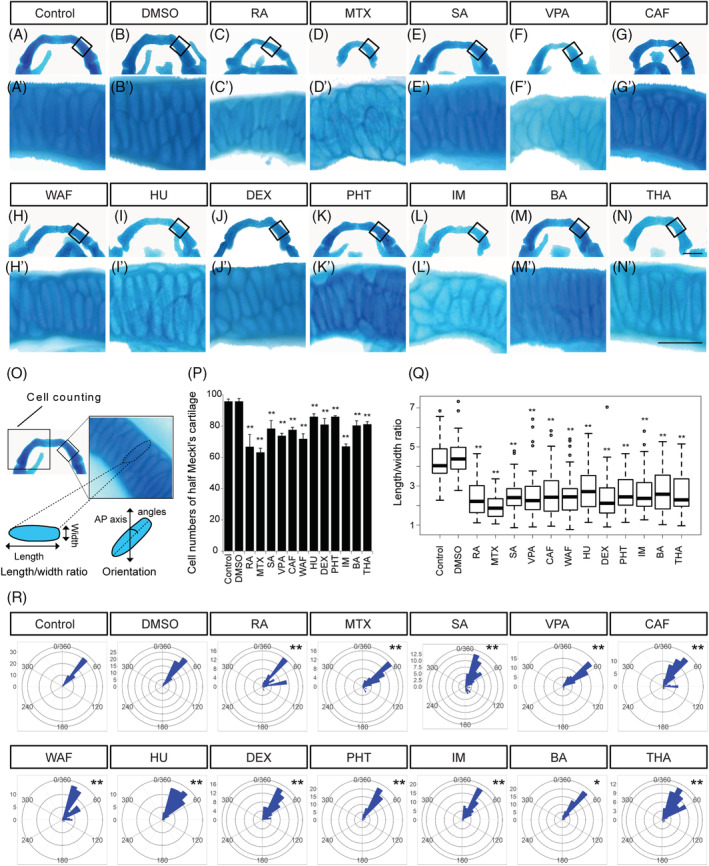
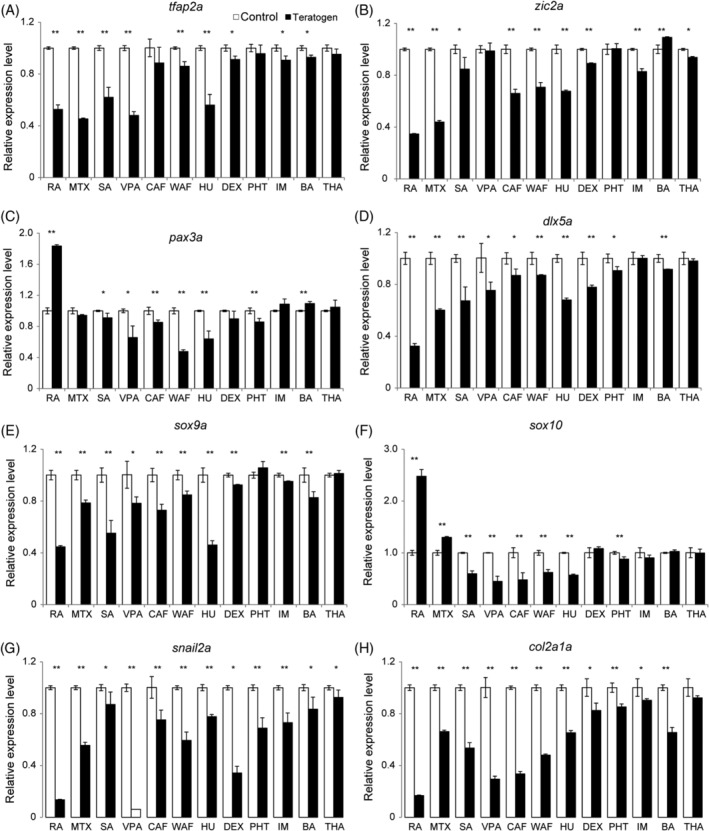
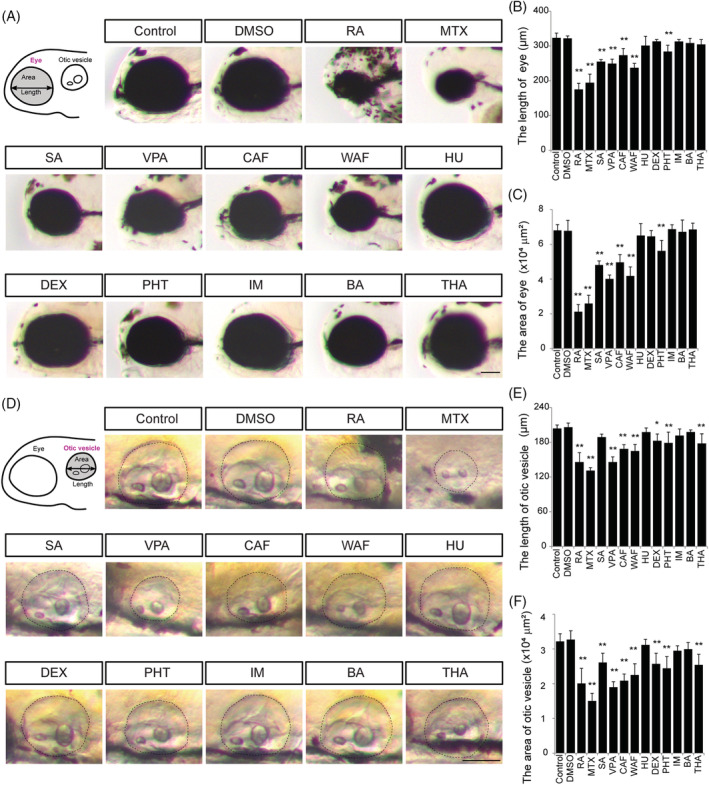
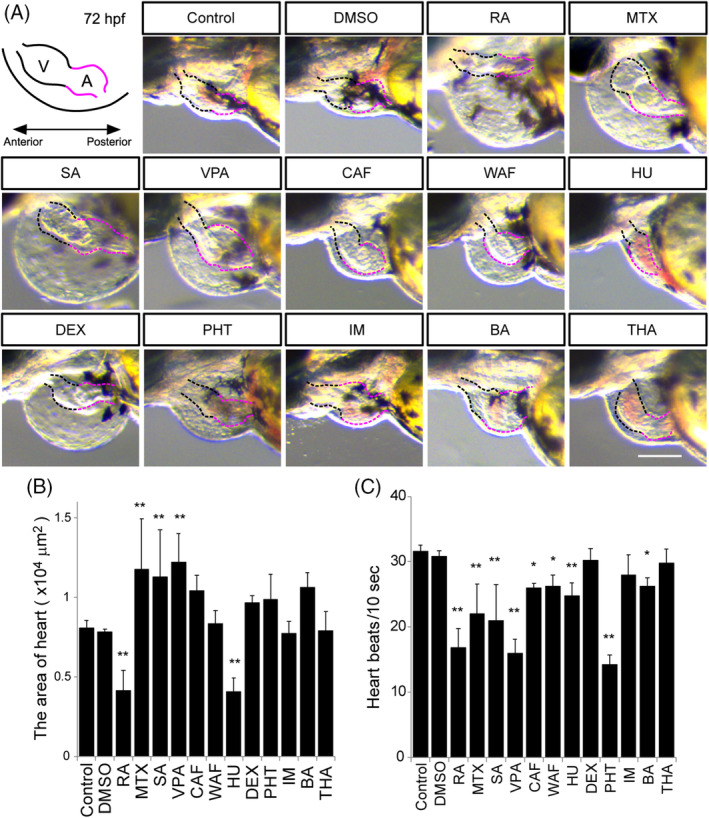
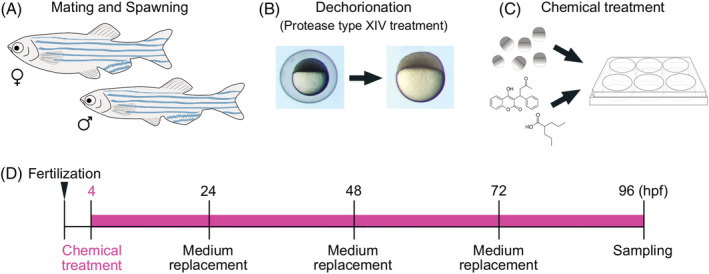
Results: Zebrafish embryos displayed craniofacial malformations after teratogen treatments. Further observations revealed characteristic disruption of chondrocyte number, shape and stacking. These findings suggested aberrant development of cranial neural crest (CNC) cells, which was confirmed by gene expression analysis of the CNC. Notably, these observations suggested conserved etiological pathways between zebrafish and mammals including human. Furthermore, several of these chemicals caused malformations of the eyes, otic vesicle, and/or heart, representing a phenocopy of neurocristopathy, and these chemicals altered the expression levels of the responsible genes.
Conclusions: Our results demonstrate that chemical-induced craniofacial malformation is caused by aberrant development of neural crest. This study indicates that zebrafish provide a platform for investigating contributions of environmental factors as causative agents of craniofacial anomalies and neurocristopathy.
Keywords: disease model; environmental factors; neural crest cells; neurocristopathy; teratogen; zebrafish.
© 2020 The Authors. Developmental Dynamics published by Wiley Periodicals, Inc. on behalf of American Association of Anatomists.
Figures
Similar articles
-
Tgfbeta3 regulation of chondrogenesis and osteogenesis in zebrafish is mediated through formation and survival of a subpopulation of the cranial neural crest.Mech Dev. 2010 Jul-Aug;127(7-8):329-44. doi: 10.1016/j.mod.2010.04.003. Epub 2010 Apr 18. Mech Dev. 2010. PMID: 20406684
-
Thyroid hormone and retinoic acid interact to regulate zebrafish craniofacial neural crest development.Dev Biol. 2013 Jan 15;373(2):300-9. doi: 10.1016/j.ydbio.2012.11.005. Epub 2012 Nov 17. Dev Biol. 2013. PMID: 23165295 Free PMC article.
-
Differences in neural crest sensitivity to ethanol account for the infrequency of anterior segment defects in the eye compared with craniofacial anomalies in a zebrafish model of fetal alcohol syndrome.Birth Defects Res. 2017 Sep 1;109(15):1212-1227. doi: 10.1002/bdr2.1069. Epub 2017 Jul 6. Birth Defects Res. 2017. PMID: 28681995 Free PMC article.
-
Molecular dissection of craniofacial development using zebrafish.Crit Rev Oral Biol Med. 2002;13(4):308-22. doi: 10.1177/154411130201300402. Crit Rev Oral Biol Med. 2002. PMID: 12191958 Review.
-
Face off against ROS: Tcof1/Treacle safeguards neuroepithelial cells and progenitor neural crest cells from oxidative stress during craniofacial development.Dev Growth Differ. 2016 Sep;58(7):577-85. doi: 10.1111/dgd.12305. Epub 2016 Aug 2. Dev Growth Differ. 2016. PMID: 27481486 Free PMC article. Review.
Cited by
-
Pharmacological Inhibition of the Spliceosome SF3b Complex by Pladienolide-B Elicits Craniofacial Developmental Defects in Mouse and Zebrafish.Birth Defects Res. 2024 Nov;116(11):e2404. doi: 10.1002/bdr2.2404. Birth Defects Res. 2024. PMID: 39494782 Free PMC article.
-
Identification of an adverse outcome pathway (AOP) for chemical-induced craniofacial anomalies using the transgenic zebrafish model.Toxicol Sci. 2023 Oct 30;196(1):38-51. doi: 10.1093/toxsci/kfad078. Toxicol Sci. 2023. PMID: 37531284 Free PMC article.
-
Chemical-Induced Cleft Palate Is Caused and Rescued by Pharmacological Modulation of the Canonical Wnt Signaling Pathway in a Zebrafish Model.Front Cell Dev Biol. 2020 Dec 14;8:592967. doi: 10.3389/fcell.2020.592967. eCollection 2020. Front Cell Dev Biol. 2020. PMID: 33381503 Free PMC article.
-
The bone Gla protein osteocalcin is expressed in cranial neural crest cells.BMC Res Notes. 2024 Nov 5;17(1):329. doi: 10.1186/s13104-024-06990-7. BMC Res Notes. 2024. PMID: 39501347 Free PMC article.
-
Environmental mechanisms of orofacial clefts.Birth Defects Res. 2020 Nov;112(19):1660-1698. doi: 10.1002/bdr2.1830. Epub 2020 Oct 30. Birth Defects Res. 2020. PMID: 33125192 Free PMC article. Review.
References
-
- Hall BK. The Neural Crest and Neural Crest Cells in Vertebrate Development and Evolution. New York: Springer; 2009.
-
- Etchevers HC, Dupin E, Le Douarin NM. The diverse neural crest: from embryology to human pathology. Development. 2019;146:dev169821. - PubMed
MeSH terms
Substances
LinkOut - more resources
Full Text Sources
Medical
Molecular Biology Databases
Research Materials
