. 2020 May 20;12(20):23595-23605.
doi: 10.1021/acsami.0c03963. Epub 2020 May 5.

Formation of a 2D Meta-stable Oxide by Differential Oxidation of AgCu Alloys

Affiliations

Formation of a 2D Meta-stable Oxide by Differential Oxidation of AgCu Alloys

Kevin Schweinar et al. ACS Appl Mater Interfaces. .

Abstract

Metal alloy catalysts can develop complex surface structures when exposed to reactive atmospheres. The structures of the resulting surfaces have intricate relationships with a myriad of factors, such as the affinity of the individual alloying elements to the components of the gas atmosphere and the bond strengths of the multitude of low-energy surface compounds that can be formed. Identifying the atomic structure of such surfaces is a prerequisite for establishing structure-property relationships, as well as for modeling such catalysts in ab initio calculations. Here, we show that an alloy, consisting of an oxophilic metal (Cu) diluted into a noble metal (Ag), forms a meta-stable two-dimensional oxide monolayer, when the alloy is subjected to oxidative reaction conditions. The presence of this oxide is correlated with selectivity in the corresponding test reaction of ethylene epoxidation. In the present study, using a combination of in situ, ex situ, and theoretical methods (NAP-XPS, XPEEM, LEED, and DFT), we determine the structure to be a two-dimensional analogue of Cu2O, resembling a single lattice plane of Cu2O. The overlayer holds a pseudo-epitaxial relationship with the underlying noble metal. Spectroscopic evidence shows that the oxide's electronic structure is qualitatively distinct from its three-dimensional counterpart, and because of weak electronic coupling with the underlying noble metal, it exhibits metallic properties. These findings provide precise details of this peculiar structure and valuable insights into how alloying can enhance catalytic properties.

Keywords: 2-dimensional material; XPS; dilute alloy; meta-stable; oxide monolayer.


Conflict of interest statement

The authors declare no competing financial interest.

Figures

Figure 1
Figure 1
Rendition of the CuxOy structure formed on AgCu in oxidizing environments.
Figure 2
Figure 2
ESEM images of (A) a reduced AgCu foil (0.5 at. % Cu) and (B) the same foil while heated in 0.3 mbar ethylene and oxygen at 300 °C. (C) In situ NAP-XPS valence spectra (hν = 150 eV) measured as a time series under epoxidation conditions (time step = 50 min, 0.3 mbar, 1:1 O2/C2H4, 300 C). (D) Comparison of a difference spectrum generated (see Supporting Information for details) with a reference spectrum of Cu2O. (E) Comparison of several in situ measurements, using a Phoibos NAP-150 analyzer (i–iii) with a measurement performed in ultra-high-vacuum, using an XPEEM analyzer (iv). Spectra i and ii are measured in 0.5 mbar of a 1:1 mixture of ethylene and oxygen. Spectrum (iii) is measured in 0.5 mbar of a dilute–O2 mixture containing 1:50 mixture of oxygen to ethylene. Spectrum (iv) is measured on a AgCu(111) single crystal at 300 °C in 1 × 10⁻⁵ mbar O2.
Figure 3
Figure 3
(a) LEEM image showing the coexistence of Cu2O (A) and CuxOy (B) on a polycrystalline AgCu sample (Ekin = 4.8 eV). (b) Valence band spectra (hν = 170) of regions A and B. (c,d) Spatial distributions of Cu2O and CuxOy valence spectra, as determined from a XPEEM image stack.
Figure 4
Figure 4
(a) LEEM image of a surface partially covered by CuxOy (region A), Ekin = 5 eV. The insets show the corresponding LEED patterns at Ekin = 42 eV. (b) Valence spectra from regions A and B in (hν = 170 eV). (c,d) Spatial distributions of AgCu and CuxOy valence spectra, as determined from a XPEEM image stack.
Figure 5
Figure 5
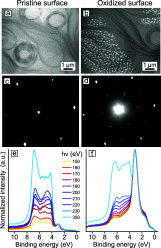
Comparison of the pristine (left column) and oxidized (right column) AgCu(111) surface. (a–c) LEEM image (Ekin = 42 eV), LEED pattern (Ekin = 42 eV), and (d–f) valence spectra at photon energies close to the Cooper minimum of Ag 4d.
Figure 6
Figure 6
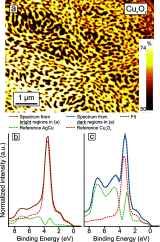
(a) Analyzed XPEEM valence band maps measured in p(O2) = 1 × 10⁻⁵ mbar and 300 °C at a photon energy of hν = 170 eV. The map shows the spatial distribution of CuxOy. The color scale represents the percentage of the reference spectrum used to fit the map. The corresponding summed spectra of the bright colored and dark colored regions in (a) are shown in (b,c). Two components (i.e., reference metallic AgCu and reference CuxOy spectrum) are required to fit the data.
Figure 7
Figure 7
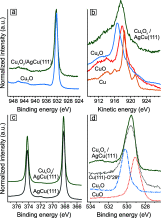
Comparison of photoemission spectra from CuxOy/AgCu(111) with reference spectra. (a) Cu 2p core level spectra. (b) Cu LMM Auger spectra. (c) Ag 3d5/2 spectra and (d) O 1s spectra.
Figure 8
Figure 8
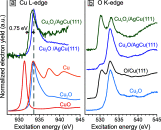
Experimental NEXAFS spectra of the Cu L-edge (a) and O K-edge (b) and reference spectra of similar structures [Cu, Cu2O, CuO, and O/Cu(111)]. The spectra containing CuxOy/AgCu(111) were measured in an oxidizing atmosphere (1 × 10⁻⁵ mbar O2, 300 °C).
Figure 9
Figure 9
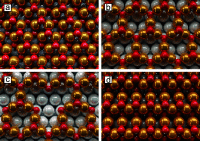
3D models of proposed structured candidates. (a) Chemisorbed oxygen (Cu4O4), (b) p2, (c) p4, and (d) CuO-1ML.
Figure 10
Figure 10
Comparison of (a) experimental valence band spectra of Cu2O (internal standard) and CuxOy measured at hν = 170 eV and (b + c) DFT calculated DOS, weighted by their photoionization cross sections at 170 eV, of Cu2O and the proposed structure candidates.
Figure 11
Figure 11
(a–c) LEEM images (Ekin = 16 eV) measured at increasing annealing temperatures in 1 × 10⁻⁵ mbar O2. (d–f) Corresponding LEED patterns from the images in (a–c). (g–i) Lattice models illustrating how the CuxOy islands nucleate, coalesce, and then decompose at increasing temperatures.
Figure 12
Figure 12
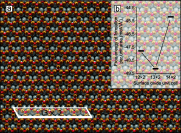
(a) Real space model of the overlayer oxide structure on the AgCu(111) surface. The (13 × 2) unit cell is indicated. (b) Calculated free energy of formation for three overlayer unit cells with varying amounts of expansion in one direction.

References

    1. Norskov J. K.; Abild-Pedersen F.; Studt F.; Bligaard T. Density Functional Theory in Surface Chemistry and Catalysis. Proc. Natl. Acad. Sci. U.S.A. 2011, 108, 937–943. 10.1073/pnas.1006652108. - DOI - PMC - PubMed
    1. Nørskov J. K.; Bligaard T.; Rossmeisl J.; Christensen C. H. Towards the Computational Design of Solid Catalysts. Nat. Chem. 2009, 1, 37–46. 10.1038/nchem.121. - DOI - PubMed
    1. Reuter K.; Stampf C.; Scheffler M.. Ab Initio Atomistic Thermodynamics and Statistical Mechanics of Surface Properties and Functions. In Handbook of Materials Modeling: Methods; Yip S., Ed.; Springer Netherlands: Dordrecht, 2005; pp 149–194.
    1. Greiner M. T.; Cao J.; Jones T. E.; Beeg S.; Skorupska K.; Carbonio E. A.; Sezen H.; Amati M.; Gregoratti L.; Willinger M.-G.; Knop-Gericke A.; Schlögl R. Phase Coexistence of Multiple Copper Oxides on AgCu Catalysts during Ethylene Epoxidation. ACS Catal. 2018, 8, 2286–2295. 10.1021/acscatal.7b04187. - DOI
    1. Linic S.; Jankowiak J.; Barteau M. A. Selectivity Driven Design of Bimetallic Ethylene Epoxidation Catalysts from First Principles. J. Catal. 2004, 224, 489–493. 10.1016/j.jcat.2004.03.007. - DOI