. 2020 Apr 21:9:e51830.
doi: 10.7554/eLife.51830.

Phenotypic plasticity as a mechanism of cave colonization and adaptation

Affiliations

Phenotypic plasticity as a mechanism of cave colonization and adaptation

Helena Bilandžija et al. Elife. .

Abstract

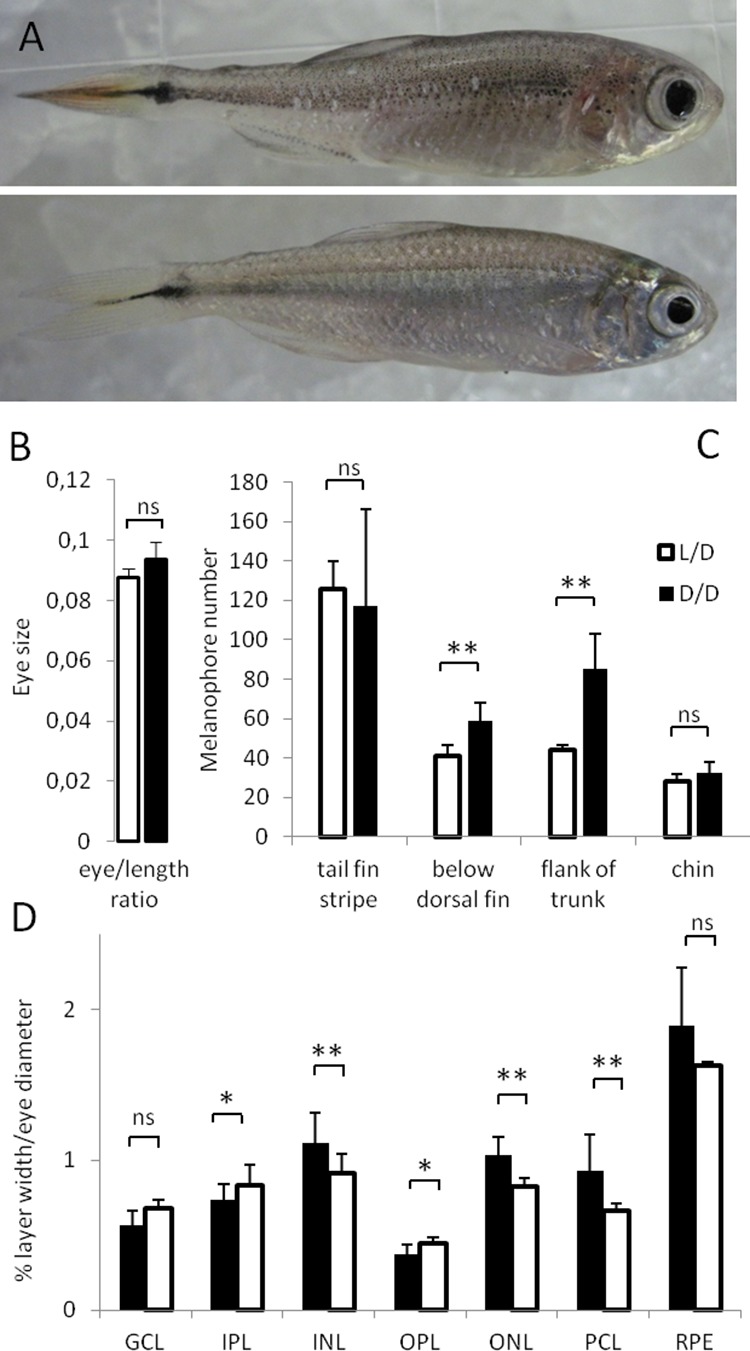
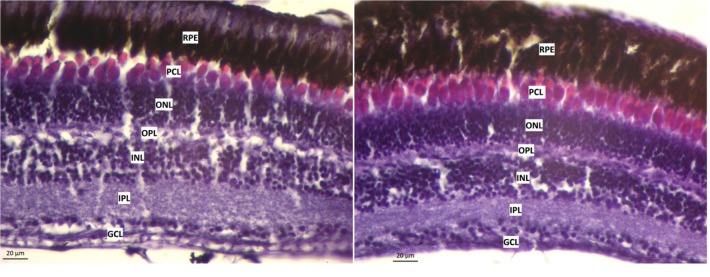
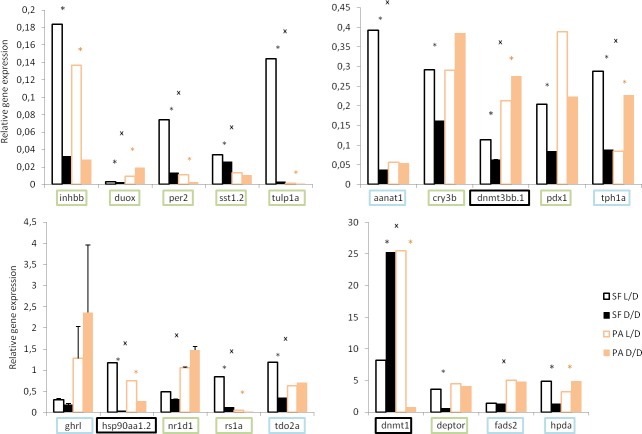
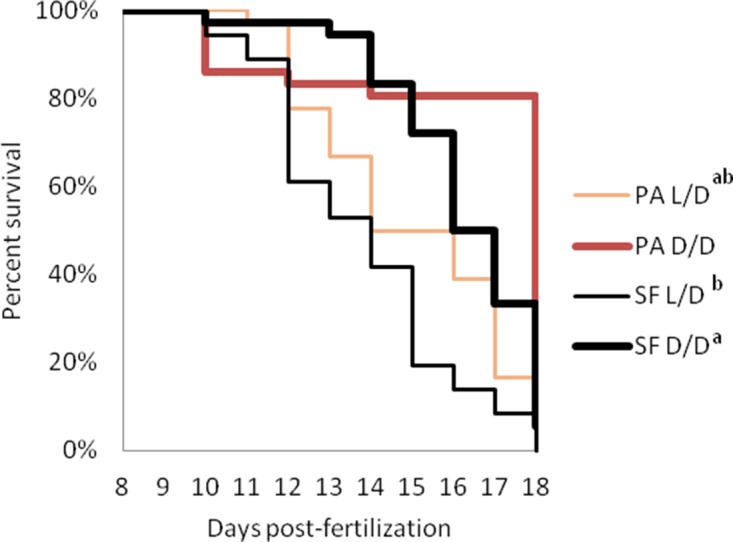
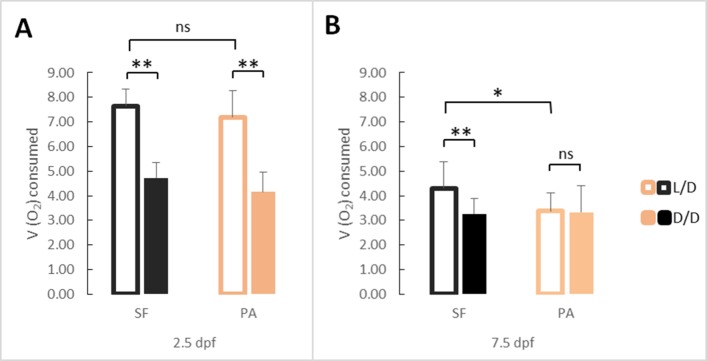
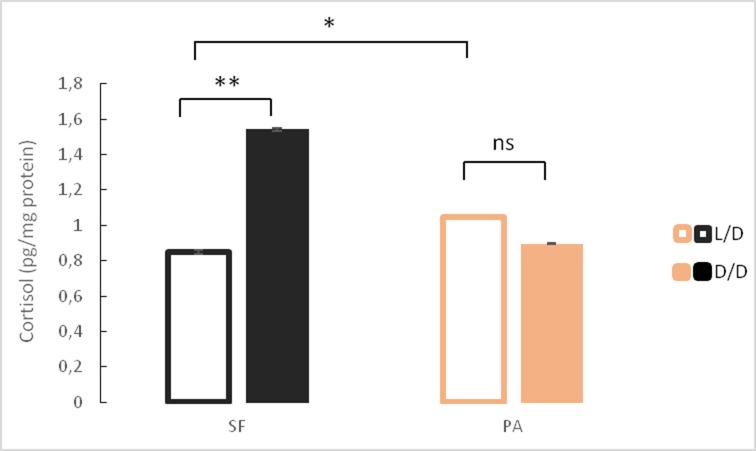
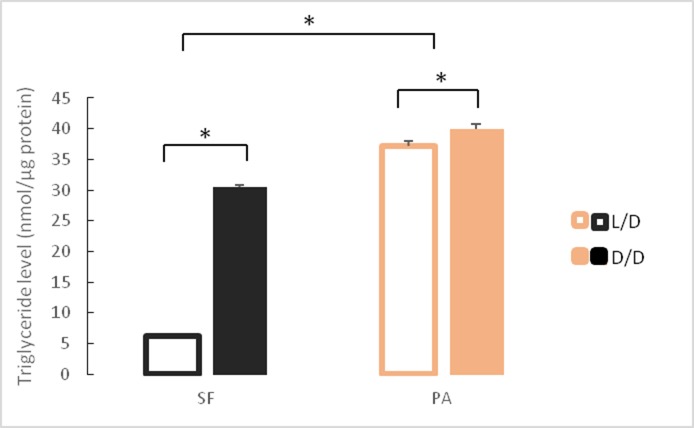
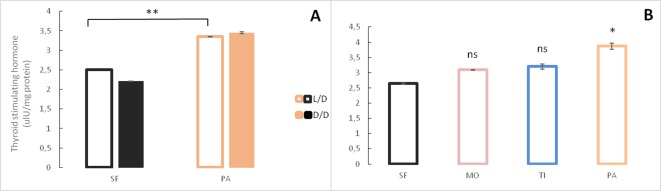
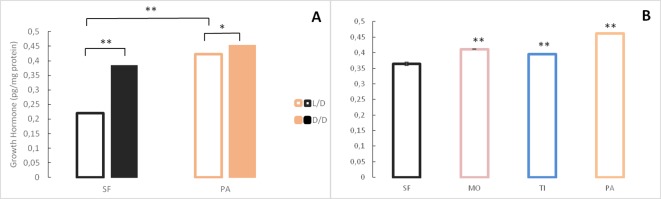
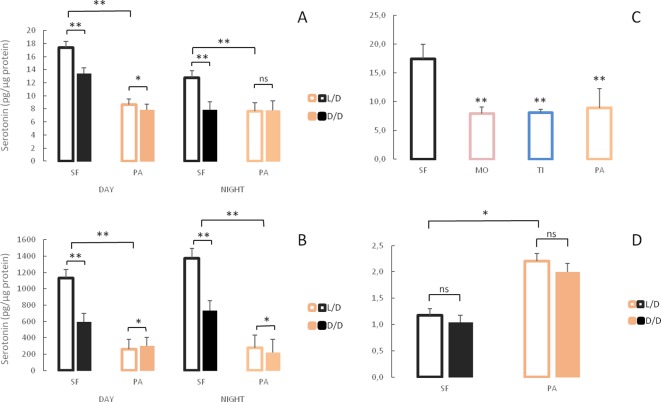
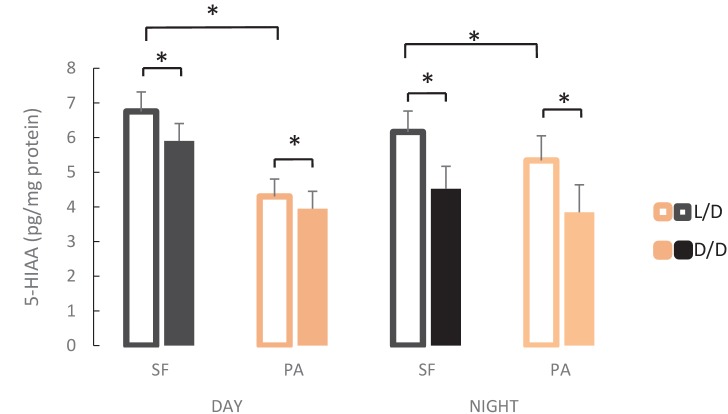
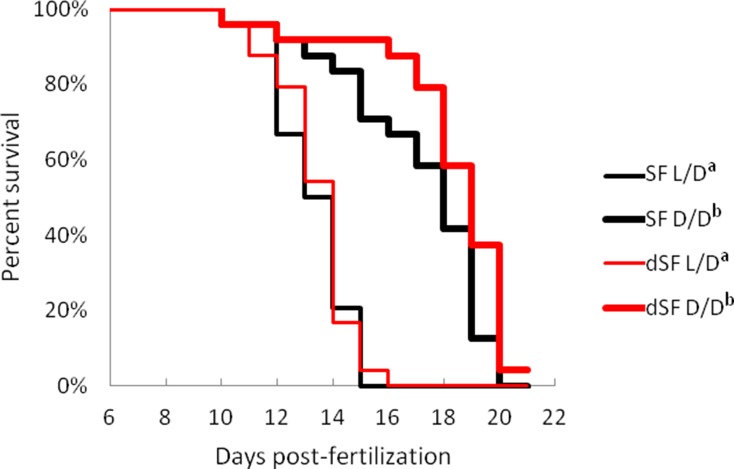
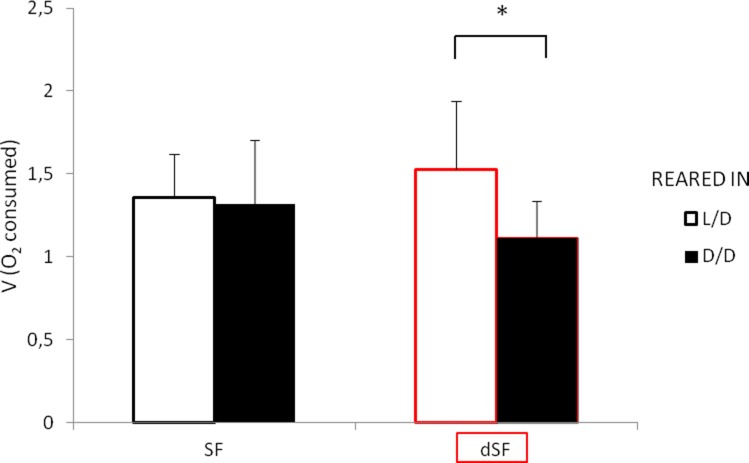
A widely accepted model for the evolution of cave animals posits colonization by surface ancestors followed by the acquisition of adaptations over many generations. However, the speed of cave adaptation in some species suggests mechanisms operating over shorter timescales. To address these mechanisms, we used Astyanax mexicanus, a teleost with ancestral surface morphs (surface fish, SF) and derived cave morphs (cavefish, CF). We exposed SF to completely dark conditions and identified numerous altered traits at both the gene expression and phenotypic levels. Remarkably, most of these alterations mimicked CF phenotypes. Our results indicate that many cave-related traits can appear within a single generation by phenotypic plasticity. In the next generation, plasticity can be further refined. The initial plastic responses are random in adaptive outcome but may determine the subsequent course of evolution. Our study suggests that phenotypic plasticity contributes to the rapid evolution of cave-related traits in A. mexicanus.

Keywords: Astyanax mexicanus; cave adaptation; cavefish; colonization; evolutionary biology; rapid evolution; total darkness.

Plain language summary

The Mexican tetra is a fish that has two forms: a surface-dwelling form, which has eyes and silvery grey appearance, and a cave-dwelling form, which is blind and has lost its pigmentation. Recent studies have shown that the cave-dwelling form evolved rapidly within the last 200,000 years from an ancestor that lived at the surface. The recent evolution of the cave-dwelling form of the tetra poses an interesting evolutionary question: how did the surface-dwelling ancestor of the tetra quickly adapt to the new and challenging environment found in the caves? ‘Phenotypic plasticity’ is a phenomenon through which a single set of genes can produce different observable traits depending on the environment. An example of phenotypic plasticity occurs in response to diet: in animals, poor diets can lead to an increase in the size of the digestive organs and to the animals eating more. To see if surface-dwelling tetras can quickly adapt to cave environments through phenotypic plasticity, Bilandžija et al. have exposed these fish to complete darkness (the major feature of the cave environment) for two years. After spending up to two years in the dark, these fish were compared to normal surface-dwelling and cave-dwelling tetras. Results revealed that surface-dwelling tetras raised in the dark exhibited traits associated with cave-dwelling tetras. These traits included changes in the activity of many genes involved in diverse processes, resistance to starvation, metabolism, and levels of hormones and molecules involved in neural signaling, which could lead to changes in behavior. However, the fish also exhibited traits, including an increase in the cells responsible for pigmentation, that would have no obvious benefit in the darkness. Even though the changes observed require no genetic mutations, they can help or hinder the fish’s survival once they occur, possibly determining subsequent evolution. Thus, a trait beneficial for surviving in the dark that appears simply through phenotypic plasticity may eventually be selected for and genetic mutations that encode it more reliably may appear too. These results shed light on how species may quickly adapt to new environments without accumulating genetic mutations, which can take hundreds of thousands of years. They also may help to explain how colonizer species succeed in challenging environments. The principles described by Bilandžija et al. can be applied to different organisms adapting to new environments, and may help understand the role of phenotypic plasticity in evolution.


Conflict of interest statement

HB, BH, MS, GM, MN, AK, RG, HĆ, MP, KR, WJ No competing interests declared

Figures

Figure 1.
Figure 1.. Morphological differences in Astyanax mexicanus surface fish maintained in different light regimes.
(A) Surface fish (SF) kept in constant dark (D/D; top frame) vs. light/dark (L/D; bottom frame) photoperiod for 1 year. (B) Eye size normalized by body length in D/D vs. L/D SF kept in the experimental conditions for 1 to 2 years. (N = 8) (C) Number of melanophores in 1 year-old D/D vs. L/D SF determined in four different body regions. (N = 5) (D) Thickness of retinal layers in D/D (N = 4) vs. L/D fish (N = 3): GCL, ganglion cell layer; IPL, inner plexiform layer; INL, inner nuclear layer; OPL, outer plexiform layer; ONL, outer nuclear layer; PCL photoreceptor cell layer; RPE, retinal pigment epithelium measured as a ratio to eye diameter. (Error bars: SD; T-test Ns – not significant, *p<0.05, **p<0.001). Figure 1—source data 1 contains raw data and summary statistics.
Figure 1—figure supplement 1.
Figure 1—figure supplement 1.. Cross section of retinal layers in surface fish reared in L/D (top) or D/D (bottom) conditions.
GCL - ganglion cell layer; IPL - inner plexiform layer; INL - inner nuclear layer; OPL - outer plexiform layer; ONL - outer nuclear layer; PCL - photoreceptor cell layer; RPE - retinal pigment epithelium. Scale bar 20 µm.
Figure 2.
Figure 2.. Subset of relevant, enriched GO terms (boxes) for biological processes (top) and molecular functions (bottom) of differentially expressed genes (circles) in the transcriptome.
Genes tested by RT-PCR are in bold. Red outlines are down-regulated terms and genes, and green outlines are up-regulated.
Figure 3.
Figure 3.. Normalized relative expression levels of genes in D/D and L/D SF and PA determined by RT-PCR.
(Error bars: SD; ANOVA with Bonferroni adjustments p<0.05 black * for SF D/D vs. SF L/D; pink * for PA D/D vs. PA L/D; X for SF vs. PA,). Genes that showed the same direction of change in transcriptome and rtPCR are in green, genes that do not show the latter changes in blue, and genes chosen based on previous work in Astyanax in black.
Figure 4.
Figure 4.. Survival curves of starvation resistance in Astyanax mexicanus surface fish (SF) and Pachón cavefish (PA) raised in complete darkness (D/D) or a normal photoperiod (L/D).
Graphs show the percent of surviving fish (from the initial 36) on each day. Groups of SF and PA larvae from each condition were starved starting at seven dpf. Vertical drops represent individuals lost at a given time point. Groups in the legend that share a superscript are not statistically different, p values calculated by Cox proportional hazards model followed by generalized linear hypothesis test. Figure 4—source data 1 contains raw data.
Figure 5.
Figure 5.. Average oxygen consumption at 2.5 (A) and 7.5 dpf (B) in SF and PA larvae kept in D/D versus L/D conditions.
At 2.5 dpf N = 18 (SF L/D), 19 (SF D/D), 18 (PA L/D), 25 (PA D/D), and at 7.5 dpf N = 20 (SF L/D), 24 (SF D/D), 20 (PA L/D) and 24 (PA D/D). (Error bars represent standard deviation, ns: not significant, *p<0.05, **p<0.01 as calculated by ANOVA and Tukey HSD Test.) Figure 5—source data 1 contains raw data and summary statistics.
Figure 6.
Figure 6.. Mean cortisol levels in adult surface fish (SF) and Pachón cavefish (PA) kept in D/D or L/D conditions for 1.5 to 2 years (N = 4/group).
(Error bars represent SD in three technical replicates, ANOVA and Tukey HSD Test: Ns – not significant, *p<0.05, **p<0.01). Figure 6—source data 1 contains raw data and summary statistics.
Figure 7.
Figure 7.. Mean triglyceride levels in SF and PA raised under D/D versus L/D conditions for approximately 1 year since < 24 hpf.
N = 3 fish/group (Error bars represent standard deviation. *p<0.01; ANOVA and Tukey HSD Test). Figure 7—source data 1 contains raw data and summary statistics.
Figure 8.
Figure 8.. Levels of Thyroid stimulating hormone in Astyanax mexicanus under different experimental conditions and from different populations.
(A) Mean Thyroid stimulating hormone levels normalized by protein concentration in adult surface fish (SF) and Pachón cavefish (PA) kept in D/D or L/D conditions for 1.5 to 2 years. N = 3 (SF L/D), 4 (SF D/D), 3 (PA L/D), 3 (PA D/D). (B) Mean thyroid stimulating hormone levels in SF (N = 8) and three different CF populations: Pachón (PA) (N = 5), Tinaja (TI) (N = 3) and Molino (MO) (N = 4) caves. (Error bars represent SD in three technical replicates. N ranges from 3 to 8 fish/group; *p<0.05; **p<0.01 as calculated by ANOVA and Tukey HSD Test. In B ns or * denotes significance in comparison to SF.) Figure 8—source data 1 contains raw data and summary statistics.
Figure 9.
Figure 9.. Levels of Growth hormone in Astyanax mexicanus under different experimental conditions and from different populations.
(A) Mean Growth hormone levels normalized by protein concentration in adult surface fish (SF) and Pachón (PA) cavefish kept in D/D or L/D conditions for 1.5 (SF) and 2 years (PA) since < 3 dpf. N = 3 (SF L/D), 4 (SF D/D), 3 (PA L/D), 3 (PA D/D). (B) Mean growth hormone levels in 3–4 month old SF and three different CF populations: PA, Tinaja (TI), and Molino (MO). (Error bars represent SD in three technical replicates. N = 3 to 8/group. *p<0.05; **p<0.01 as calculated by ANOVA and Tukey HSD Test. In B, **p<0.01 compared to SF). Figure 9—source data 1 contains raw data and summary statistics.
Figure 10.
Figure 10.. Serotonergic system changes in adults and larvae of light/dark (L/D)- and dark/dark (D/D)-reared surface fish and cavefish.
(A, B) Serotonin levels in adult brains (A) and bodies (B) of D/D and L/D reared surface fish (SF) and Pachón cavefish (PA) collected in the middle of the day (DAY) and the middle of the night (NIGHT). (Error bars represent the standard error of the means.) (C) Mean serotonin levels in brains of adult SF and three different CF populations: Molino (MO), Tinaja (TI) and PA. (D) Mean serotonin levels in pooled samples of 5 larvae aged seven dpf placed in the experiment within first few hours post fertilization. (Error bars SEM; ns – not significant, *p<0.05; **p<0.01 as calculated by ANOVA and post-hoc Tukey HSD Test. In C, **p<0.01 vs SF. The number of each fish type subjected to analysis ranged from 4 to 10 per group.) Figure 10—source data 1 contains raw data and summary statistics.
Figure 10—figure supplement 1.
Figure 10—figure supplement 1.. Levels of 5-Hydroxyindoleacetic acid (5-HIAA), the main metabolite of serotonin, in adult brains of L/D or D/D-reared surface fish (SF) and Pachón cavefish (PA) collected in the middle of the day (DAY) and the middle of the night (NIGHT).
Error bars represent the standard error of the means.
Figure 11.
Figure 11.. Survival curve of starvation resistance in G1 offspring of surface fish kept in normal light/dark photoperiod (SF) and G1 offspring of surface fish raised in total darkness for 2 years (dSF).
Graphs show the percent of surviving fish (from the initial 24) on each day. One group of larvae from each fish type (SF, dSF) and each lighting condition (D/D, L/D) was starved starting at seven dpf (a vs. b p<0.0001). Vertical drops represent individuals lost at a given time point, groups in the legend that share a superscript are not statistically different, p values calculated by Cox proportional hazards model followed by generalized linear hypothesis test. Figure 11—source data 1 contains raw data.
Figure 12.
Figure 12.. Average oxygen consumption of 11 dpf G1 offspring surface fish kept in the normal light/dark photoperiod (SF) and surface fish kept in total darkness for 2 years (dSF).
Each group of offspring was exposed to D/D or L/D conditions within first 24 hpf. (Error bars represent standard deviation; *p<0.05, as calculated by ANOVA and Tukey HSD Test.). Figure 12—source data 1 contains raw data and statistics.

References

    1. Alunni A, Menuet A, Candal E, Pénigault JB, Jeffery WR, Rétaux S. Developmental mechanisms for retinal degeneration in the blind cavefish Astyanax mexicanus. The Journal of Comparative Neurology. 2007;505:221–233. doi: 10.1002/cne.21488. - DOI - PubMed
    1. Andrews S. FastQC: A quality control tool for high throughput sequence data. 2010 http://www.bioinformatics.babraham.ac.uk/projects/fastqc/
    1. Aspiras AC, Rohner N, Martineau B, Borowsky RL, Tabin CJ. Melanocortin 4 receptor mutations contribute to the adaptation of cavefish to nutrient-poor conditions. PNAS. 2015;112:9668–9673. doi: 10.1073/pnas.1510802112. - DOI - PMC - PubMed
    1. Aubin-Horth N, Renn SC. Genomic reaction norms: using integrative biology to understand molecular mechanisms of phenotypic plasticity. Molecular Ecology. 2009;18:3763–3780. doi: 10.1111/j.1365-294X.2009.04313.x. - DOI - PubMed
    1. Barr TC. Cave ecology and the evolution of troglobites. In: Dobzhansky T, Hecht M. K, Steere W. C, editors. Evolutionary Biology. Springer; 1968. pp. 35–102. - DOI

Publication types