. 2020 Oct;92(10):1956-1961.
doi: 10.1002/jmv.25908. Epub 2020 May 12.

Epidemiological trends of COVID-19 epidemic in Italy over March 2020: From 1000 to 100 000 cases

Affiliations

Epidemiological trends of COVID-19 epidemic in Italy over March 2020: From 1000 to 100 000 cases

Sebastiano La Maestra et al. J Med Virol. 2020 Oct.

Abstract

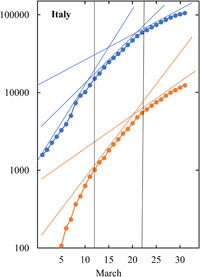
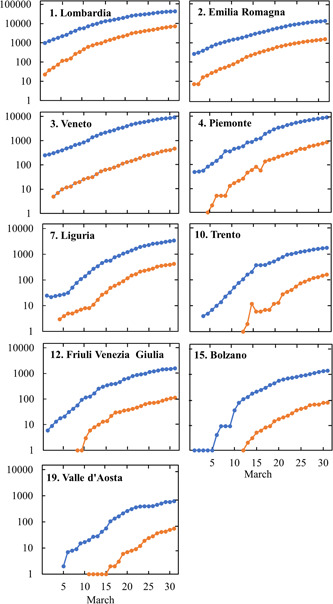
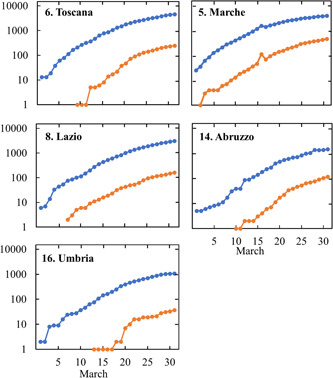
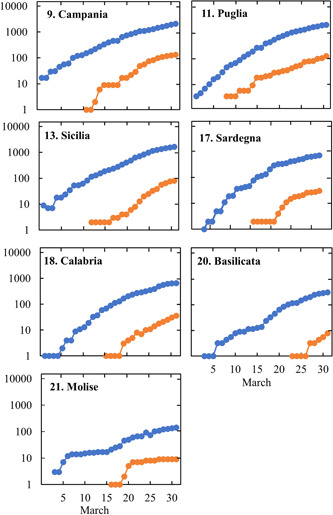
The coronavirus disease 2019 epidemic started in Italy by the end of January 2020 and, after 1 month, it affected 1049 persons. Based on the Italian Ministry of Health data, we reconstructed the daily course of virus-positive cases and deaths over March 2020 for the whole of Italy, 19 regions and 2 provinces. From 29 February to 31 March, there was a 100.9-fold increase in the cumulative number of cases and a 428.6-fold increase in the number of deaths in Italy. When plotted on a semilogarithmic scale, the curves tended to diverge from linearity with 23%, 16%, and 7% average daily increases during the three decades of March. Similarly, the number of deaths decreased from an average daily growth of 19% over the second decade to 10% over the third decade. The correlation coefficients relating the days to cases or deaths over each one of the three decades approached unity. As inferred from the equations of the regression lines relative to the three decades, the doubling times of cases were 3.4, 5.1, and 9.6 days, respectively. The doubling times of deaths over the second and third decades were 4.9 and 7.0 days, respectively. There was a broad geographic variability, with a striking gradient from the North, where 40.8% of cases and 57.9% of deaths occurred in Lombardy, to the South. On the whole, over March there was a trend to epidemic growth decline but the time for the end of the epidemic will depend on a variety of factors and, at present, it is unpredictable.

Keywords: Italy; coronavirus disease 2019 (COVID-19); epidemic; geographic variability; severe acute respiratory syndrome coronavirus 2 (SARS-CoV-2).


Figures

Figure 1
Figure 1
The graph shows the cumulative numbers of COVID‐19 cases (blue symbols), confirmed by positivity of nasopharyngeal swabs for SARS‐CoV‐2, and of deaths (red symbols) ascribed to COVID‐19 in Italy from 1 to 31 March 2020. The data are plotted on a semilogarithmic scale. Two vertical lines were traced in correspondence of 10 and 21 March, thus dividing the month into three periods, from 1 to 10 March, 11 to 21, and 22 to 31. The straight lines are the three regression lines for cases (in blue) and the two regression lines for deaths (in red). See text for details. COVID‐19, coronavirus disease 2019; SARS‐CoV‐2, severe acute respiratory syndrome coronavirus 2
Figure 2
Figure 2
The map of Italy shows the geographical localization of the regions and provinces for which epidemiological data are given in Figures 3, 4, 5. Numbering follows the rank of COVID‐19 cases over the national territory by the end of March. COVID‐19, coronavirus disease 2019
Figure 3
Figure 3
Cumulative numbers of COVID‐19 cases (blue symbols), confirmed by positivity of nasopharyngeal swabs for SARS‐CoV‐2, and of deaths (red symbols) ascribed to COVID‐19 in Northern Italian regions and provinces from 1 to 31 March 2020. The data are plotted on a semilogarithmic scale. The numbers next to the name of the region or province follow the rank of COVID‐19 cases over the national territory by the end of March. COVID‐19, coronavirus disease 2019; SARS‐CoV‐2, severe acute respiratory syndrome coronavirus 2
Figure 4
Figure 4
Cumulative numbers of COVID‐19 cases (blue symbols), confirmed by positivity of nasopharyngeal swabs for SARS‐CoV‐2, and of deaths (red symbols) ascribed to COVID‐19 in Central Italian regions from 1 to 31 March 2020. The data are plotted on a semilogarithmic scale. The numbers next to the name of the region follow the rank of COVID‐19 cases over the national territory by the end of March. COVID‐19, coronavirus disease 2019; SARS‐CoV‐2, severe acute respiratory syndrome coronavirus 2
Figure 5
Figure 5
Cumulative numbers of COVID‐19 cases (blue symbols), confirmed by positivity of nasopharyngeal swabs for SARS‐CoV‐2, and of deaths (red symbols) ascribed to COVID‐19 in Southern Italian regions and islands from 1 to 31 March 2020. The data are plotted on a semilogarithmic scale. The numbers next to the name of the region follow the rank of COVID‐19 cases over the national territory by the end of March. COVID‐19, coronavirus disease 2019; SARS‐CoV‐2, severe acute respiratory syndrome coronavirus 2

References

    1. Li Q, Guan X, Wu P, et al. Early transmission dynamics in Wuhan, China, of novel coronavirus‐infected pneumonia. N Engl J Med. 2020;382:1199‐1207. - PMC - PubMed
    1. Remuzzi A, Remuzzi G. COVID‐19 and Italy: what next? Lancet. 2020;395:1225‐1228. 10.1016/S0140-6736(20)30627-9 - DOI - PMC - PubMed
    1. Giovanetti M, Benvenuto D, Angeletti S, Ciccozzi M. The first two cases of 2019‐nCoV in Italy: where they come from? J Med Virol. 2020;92:518‐521. - PMC - PubMed
    1. Ministero della Sanità (Italian Ministry of Health) . http://www.salute.gov.it/imgs/C_17_notizie_4370_0_file.pdf
    1. Johns Hopkins University of Medicine . Coronavirus Research Center. https://coronavirus.jhu.edu/map.html