. 2020 Apr 1;3(4):e203221.
doi: 10.1001/jamanetworkopen.2020.3221.

Longitudinal Assessment of Mental Health Disorders and Comorbidities Across 4 Decades Among Participants in the Dunedin Birth Cohort Study

Affiliations

Longitudinal Assessment of Mental Health Disorders and Comorbidities Across 4 Decades Among Participants in the Dunedin Birth Cohort Study

Avshalom Caspi et al. JAMA Netw Open. .

Abstract

Importance: Mental health professionals typically encounter patients at 1 point in patients' lives. This cross-sectional window understandably fosters focus on the current presenting diagnosis. Research programs, treatment protocols, specialist clinics, and specialist journals are oriented to presenting diagnoses, on the assumption that diagnosis informs about causes and prognosis. This study tests an alternative hypothesis: people with mental disorders experience many different kinds of disorders across diagnostic families, when followed for 4 decades.

Objective: To describe mental disorder life histories across the first half of the life course.

Design, setting, and participants: This cohort study involved participants born in New Zealand from 1972 to 1973 who were enrolled in the population-representative Dunedin Study. Participants were observed from birth to age 45 years (until April 2019). Data were analyzed from May 2019 to January 2020.

Main outcomes and measures: Diagnosed impairing disorders were assessed 9 times from ages 11 to 45 years. Brain function was assessed through neurocognitive examinations conducted at age 3 years, neuropsychological testing during childhood and adulthood, and midlife neuroimaging-based brain age.

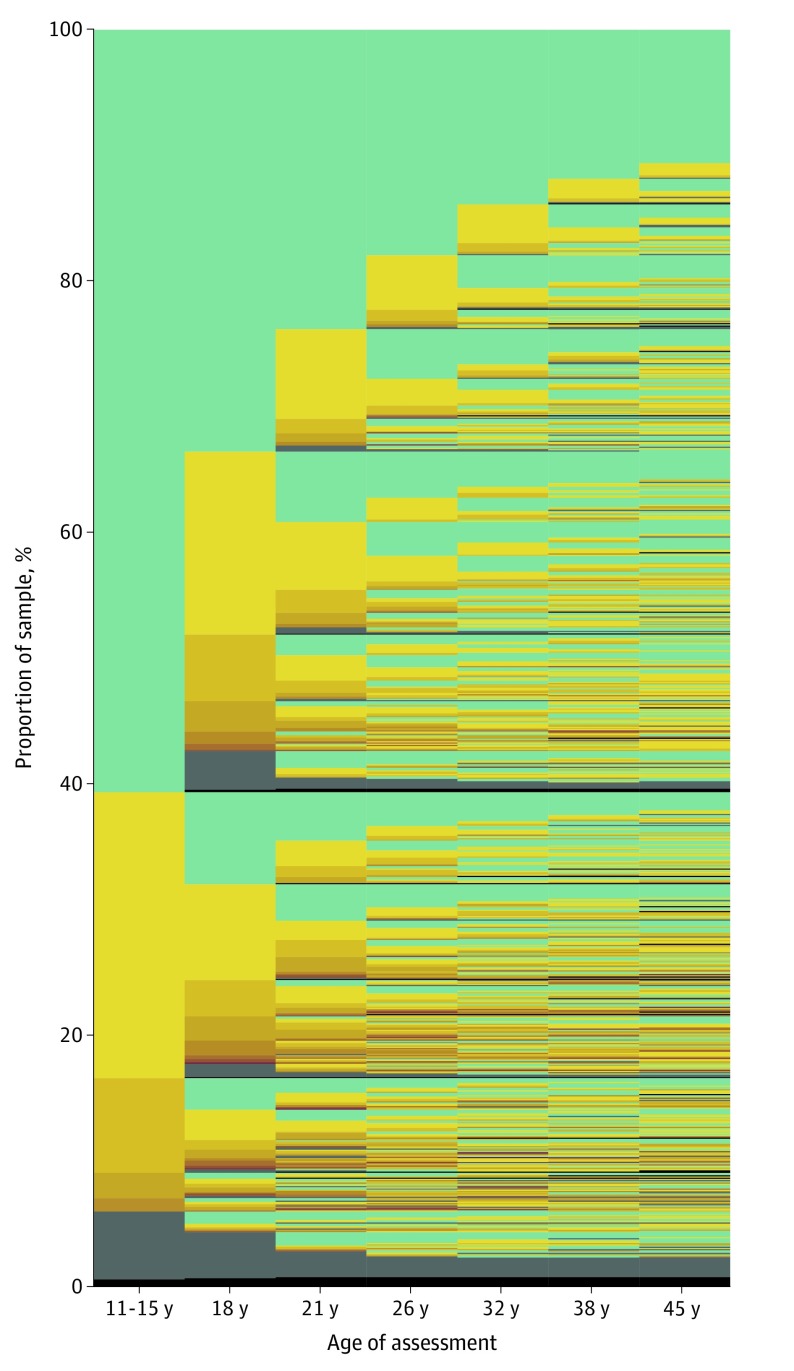
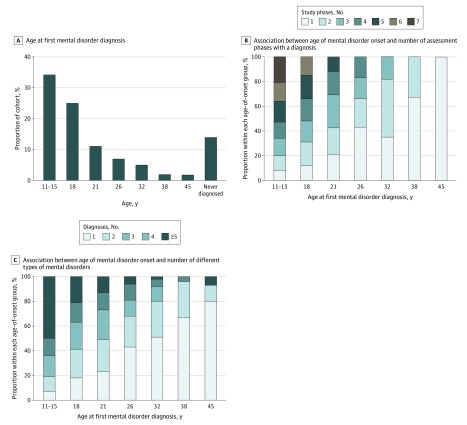
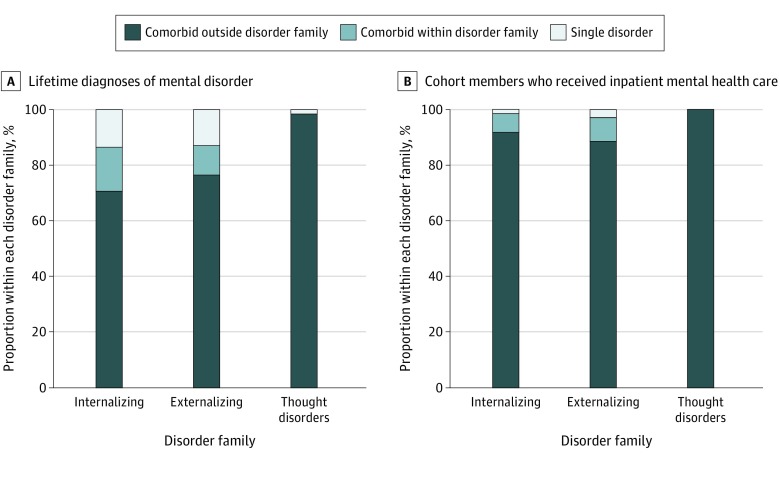
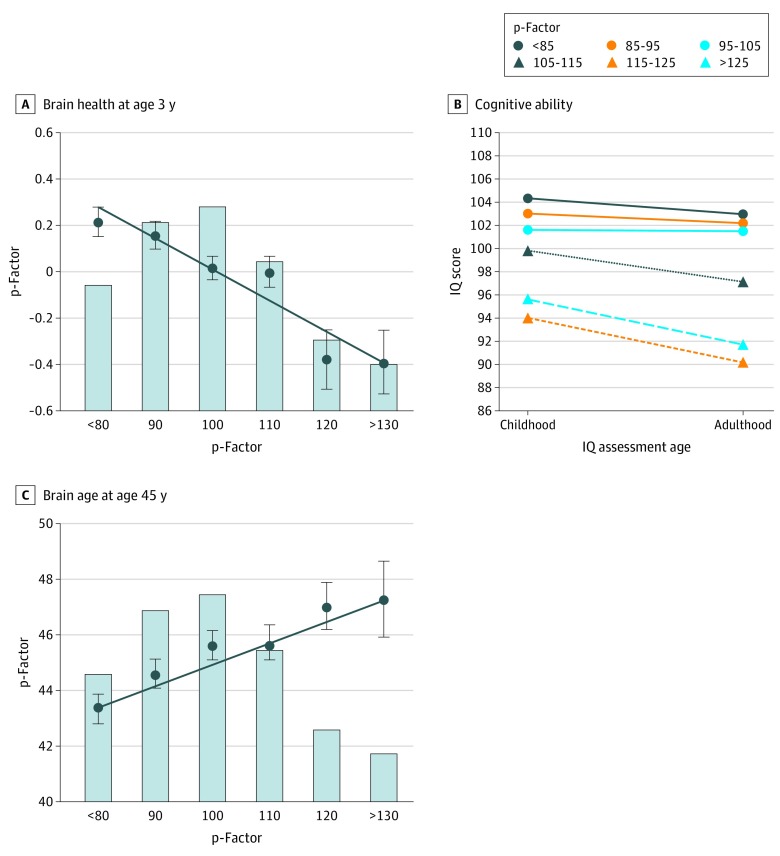
Results: Of 1037 original participants (535 male [51.6%]), 1013 had mental health data available. The proportions of participants meeting the criteria for a mental disorder were as follows: 35% (346 of 975) at ages 11 to 15 years, 50% (473 of 941) at age 18 years, 51% (489 of 961) at age 21 years, 48% (472 of 977) at age 26 years, 46% (444 of 969) at age 32 years, 45% (429 of 955) at age 38 years, and 44% (407 of 927) at age 45 years. The onset of the disorder occurred by adolescence for 59% of participants (600 of 1013), eventually affecting 86% of the cohort (869 of 1013) by midlife. By age 45 years, 85% of participants (737 of 869) with a disorder had accumulated comorbid diagnoses. Participants with adolescent-onset disorders subsequently presented with disorders at more past-year assessments (r = 0.71; 95% CI, 0.68 to 0.74; P < .001) and met the criteria for more diverse disorders (r = 0.64; 95% CI, 0.60 to 0.67; P < .001). Confirmatory factor analysis summarizing mental disorder life histories across 4 decades identified a general factor of psychopathology, the p-factor. Longitudinal analyses showed that high p-factor scores (indicating extensive mental disorder life histories) were antedated by poor neurocognitive functioning at age 3 years (r = -0.18; 95% CI, -0.24 to -0.12; P < .001), were accompanied by childhood-to-adulthood cognitive decline (r = -0.11; 95% CI, -0.17 to -0.04; P < .001), and were associated with older brain age at midlife (r = 0.14; 95% CI, 0.07 to 0.20; P < .001).

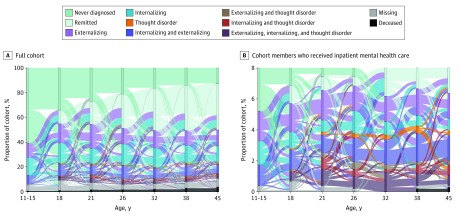
Conclusions and relevance: These findings suggest that mental disorder life histories shift among different successive disorders. Data from the present study, alongside nationwide data from Danish health registers, inform a life-course perspective on mental disorders. This perspective cautions against overreliance on diagnosis-specific research and clinical protocols.


Conflict of interest statement

Conflict of Interest Disclosures: None reported.

Figures

Figure 1.
Figure 1.. Natural History of Mental Disorders in a Cohort of 1037 Individuals
The graph is made up of a thin line for each individual in the Dunedin Study stacked together to show the 1037 cohort members, followed from age 11 to age 45 years. Columns are assessment ages. Green signifies the absence of a mental disorder. Yellow signifies that an individual met the criteria for a psychiatric diagnosis at a given assessment age; as the yellow deepens into orange and brown, it signifies a greater number of concurrent disorders diagnosed for that individual. Gray signifies that a study member was missing at that assessment age. Black signifies that a study member had died.
Figure 2.
Figure 2.. Early-Onset Mental Disorders and Their Sequelae
A, Assessment age at which participants first met diagnostic criteria for a mental disorder. B, Proportion of participants within each onset age who met diagnostic criteria for a mental disorder in 1, 2, 3, 4, 5, 6, or 7 assessment windows. C, Proportion of participants within each onset age who met diagnostic criteria for 1, 2, 3, 4, or 5 or more different types of mental disorders in subsequent years, up to midlife.
Figure 3.
Figure 3.. Lifetime Diagnoses of Single and Comorbid Disorders
A, Information about the 869 participants who were ever diagnosed by the study with a mental disorder; 712 met criteria for an internalizing disorder, 625 met criteria for an externalizing disorder, and 177 met criteria for a thought disorder. Each bar is divided according to whether, over the course of their lifetime, participants also met criteria for another disorder outside that family of disorders, met criteria for another disorder within that family of disorders, or met criteria for just a single disorder. B, Same analysis restricted to the 83 cohort members who received inpatient mental-health services: 74 met criteria for an internalizing disorder, 70 met criteria for an externalizing disorder, and 41 of 83 met criteria for a thought disorder.
Figure 4.
Figure 4.. Ebb and Flow of Mental Disorders
Sankey diagrams show cohort members’ shifting diagnoses from 1 assessment phase to the next, from ages 11 to 15 years to age 45 years. The colors of the horizontal bands divide the diagram into different psychiatric statuses, as indicated in the key. The heights of the horizontal bars show the prevalence of different statuses at each assessment phase. A, Information for the full cohort of 1037 participants. B, Analysis restricted to 83 participants who received inpatient mental-health services (8% of the cohort). Note that it is possible to follow groups across contiguous adjacent assessments, not across the entire panel.
Figure 5.
Figure 5.. Origins and Sequelae of the p-Factor
Graphs show that compromised brain health at age 3 years was associated with higher p-factor scores (A) and that higher p-factor scores were associated with more decline in cognitive ability from childhood to adulthood (B) and older brain age by midlife (C). In each panel, the p-factor score is standardized to a mean (SD) of 100 (15), and higher p-factor scores indicate more generalized psychopathology. In A and C, the bars of the histograms graph the proportions of the sample at different levels of the p-factor score (midpoint of 10-point bands): less than 85 (163 participants [16.3%]), 85 to 95 (237 participants [23.7%]), 95 to 105 (259 participants [25.9%]), 105 to 115 (189 participants [18.9%]), 115 to 125 (91 participants [9.1%]), and greater than 125 (61 participants [6.1%]). The circles and SE bars show the mean scores of individuals in each p-factor score group; these groups have been clumped solely for graphing purposes (with group size >50). The regression lines in A and C show the association between the p-factor score and its childhood correlates and adult sequelae. The regression coefficients reported in the text are based on the full distribution of p-factor scores (see eAppendix 11 in the Supplement for scatterplots).

References

    1. Lieberman JA. DSM-5: Caught between mental illness stigma and anti-psychiatry prejudice. Published May 20, 2013. Accessed February 5, 2020. https://blogs.scientificamerican.com/mind-guest-blog/dsm-5-caught-betwee...
    1. National Institute of Mental Health Research domain criteria (RDoC). Accessed February 5, 2020. https://www.nimh.nih.gov/research/research-funded-by-nimh/rdoc/index.shtml
    1. Neugeboren J. The consolation of a psych diagnosis. Published May 8, 2013. Accessed February 5, 2020. https://www.theatlantic.com/health/archive/2013/05/the-consolation-of-a-...
    1. Sprooten E, Rasgon A, Goodman M, et al. . Addressing reverse inference in psychiatric neuroimaging: meta-analyses of task-related brain activation in common mental disorders. Hum Brain Mapp. 2017;38(4):-. doi:10.1002/hbm.23486 - DOI - PMC - PubMed
    1. McTeague LM, Huemer J, Carreon DM, Jiang Y, Eickhoff SB, Etkin A. Identification of common neural circuit disruptions in cognitive control across psychiatric disorders. Am J Psychiatry. 2017;174(7):676-685. doi:10.1176/appi.ajp.2017.16040400 - DOI - PMC - PubMed

Publication types