Multicenter Study
. 2020 Jul;296(1):76-84.
doi: 10.1148/radiol.2020190646. Epub 2020 Apr 21.

Variability of the Positive Predictive Value of PI-RADS for Prostate MRI across 26 Centers: Experience of the Society of Abdominal Radiology Prostate Cancer Disease-focused Panel

Affiliations
Multicenter Study

Variability of the Positive Predictive Value of PI-RADS for Prostate MRI across 26 Centers: Experience of the Society of Abdominal Radiology Prostate Cancer Disease-focused Panel

Antonio C Westphalen et al. Radiology. 2020 Jul.

Abstract

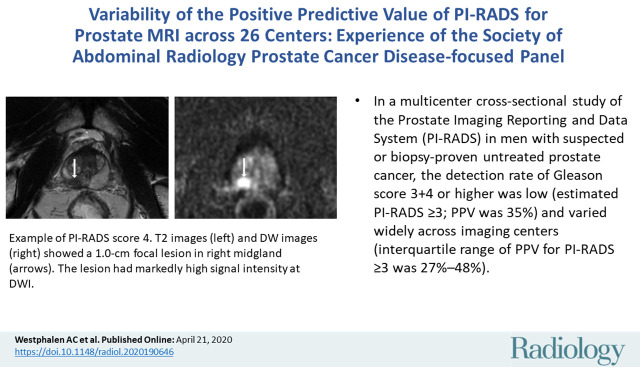
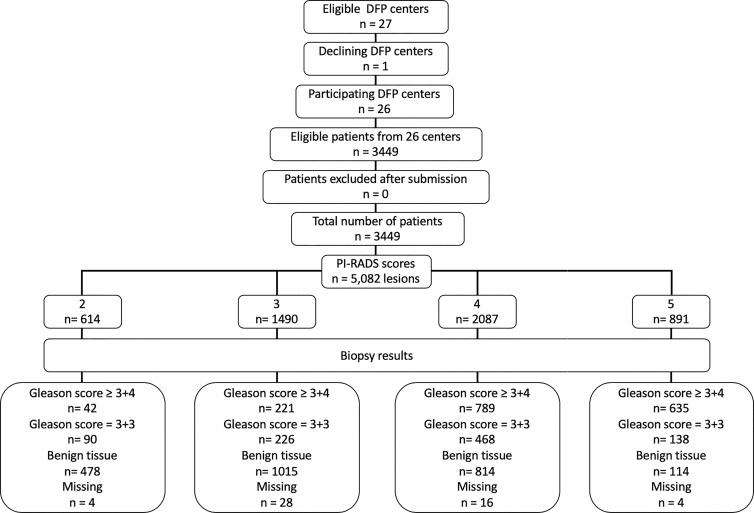
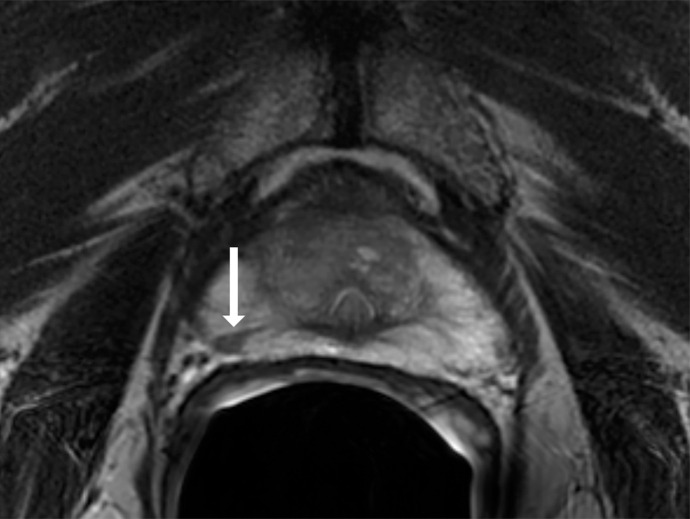
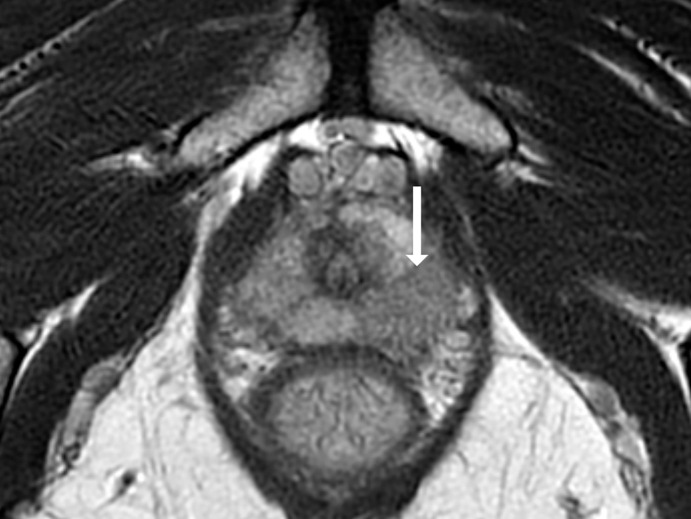
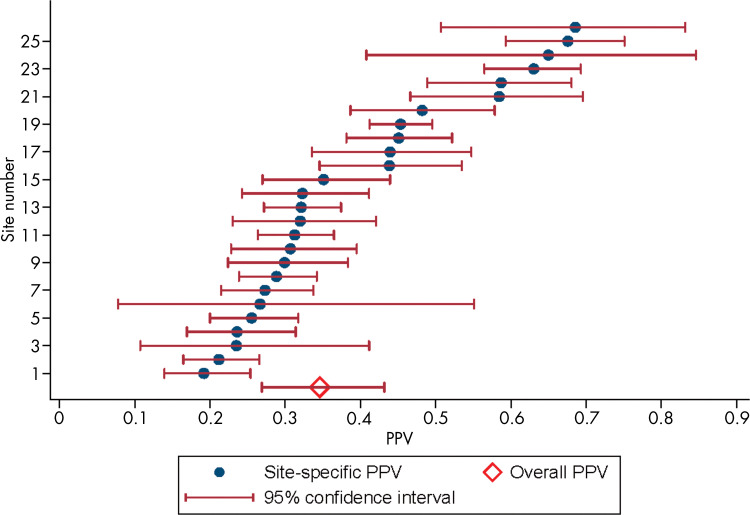
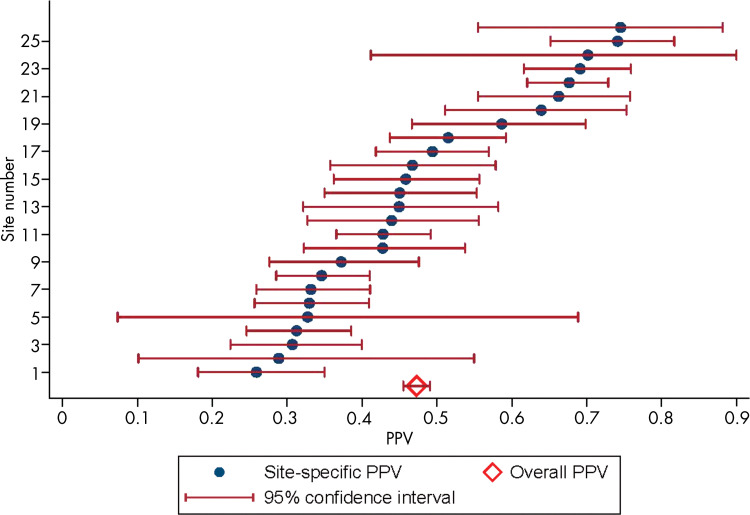
Background Prostate MRI is used widely in clinical care for guiding tissue sampling, active surveillance, and staging. The Prostate Imaging Reporting and Data System (PI-RADS) helps provide a standardized probabilistic approach for identifying clinically significant prostate cancer. Despite widespread use, the variability in performance of prostate MRI across practices remains unknown. Purpose To estimate the positive predictive value (PPV) of PI-RADS for the detection of high-grade prostate cancer across imaging centers. Materials and Methods This retrospective cross-sectional study was compliant with the HIPAA. Twenty-six centers with members in the Society of Abdominal Radiology Prostate Cancer Disease-focused Panel submitted data from men with suspected or biopsy-proven untreated prostate cancer. MRI scans were obtained between January 2015 and April 2018. This was followed with targeted biopsy. Only men with at least one MRI lesion assigned a PI-RADS score of 2-5 were included. Outcome was prostate cancer with Gleason score (GS) greater than or equal to 3+4 (International Society of Urological Pathology grade group ≥2). A mixed-model logistic regression with institution and individuals as random effects was used to estimate overall PPVs. The variability of observed PPV of PI-RADS across imaging centers was described by using the median and interquartile range. Results The authors evaluated 3449 men (mean age, 65 years ± 8 [standard deviation]) with 5082 lesions. Biopsy results showed 1698 cancers with GS greater than or equal to 3+4 (International Society of Urological Pathology grade group ≥2) in 2082 men. Across all centers, the estimated PPV was 35% (95% confidence interval [CI]: 27%, 43%) for a PI-RADS score greater than or equal to 3 and 49% (95% CI: 40%, 58%) for a PI-RADS score greater than or equal to 4. The interquartile ranges of PPV at these same PI-RADS score thresholds were 27%-44% and 27%-48%, respectively. Conclusion The positive predictive value of the Prostate Imaging and Reporting Data System was low and varied widely across centers. © RSNA, 2020 Online supplemental material is available for this article. See also the editorial by Milot in this issue.


Figures

None
Graphical abstract
Flowchart shows the number of participating imaging centers and patients, as well as MRI and biopsy results. DFP = disease-focused panel, PI-RADS = Prostate Imaging Reporting and Data System.
Figure 1:
Flowchart shows the number of participating imaging centers and patients, as well as MRI and biopsy results. DFP = disease-focused panel, PI-RADS = Prostate Imaging Reporting and Data System.
Images show representative peripheral zone lesions (arrow). (a) Prostate Imaging Reporting and Data System (PI-RADS) score 2. T2-weighted MRI scan shows triangular lesion with low T2 signal intensity in right midgland. (b–d) PI-RADS score 3. T2-weighted MRI scan (b), diffusion-weighted MRI scan obtained with high b value (c), and apparent diffusion coefficient (ADC) map (d) show focal lesion in left apex. Lesion has mildly low signal intensity on ADC map and mildly high signal intensity on diffusion-weighted image. No enhancement was seen on dynamic contrast material–enhanced image (not shown). (e–g) PI-RADS score 4. T2-weighted MRI scan (e), diffusion-weighted MRI scan obtained with high b value (f), and ADC map (g) show 1.0-cm focal lesion in right midgland. Lesion has markedly low signal intensity on ADC map and markedly high signal intensity on diffusion-weighted MRI scan. (h) PI-RADS score 5. T2-weighted MRI scan shows large left midgland lesion associated with extraprostatic extension.
Figure 2a:
Images show representative peripheral zone lesions (arrow). (a) Prostate Imaging Reporting and Data System (PI-RADS) score 2. T2-weighted MRI scan shows triangular lesion with low T2 signal intensity in right midgland. (b–d) PI-RADS score 3. T2-weighted MRI scan (b), diffusion-weighted MRI scan obtained with high b value (c), and apparent diffusion coefficient (ADC) map (d) show focal lesion in left apex. Lesion has mildly low signal intensity on ADC map and mildly high signal intensity on diffusion-weighted image. No enhancement was seen on dynamic contrast material–enhanced image (not shown). (e–g) PI-RADS score 4. T2-weighted MRI scan (e), diffusion-weighted MRI scan obtained with high b value (f), and ADC map (g) show 1.0-cm focal lesion in right midgland. Lesion has markedly low signal intensity on ADC map and markedly high signal intensity on diffusion-weighted MRI scan. (h) PI-RADS score 5. T2-weighted MRI scan shows large left midgland lesion associated with extraprostatic extension.
Figure 2b:
Images show representative peripheral zone lesions (arrow). (a) Prostate Imaging Reporting and Data System (PI-RADS) score 2. T2-weighted MRI scan shows triangular lesion with low T2 signal intensity in right midgland. (b–d) PI-RADS score 3. T2-weighted MRI scan (b), diffusion-weighted MRI scan obtained with high b value (c), and apparent diffusion coefficient (ADC) map (d) show focal lesion in left apex. Lesion has mildly low signal intensity on ADC map and mildly high signal intensity on diffusion-weighted image. No enhancement was seen on dynamic contrast material–enhanced image (not shown). (e–g) PI-RADS score 4. T2-weighted MRI scan (e), diffusion-weighted MRI scan obtained with high b value (f), and ADC map (g) show 1.0-cm focal lesion in right midgland. Lesion has markedly low signal intensity on ADC map and markedly high signal intensity on diffusion-weighted MRI scan. (h) PI-RADS score 5. T2-weighted MRI scan shows large left midgland lesion associated with extraprostatic extension.
Figure 2c:
Images show representative peripheral zone lesions (arrow). (a) Prostate Imaging Reporting and Data System (PI-RADS) score 2. T2-weighted MRI scan shows triangular lesion with low T2 signal intensity in right midgland. (b–d) PI-RADS score 3. T2-weighted MRI scan (b), diffusion-weighted MRI scan obtained with high b value (c), and apparent diffusion coefficient (ADC) map (d) show focal lesion in left apex. Lesion has mildly low signal intensity on ADC map and mildly high signal intensity on diffusion-weighted image. No enhancement was seen on dynamic contrast material–enhanced image (not shown). (e–g) PI-RADS score 4. T2-weighted MRI scan (e), diffusion-weighted MRI scan obtained with high b value (f), and ADC map (g) show 1.0-cm focal lesion in right midgland. Lesion has markedly low signal intensity on ADC map and markedly high signal intensity on diffusion-weighted MRI scan. (h) PI-RADS score 5. T2-weighted MRI scan shows large left midgland lesion associated with extraprostatic extension.
Figure 2d:
Images show representative peripheral zone lesions (arrow). (a) Prostate Imaging Reporting and Data System (PI-RADS) score 2. T2-weighted MRI scan shows triangular lesion with low T2 signal intensity in right midgland. (b–d) PI-RADS score 3. T2-weighted MRI scan (b), diffusion-weighted MRI scan obtained with high b value (c), and apparent diffusion coefficient (ADC) map (d) show focal lesion in left apex. Lesion has mildly low signal intensity on ADC map and mildly high signal intensity on diffusion-weighted image. No enhancement was seen on dynamic contrast material–enhanced image (not shown). (e–g) PI-RADS score 4. T2-weighted MRI scan (e), diffusion-weighted MRI scan obtained with high b value (f), and ADC map (g) show 1.0-cm focal lesion in right midgland. Lesion has markedly low signal intensity on ADC map and markedly high signal intensity on diffusion-weighted MRI scan. (h) PI-RADS score 5. T2-weighted MRI scan shows large left midgland lesion associated with extraprostatic extension.
Figure 2e:
Images show representative peripheral zone lesions (arrow). (a) Prostate Imaging Reporting and Data System (PI-RADS) score 2. T2-weighted MRI scan shows triangular lesion with low T2 signal intensity in right midgland. (b–d) PI-RADS score 3. T2-weighted MRI scan (b), diffusion-weighted MRI scan obtained with high b value (c), and apparent diffusion coefficient (ADC) map (d) show focal lesion in left apex. Lesion has mildly low signal intensity on ADC map and mildly high signal intensity on diffusion-weighted image. No enhancement was seen on dynamic contrast material–enhanced image (not shown). (e–g) PI-RADS score 4. T2-weighted MRI scan (e), diffusion-weighted MRI scan obtained with high b value (f), and ADC map (g) show 1.0-cm focal lesion in right midgland. Lesion has markedly low signal intensity on ADC map and markedly high signal intensity on diffusion-weighted MRI scan. (h) PI-RADS score 5. T2-weighted MRI scan shows large left midgland lesion associated with extraprostatic extension.
Figure 2f:
Images show representative peripheral zone lesions (arrow). (a) Prostate Imaging Reporting and Data System (PI-RADS) score 2. T2-weighted MRI scan shows triangular lesion with low T2 signal intensity in right midgland. (b–d) PI-RADS score 3. T2-weighted MRI scan (b), diffusion-weighted MRI scan obtained with high b value (c), and apparent diffusion coefficient (ADC) map (d) show focal lesion in left apex. Lesion has mildly low signal intensity on ADC map and mildly high signal intensity on diffusion-weighted image. No enhancement was seen on dynamic contrast material–enhanced image (not shown). (e–g) PI-RADS score 4. T2-weighted MRI scan (e), diffusion-weighted MRI scan obtained with high b value (f), and ADC map (g) show 1.0-cm focal lesion in right midgland. Lesion has markedly low signal intensity on ADC map and markedly high signal intensity on diffusion-weighted MRI scan. (h) PI-RADS score 5. T2-weighted MRI scan shows large left midgland lesion associated with extraprostatic extension.
Figure 2g:
Images show representative peripheral zone lesions (arrow). (a) Prostate Imaging Reporting and Data System (PI-RADS) score 2. T2-weighted MRI scan shows triangular lesion with low T2 signal intensity in right midgland. (b–d) PI-RADS score 3. T2-weighted MRI scan (b), diffusion-weighted MRI scan obtained with high b value (c), and apparent diffusion coefficient (ADC) map (d) show focal lesion in left apex. Lesion has mildly low signal intensity on ADC map and mildly high signal intensity on diffusion-weighted image. No enhancement was seen on dynamic contrast material–enhanced image (not shown). (e–g) PI-RADS score 4. T2-weighted MRI scan (e), diffusion-weighted MRI scan obtained with high b value (f), and ADC map (g) show 1.0-cm focal lesion in right midgland. Lesion has markedly low signal intensity on ADC map and markedly high signal intensity on diffusion-weighted MRI scan. (h) PI-RADS score 5. T2-weighted MRI scan shows large left midgland lesion associated with extraprostatic extension.
Figure 2h:
Images show representative peripheral zone lesions (arrow). (a) Prostate Imaging Reporting and Data System (PI-RADS) score 2. T2-weighted MRI scan shows triangular lesion with low T2 signal intensity in right midgland. (b–d) PI-RADS score 3. T2-weighted MRI scan (b), diffusion-weighted MRI scan obtained with high b value (c), and apparent diffusion coefficient (ADC) map (d) show focal lesion in left apex. Lesion has mildly low signal intensity on ADC map and mildly high signal intensity on diffusion-weighted image. No enhancement was seen on dynamic contrast material–enhanced image (not shown). (e–g) PI-RADS score 4. T2-weighted MRI scan (e), diffusion-weighted MRI scan obtained with high b value (f), and ADC map (g) show 1.0-cm focal lesion in right midgland. Lesion has markedly low signal intensity on ADC map and markedly high signal intensity on diffusion-weighted MRI scan. (h) PI-RADS score 5. T2-weighted MRI scan shows large left midgland lesion associated with extraprostatic extension.
T2-weighted MRI scans show representative transition zone lesions (arrow). (a) Prostate Imaging Reporting and Data System (PI-RADS) score 2. Image shows encapsulated, mildly heterogeneous nodule in left midgland to base with predominantly low signal intensity. (b) PI-RADS score 3. Image shows heterogeneous signal intensity with ill-defined margins in right midgland. (c) PI-RADS score 4. Image shows small, noncircumscribed lesion with homogeneous and moderately low signal intensity at right apex to midgland level. (d) PI-RADS score 5. Image shows bilateral midgland, large lenticular lesion in midgland with homogeneous and moderately low signal intensity that extends into the anterior fibromuscular stroma.
Figure 3a:
T2-weighted MRI scans show representative transition zone lesions (arrow). (a) Prostate Imaging Reporting and Data System (PI-RADS) score 2. Image shows encapsulated, mildly heterogeneous nodule in left midgland to base with predominantly low signal intensity. (b) PI-RADS score 3. Image shows heterogeneous signal intensity with ill-defined margins in right midgland. (c) PI-RADS score 4. Image shows small, noncircumscribed lesion with homogeneous and moderately low signal intensity at right apex to midgland level. (d) PI-RADS score 5. Image shows bilateral midgland, large lenticular lesion in midgland with homogeneous and moderately low signal intensity that extends into the anterior fibromuscular stroma.
Figure 3b:
T2-weighted MRI scans show representative transition zone lesions (arrow). (a) Prostate Imaging Reporting and Data System (PI-RADS) score 2. Image shows encapsulated, mildly heterogeneous nodule in left midgland to base with predominantly low signal intensity. (b) PI-RADS score 3. Image shows heterogeneous signal intensity with ill-defined margins in right midgland. (c) PI-RADS score 4. Image shows small, noncircumscribed lesion with homogeneous and moderately low signal intensity at right apex to midgland level. (d) PI-RADS score 5. Image shows bilateral midgland, large lenticular lesion in midgland with homogeneous and moderately low signal intensity that extends into the anterior fibromuscular stroma.
Figure 3c:
T2-weighted MRI scans show representative transition zone lesions (arrow). (a) Prostate Imaging Reporting and Data System (PI-RADS) score 2. Image shows encapsulated, mildly heterogeneous nodule in left midgland to base with predominantly low signal intensity. (b) PI-RADS score 3. Image shows heterogeneous signal intensity with ill-defined margins in right midgland. (c) PI-RADS score 4. Image shows small, noncircumscribed lesion with homogeneous and moderately low signal intensity at right apex to midgland level. (d) PI-RADS score 5. Image shows bilateral midgland, large lenticular lesion in midgland with homogeneous and moderately low signal intensity that extends into the anterior fibromuscular stroma.
Figure 3d:
T2-weighted MRI scans show representative transition zone lesions (arrow). (a) Prostate Imaging Reporting and Data System (PI-RADS) score 2. Image shows encapsulated, mildly heterogeneous nodule in left midgland to base with predominantly low signal intensity. (b) PI-RADS score 3. Image shows heterogeneous signal intensity with ill-defined margins in right midgland. (c) PI-RADS score 4. Image shows small, noncircumscribed lesion with homogeneous and moderately low signal intensity at right apex to midgland level. (d) PI-RADS score 5. Image shows bilateral midgland, large lenticular lesion in midgland with homogeneous and moderately low signal intensity that extends into the anterior fibromuscular stroma.
Forest plots show site-specific median positive predictive values (PPVs) of (a) Prostate Imaging Reporting and Data System (PI-RADS) score greater than or equal to 3 and (b) PI-RADS score greater than or equal to 4. The overall estimated PPV for all sites is also shown.
Figure 4a:
Forest plots show site-specific median positive predictive values (PPVs) of (a) Prostate Imaging Reporting and Data System (PI-RADS) score greater than or equal to 3 and (b) PI-RADS score greater than or equal to 4. The overall estimated PPV for all sites is also shown.
Figure 4b:
Forest plots show site-specific median positive predictive values (PPVs) of (a) Prostate Imaging Reporting and Data System (PI-RADS) score greater than or equal to 3 and (b) PI-RADS score greater than or equal to 4. The overall estimated PPV for all sites is also shown.

Comment in

Similar articles

Cited by

References

    1. Kasivisvanathan V, Rannikko AS, Borghi M, et al. . MRI-Targeted or Standard Biopsy for Prostate-Cancer Diagnosis. N Engl J Med 2018;378(19):1767–1777. - PMC - PubMed
    1. Rosenkrantz AB, Verma S, Choyke P, et al. . Prostate Magnetic Resonance Imaging and Magnetic Resonance Imaging Targeted Biopsy in Patients with a Prior Negative Biopsy: A Consensus Statement by AUA and SAR. J Urol 2016;196(6):1613–1618. - PMC - PubMed
    1. Mottet N, Bellmunt J, Briers E, et al. . EAU–ESTRO–ESUR–SIOG Guidelines on Prostate Cancer. https://uroweb.org/guideline/prostate-cancer. Published 2019. Accessed June 24, 2019. - PubMed
    1. Rosenkrantz AB, Hemingway J, Hughes DR, Duszak R, Jr, Allen B, Jr, Weinreb JC. Evolving Use of Prebiopsy Prostate Magnetic Resonance Imaging in the Medicare Population. J Urol 2018;200(1):89–94. - PubMed
    1. Weinreb JC, Barentsz JO, Choyke PL, et al. . PI-RADS Prostate Imaging - Reporting and Data System: 2015, Version 2. Eur Urol 2016;69(1):16–40. - PMC - PubMed

Publication types