. 2020 Jul 1;130(7):3699-3716.
doi: 10.1172/JCI129049.

HDAC inhibitors elicit metabolic reprogramming by targeting super-enhancers in glioblastoma models

Affiliations

HDAC inhibitors elicit metabolic reprogramming by targeting super-enhancers in glioblastoma models

Trang Thi Thu Nguyen et al. J Clin Invest. .

Abstract

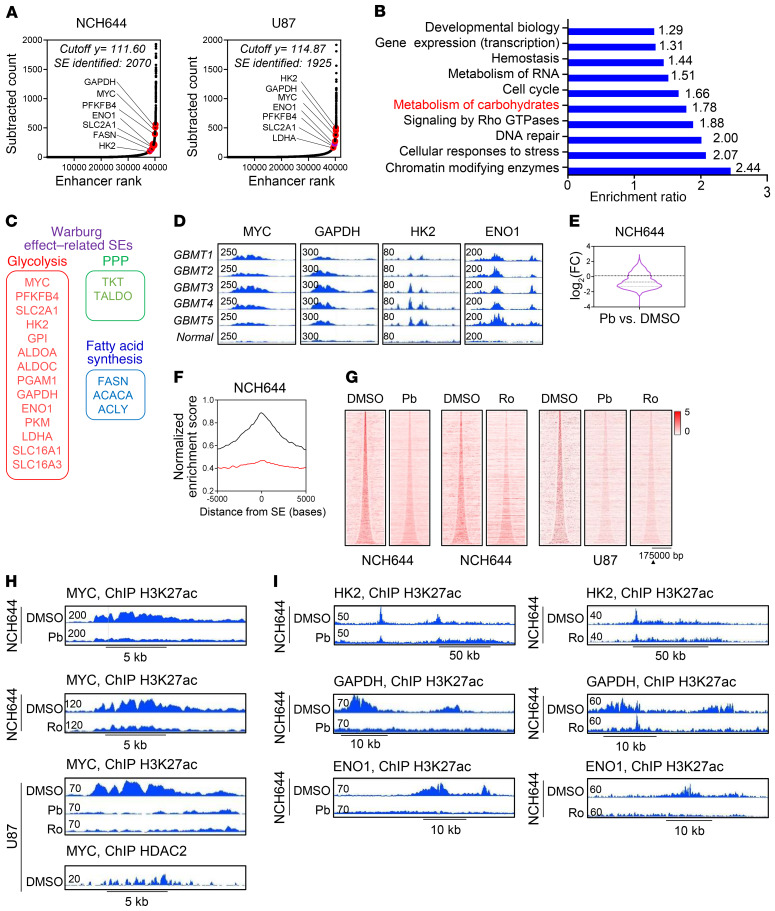
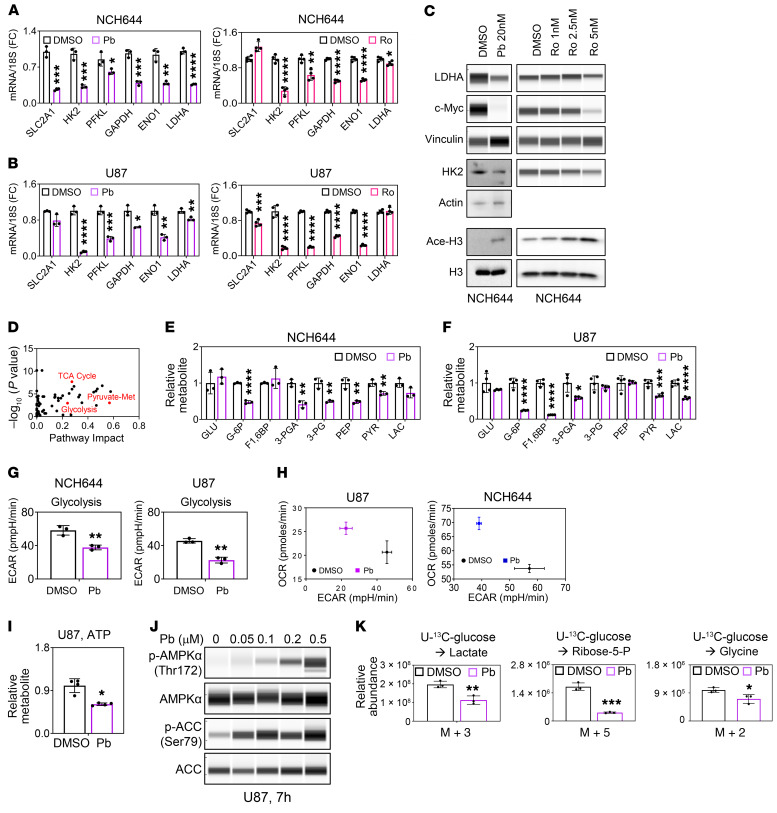
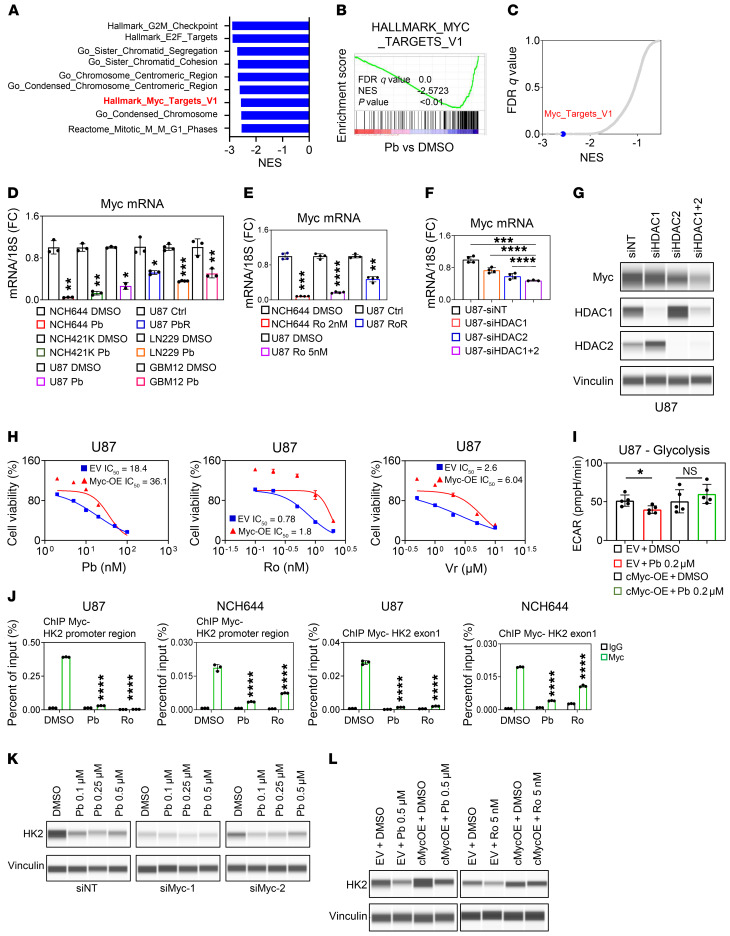
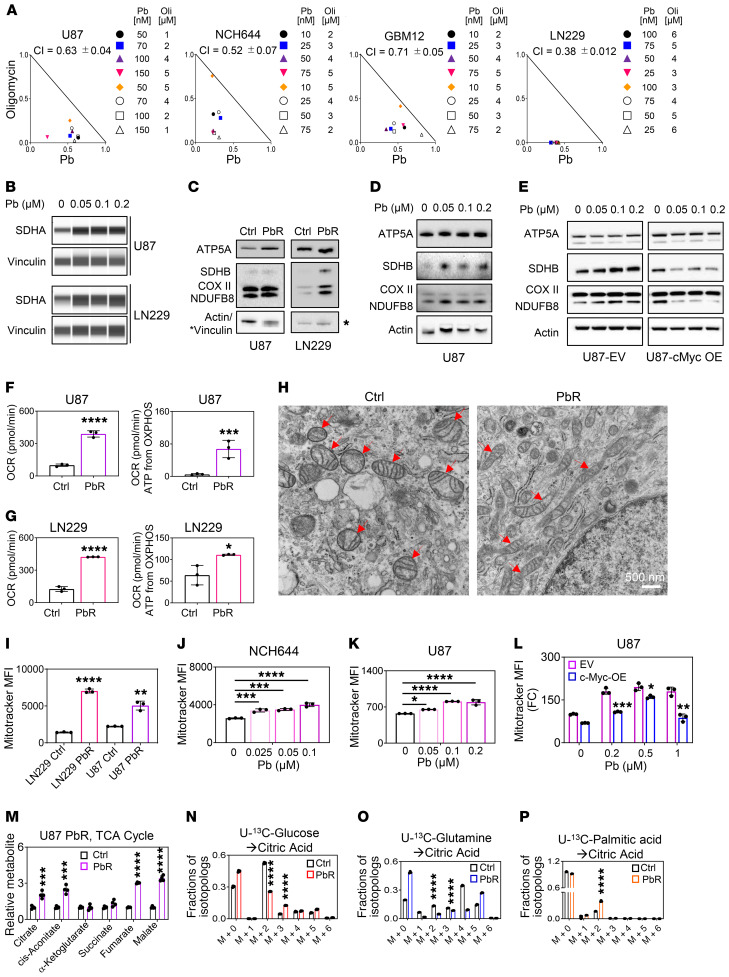
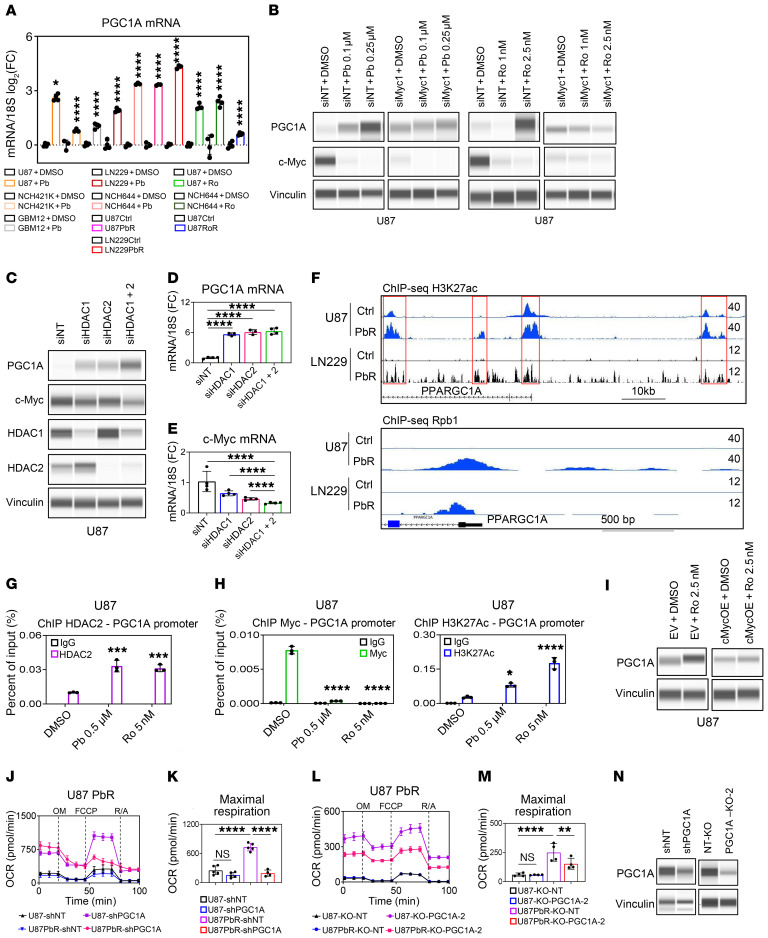
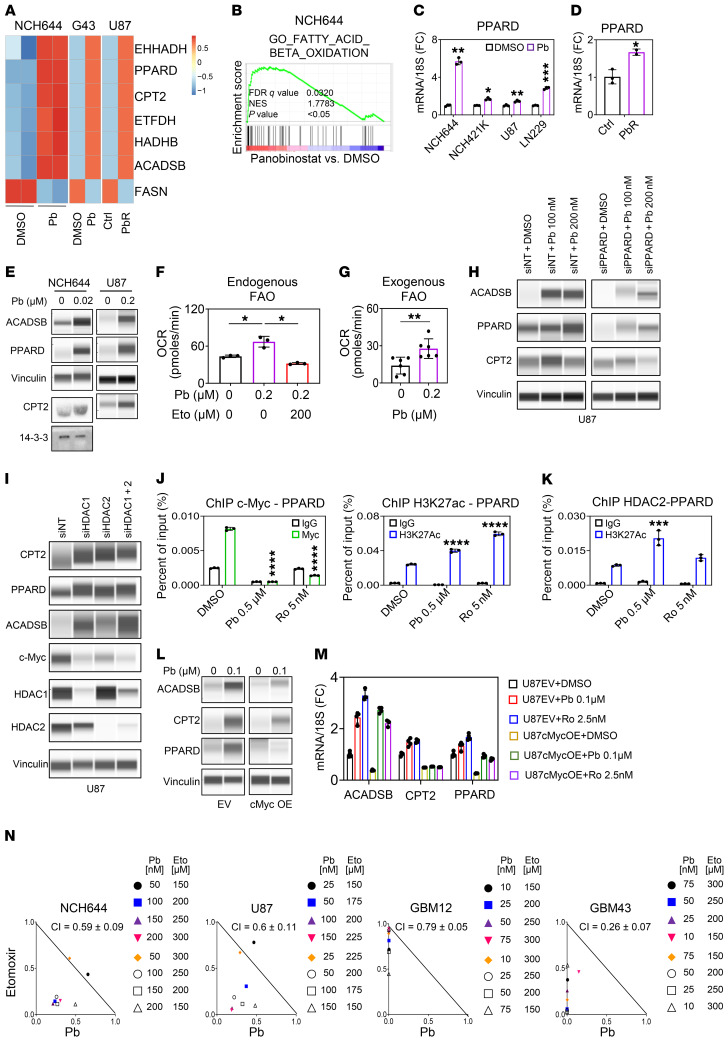
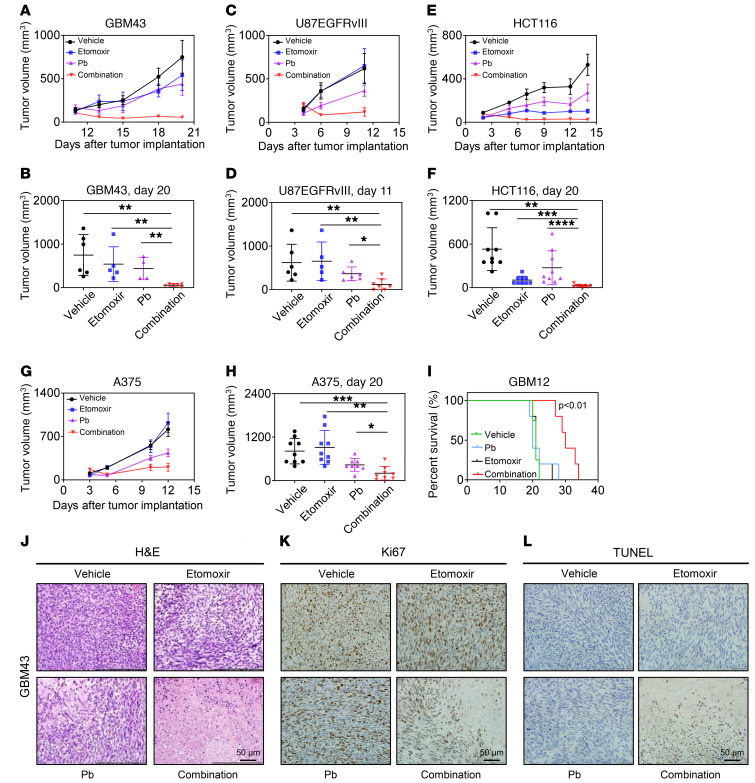
The Warburg effect is a tumor-related phenomenon that could potentially be targeted therapeutically. Here, we showed that glioblastoma (GBM) cultures and patients' tumors harbored super-enhancers in several genes related to the Warburg effect. By conducting a transcriptome analysis followed by ChIP-Seq coupled with a comprehensive metabolite analysis in GBM models, we found that FDA-approved global (panobinostat, vorinostat) and selective (romidepsin) histone deacetylase (HDAC) inhibitors elicited metabolic reprogramming in concert with disruption of several Warburg effect-related super-enhancers. Extracellular flux and carbon-tracing analyses revealed that HDAC inhibitors blunted glycolysis in a c-Myc-dependent manner and lowered ATP levels. This resulted in the engagement of oxidative phosphorylation (OXPHOS) driven by elevated fatty acid oxidation (FAO), rendering GBM cells dependent on these pathways. Mechanistically, interference with HDAC1/-2 elicited a suppression of c-Myc protein levels and a concomitant increase in 2 transcriptional drivers of oxidative metabolism, PGC1α and PPARD, suggesting an inverse relationship. Rescue and ChIP experiments indicated that c-Myc bound to the promoter regions of PGC1α and PPARD to counteract their upregulation driven by HDAC1/-2 inhibition. Finally, we demonstrated that combination treatment with HDAC and FAO inhibitors extended animal survival in patient-derived xenograft model systems in vivo more potently than single treatments in the absence of toxicity.

Keywords: Intermediary metabolism; Oncology.


Conflict of interest statement

Conflict of interest: The authors have declared that no conflict of interest exists.

Figures

Figure 1
Figure 1. Identification of super-enhancers in the desert of Warburg effect–related genes that are disrupted by HDAC inhibitors.
(A) ChIP of H3K27ac coupled with next-generation sequencing of NCH644 and U87 GBM cells was performed followed by super-enhancer (SE) analysis. Shown are the super-enhancers of genes involved in glycolysis, the PPP, and fatty acid synthesis (Warburg effect–related genes). The peak located at the HK2 locus in the NCH644 cells is slightly below the cutoff and therefore a strong enhancer. (B) “Reactome analysis” of mutual super-enhancer genes in NCH644, U87, and LN229 GBM cells. FDR Q < 0.05. (C) The Warburg effect consists of genes encoding for enzymes or transporters involved in glycolysis, the PPP, or fatty acid synthesis. (D) Published ChIP-Seq (H3K27ac) data for GBMs and normal brain tissue (pileup values are indicated) (GSE101148 and GSE17312). (E and F) Representation of global disruption of the super-enhancer landscape of NCH644 cells treated with Pb. FC, fold change. (G) Heatmaps of super-enhancers in control- and HDAC inhibitor–exposed NCH644 and U87 GBM cells. Scale bar indicates the intensities. (H) ChIP-Seq (H3K27ac) was performed in NCH644 and U87 cells treated with vehicle (DMSO), Pb, or Ro. Shown are the respective tracks around the Myc locus (pileup values are indicated). (I) ChIP-Seq (H3K27ac) was performed in NCH644 cells treated with vehicle, Pb, or Ro. Shown are the respective tracks around HK2, GAPDH, and ENO1.
Figure 2
Figure 2. HDAC inhibitors reverse the Warburg effect.
(A) Real-time PCR analysis of genes related to glycolysis from stem-like NCH644 GBM cells treated with 0.5 μM Pb or 2 nM Ro for 24 hours (n = 3–4). (B) Real-time PCR analysis of genes related to glycolysis from established U87 GBM cells treated with 0.5 μM Pb or 5 nM Ro for 24 hours (n = 3–4). (C) Analysis of protein lysate from NCH644 cells treated with the indicated concentration of Pb (LDHA, c-Myc, vinculin [loading control]: protein capillary electrophoresis [PCE]; HK2, actin [loading control]: standard Western blot gel; Ace-H3, H3 [loading control]: standard Western blot) or Ro for 24 hours (LDHA, c-Myc, HK2, vinculin [loading control]: PCE; Ace-H3, H3 [loading control]: standard Western blot). (D) U87 GBM cells were treated with 0.5 μM Pb for 24 hours and analyzed by LC/MS followed by metabolite (Met) pathway analysis. (E and F) Quantifications of glycolysis-related metabolites from NCH644 and U87 cells treated with 0.5 μM Pb for 24 hours (n = 3–4). GLU, glucose; G-6P, glucose-6-phosphate; F1,6BP, fructose-1,6-bisphosphate; 3-PGA, glyceraldehyde-3-phosphate; 3-PG, 3-phosphoglycerate; PEP, phosphoenolpyruvate; PYR, pyruvate; LAC, lactate. (G and H) NCH644 and U87 cells were exposed to 0.2 μM Pb, and the OCR and ECAR were recorded (n = 3). (I) U87 cells were treated and harvested as in E and F. Shown are the levels of ATP (determined by LC/MS). (J) PCE analysis of lysates from U87 cells treated with the indicated concentrations of Pb for 7 hours. (K) Quantifications of the relative abundances of the indicated 13C isotopologs from U-13C-glucose in U87 GBM cells treated with 0.5 μM Pb for 24 hours (n = 3). Data represent the mean ± SD. Statistical significance was determined by 2-tailed Student’s t test. *P < 0.05, **P < 0.01, ***P < 0.001, and ****P < 0.0001.
Figure 3
Figure 3. HDAC inhibitors suppress c-Myc protein levels and thereby reduce survival and glycolysis in GBM cells.
(A) The top 9 pathways identified by GSEA of NCH644 cells treated with 0.5 μM Pb for 24 hours (transcriptome analysis). (B) GSEA plot. (C) Graphical representation of the FDR Q values versus NES derived from the analysis in A and B. (D) GBM cells were treated with Pb or were chronically exposed to Pb (n = 3). (E) GBM cells were treated with Ro or were chronically exposed to Ro (n = 4). (F) U87 GBM cells were transfected with HDAC1 siRNA (siHDAC1), HDAC2 siRNA (siHDAC2), or a combination of both (siHDAC1+2) (n = 3–4). (G) PCE analysis of lysates from U87 cells transfected with HDAC1 siRNA, HDAC2 siRNA, or a combination of both. (H) U87 cells were treated with the indicated concentrations of Pb, Ro, or Vr for 72 hours, and cellular viability was determined. (I) U87 cells expressing a c-Myc construct were treated with 0.2 μM Pb for 24 hours, and a glycolysis stress test was performed (n = 5). (J) ChIP-qPCR of different locations around the HK2 gene (promoter and exon 1) from the indicated cell lysate with either a c-Myc or IgG antibody (n = 3). (K) PCE analysis of U87 cells that were transfected with an siRNA against Myc-1 or Myc-2, treated with the indicated concentration of Pb for 24 hours, and analyzed for the indicated protein. (L) PCE analysis of lysates from U87 cells that were transduced with a c-Myc construct, treated with 0.5 μM Pb or 5 nM Ro for 24 hours, and analyzed for HK2. Data represent the mean ± SD. Statistical significance was determined by 2-tailed Student’s t test (F, I, and J) or by 1-way ANOVA (G and H). *P < 0.05, **P < 0.01, ***P < 0.001, and ****P < 0.0001. Ctrl, control; EV, empty vector; NES, normalized enrichment score; OE, overexpression; siNT, nontargeting siRNA .
Figure 4
Figure 4. HDAC inhibitors drive oxidative energy metabolism.
(A) Isobolograms show the results for U87, NCH644, GBM12, and LN229 cells that were treated with Pb in the presence of oligomycin (Oli) for 72 hours. (B) PCE analyses of U87 and LN229 cells treated with Pb for 24 hours. (C) Western blots of the OXPHOS complex from parental U87 and LN229 GBM cells and U87 and LN229 GBM cells chronically exposed to Pb (PbR). (D) Western blots of the OXPHOs complex from U87 cells treated with Pb for 24 hours. (E) U87 cells were transduced with a c-Myc construct, treated with Pb for 24 hours, and analyzed for OXPHOS complexes. (F and G) OCR and OXPHOS-driven ATP production rates in U87 and LN229 cells chronically exposed to Pb (n = 3). (H) Electron microscopic images of parental U87 cells and U87 cells chronically Pb. Arrows highlight mitochondria. Scale bar: 500 nm. (I) Parental U87 and LN229 cells and U98 and LN229 cells chronically exposed to Pb were stained with MitoTracker and analyzed by flow cytometry (n = 3). (J and K) NCH644 and U87 cells were treated with Pb, stained with MitoTracker, and analyzed by flow cytometry (n = 3). (L) c-Myc construct–transduced U87 cells were treated with Pb for 24 hours, stained with MitoTracker, and analyzed by flow cytometry (n = 3). (M) TCA cycle metabolites in parental U87 cells or U87 cells chronically exposed to Pb (n = 3). (N) Parental U87 cells or U87 cells chronically exposed to Pb were cultured in DMEM media (25 mM U-13C-glucose, 4 mM glutamine) for 24 hours (n = 3). (O) U87 parental cells or U87 cells chronically exposed to Pb were cultured in DMEM media (25 mM glucose, 4 mM U-13C-glutamine) for 24 hours (n = 3). (P) Parental U87 cells or U87 cells chronically exposed to Pb were cultured in DMEM media (5 mM glucose, 1 mM glutamine, 100 μM U-13C-palmitic acid) for 24 hours (n = 3). Data represent the mean ± SD. Statistical significance was determined by 2-tailed Student’s t test (FI and LP) or 1-way ANOVA (J and K). *P < 0.05, **P < 0.01, ***P < 0.001, and ****P < 0.0001.
Figure 5
Figure 5. Pan- and selective HDAC inhibitors upregulate PGC1α in a partially c-Myc–dependent manner to drive respiration.
(A) GBM cells were treated with Pb or Ro or chronically exposed to Pb or Ro (n = 3–4). (B) PCE analyses of U87 cells transfected with Myc siRNA and treated with Pb or Ro for 24 hours. (C) PCE analyses of U87 cells transfected with siRNA HDAC1, HDAC2, or a combination of both. (D and E) Real-time PCR analysis of U87 cells transfected with HDAC1 siRNA, HDAC2 siRNA, or a combination of both (n = 3–4). (F) ChIP-Seq profile of parental U87 and LN229 cells or U87 and LN229 cells chronically exposed to Pb with an antibody against H3K27ac or Rpb1. Shown are the respective tracks around the desert of the PPARGC1A (PGC1α) locus. (G) ChIP-qPCR (with anti-HDAC2 antibody) of the PGC1α promoter (c-Myc–binding region) from the indicated cell lysates (n = 3). (H) ChIP-qPCR of the PGC1α promoter (c-Myc–binding region) from the indicated cell lysates with either anti–c-Myc antibody or anti-H3K27ac antibody (n = 3). (I) PCE analysis of U87 cells transduced with a c-Myc construct and treated with 2.5 nM Ro for 24 hours. (J) Mitochondrial stress test of parental U87 cells or U87 cells chronically exposed to Pb and transduced with an shRNA against PGC1α (n = 4–5). O, oligomycin; F, FCCP; R/A, rotenone and antimycin A. (K) Maximal respiration data from the experiment in J. (L) Mitochondrial stress extracellular flux analysis of parental U87 cells or U87 cells chronically exposed to Pb and transduced with PGC1α sgRNAs (n = 4). (M) Maximal respiration data from the experiment in L. U87-KO-NT, nontargeting KO U87 cells; U87PbR-KO-NT, nontargeting KO U87 cells chronically exposed to Pb; U87-KO-PGC1A-2, PGC1A-2–KO U87 cells; U87PbR-KO-PGC1A-2, PGC1A-2–KO U87 cells chronically exposed to Pb. (N) PCE analysis of U87 cells transduced with an shRNA against PGC1α or PGC1α sgRNAs. Data represent the mean ± SD. Statistical significance was determined by 2-tailed Student’s t test (A) or 1-way ANOVA (D, E, G, H, K, and M). *P < 0.05, **P < 0.01, ***P < 0.001, and ****P < 0.0001.
Figure 6
Figure 6. HDAC inhibitors drive lipid catabolism with activation of β-oxidation in a manner dependent on the transcription factor PPARD.
(A) Heatmap (mRNA) of NCH644 cells treated with 0.5 μM Pb for 24 hours, GBM43 (G43) cells treated with Pb (in vivo), and parent U87 cells and U87 cells chronically exposed to Pb. (B) GSEA plots of NCH644 cells treated with 0.5 μM Pb for 24 hours. (C) PPARD mRNA levels in GBM cells treated with 0.2 μM Pb for 24 hours (n = 3). (D) PPARD mRNA levels in parent U87 cells or U87 cells chronically exposed to Pb (n = 3). (E) PCE analysis of NCH644 cells and U87 cells treated with Pb for 24 hours (except for CPT2 and 14-3-3 [loading control] in NCH644 cells, which is standard Western blotting). (F) OCR in U87 GBM cells treated as indicated for 24 hours (n = 3). (G) OCR in U87 cells treated with 0.2 μM Pb in the presence of palmitate (n = 6). (H) U87 cells transfected with a siRNA against PPARD and treated with Pb for 24 hours. (I) U87 cells were transfected with siRNA against HDAC1, HDAC2, or a combination of both and analyzed by protein capillary electrophoresis. (J) ChIP-qPCR of the PPARD gene from the indicated cell lysates with either anti–c-Myc antibody or anti-H3K27ac antibody (n = 3). (K) ChIP-qPCR of the PPARD gene from the indicated cell lysates with anti-HDAC2 antibody (n = 3). (L) U87 cells were transduced with c-Myc and treated with 0.1 μM Pb for 24 hours. (M) mRNA levels in U87 cells transduced with c-Myc and treated with 0.1 μM Pb or 2.5 nM Ro for 24 hours (n = 3–4). (N) Isobolograms of NCH644, U87, GBM12, and GBM43 cells treated with Pb, with or without etomoxir, for 72 hours. Data represent the mean ± SD. Statistical significance was determined by 2-tailed Student’s t test (C, D, and G) or 1-way ANOVA (F, J, and K). *P < 0.05, **P < 0.01, ***P < 0.001, and ****P < 0.0001. Eto, etomoxir.
Figure 7
Figure 7. Interference with oxidative energy metabolism along with HDAC inhibition synergistically reduces tumor growth in conventional and PDX models.
(A and B) GBM43 PDX tumor cells were implanted subcutaneously into immunocompromised mice. After tumor formation, 4 treatment groups were established: vehicle, etomoxir, Pb, or combined etomoxir and Pb treatment. Animals in the respective groups were treated 3 times a week (n = 3–6). (C and D) U87 EGFRvIII GBM cells were implanted subcutaneously into immunocompromised mice Mice were treated as indicated in A and B (n = 5–7). (E and F) HCT116 colon carcinoma cells were implanted subcutaneously into immunocompromised mice. Mice were treated in indicated in A and B (n = 9). (G and H) BRAF V600E–mutant A375 melanoma cells were implanted subcutaneously into immunocompromised mice. Mice were treated as indicated in A and B (n = 8–9). (I) GBM12 cells were implanted into the right striatum of nude mice that were then randomly divided into 4 treatment groups: vehicle, etomoxir, Pb, or combined treatment with etomoxir and Pb. Nine treatments were performed, and survival was analyzed using the Kaplan-Meier method. The log-rank test was used to assess statistical significance (n = 4–5). (JL) At the end of the experiments in A and B, tumors from the individual groups were harvested for staining with H&E, TUNEL, or Ki67. Scale bars: 50 μm. Data represent the mean ± SD. Statistical significance was determined by 1-way ANOVA. *P < 0.05, **P < 0.01, ***P < 0.001, and ****P < 0.0001.

References

    1. Masui K, et al. mTOR complex 2 controls glycolytic metabolism in glioblastoma through FoxO acetylation and upregulation of c-Myc. Cell Metab. 2013;18(5):726–739. doi: 10.1016/j.cmet.2013.09.013. - DOI - PMC - PubMed
    1. Kuang R, et al. GLUT3 upregulation promotes metabolic reprogramming associated with antiangiogenic therapy resistance. JCI Insight. 2017;2(2):e88815. - PMC - PubMed
    1. Pietrocola F, Galluzzi L, Bravo-San Pedro JM, Madeo F, Kroemer G. Acetyl coenzyme A: a central metabolite and second messenger. Cell Metab. 2015;21(6):805–821. doi: 10.1016/j.cmet.2015.05.014. - DOI - PubMed
    1. Sivanand S, et al. Nuclear acetyl-CoA production by ACLY promotes homologous recombination. Mol Cell. 2017;67(2):252–265.e6. doi: 10.1016/j.molcel.2017.06.008. - DOI - PMC - PubMed
    1. Zhang B, et al. PHGDH Defines a metabolic subtype in lung adenocarcinomas with poor prognosis. Cell Rep. 2017;19(11):2289–2303. doi: 10.1016/j.celrep.2017.05.067. - DOI - PubMed

Publication types

MeSH terms