. 2020 May 21;78(4):653-669.e8.
doi: 10.1016/j.molcel.2020.03.025. Epub 2020 Apr 20.

MYC Controls the Epstein-Barr Virus Lytic Switch

Affiliations

MYC Controls the Epstein-Barr Virus Lytic Switch

Rui Guo et al. Mol Cell. .

Abstract

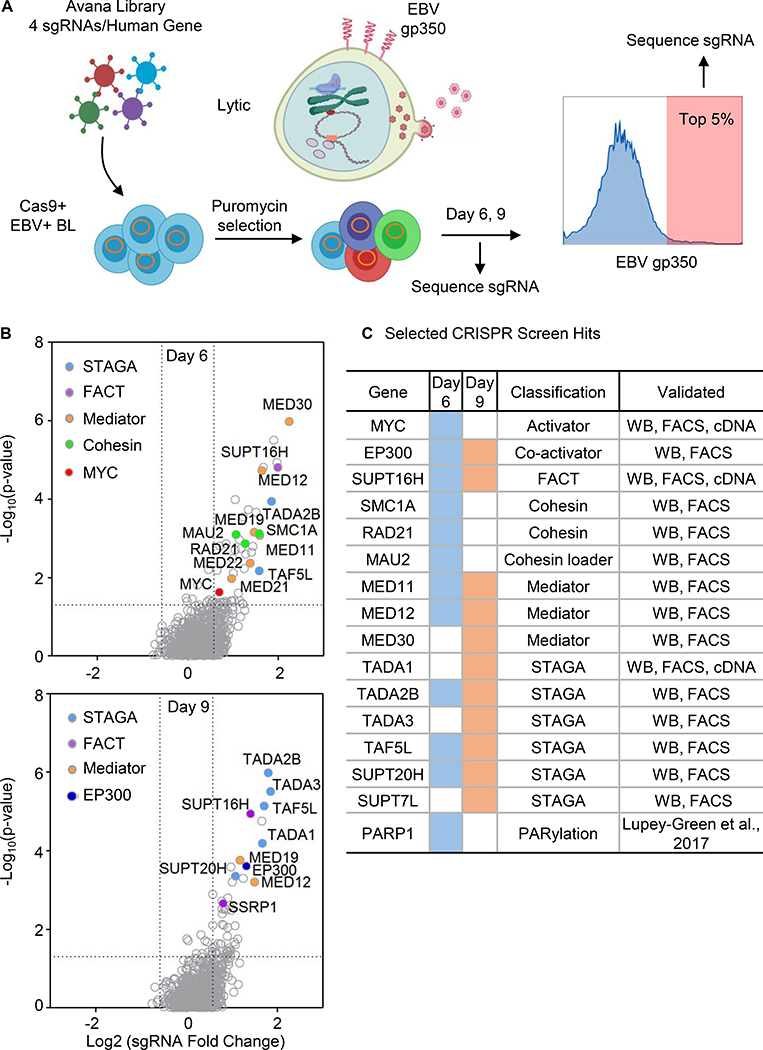
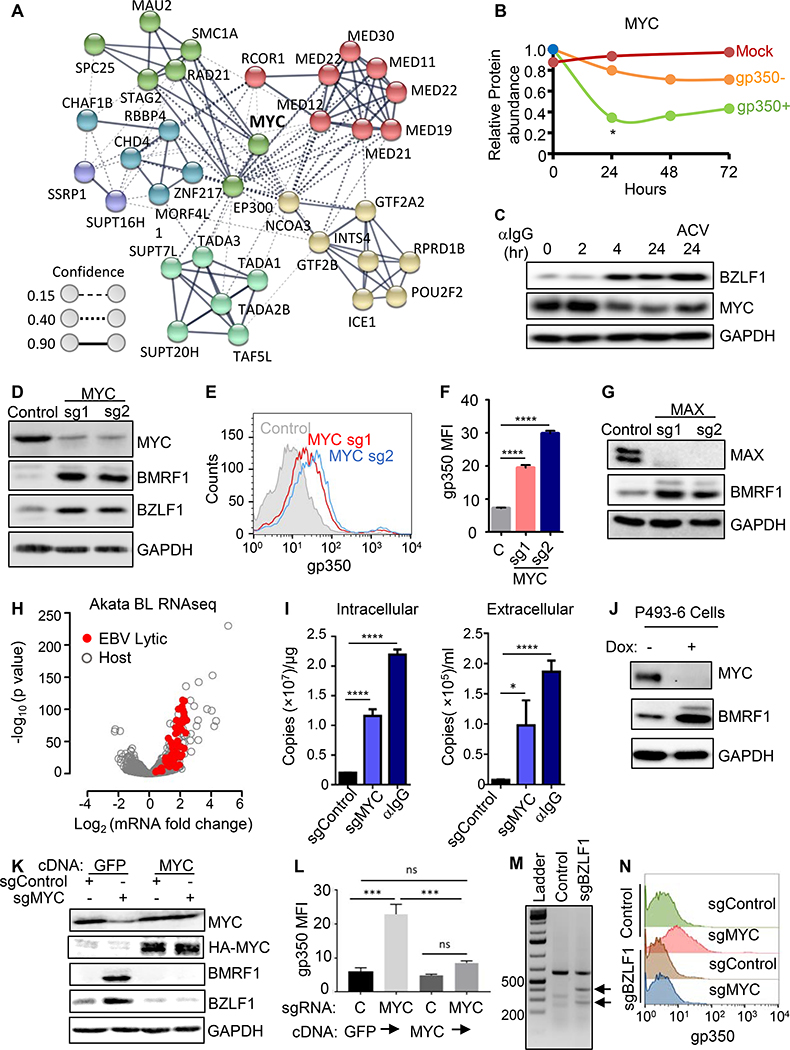
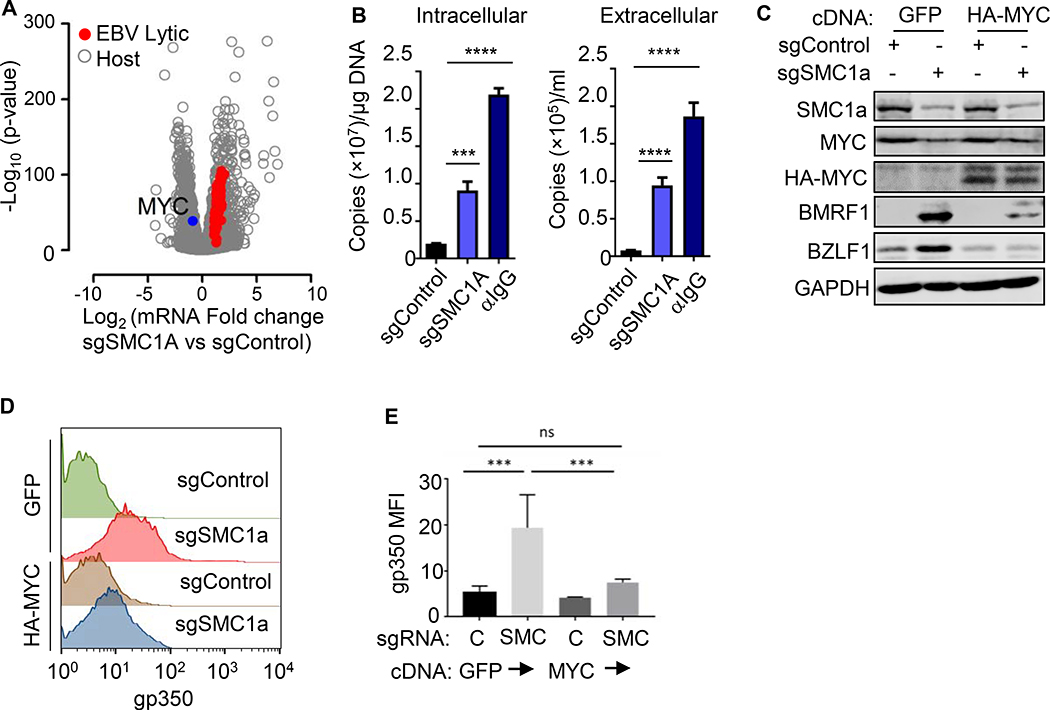
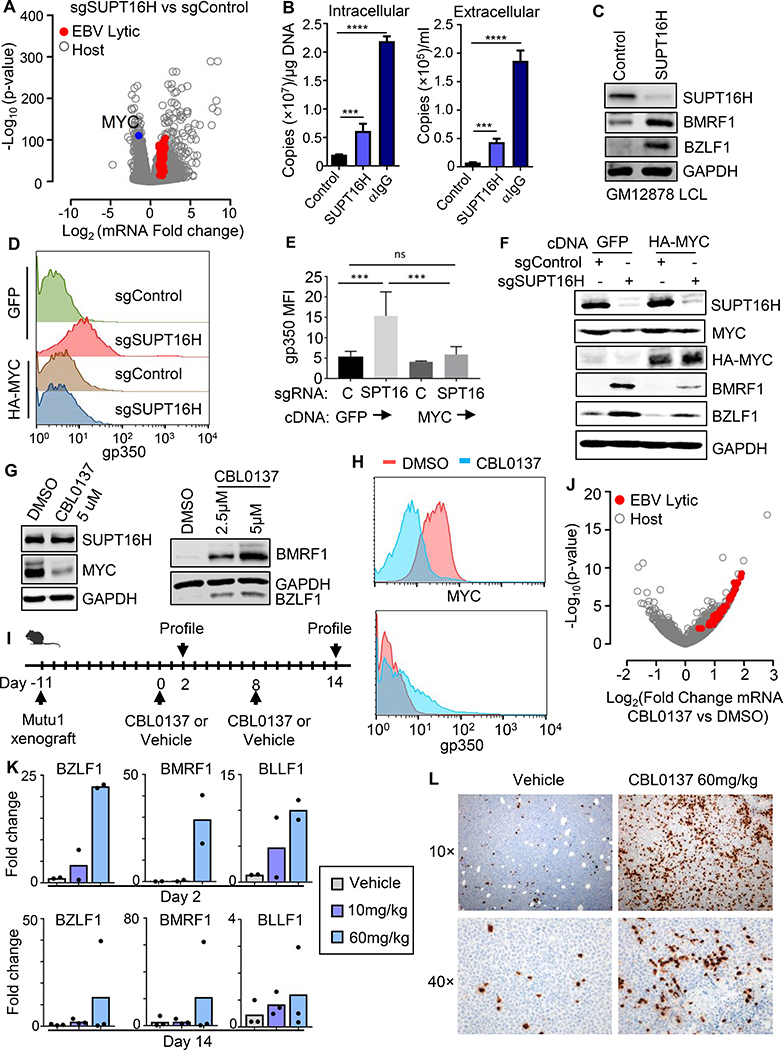
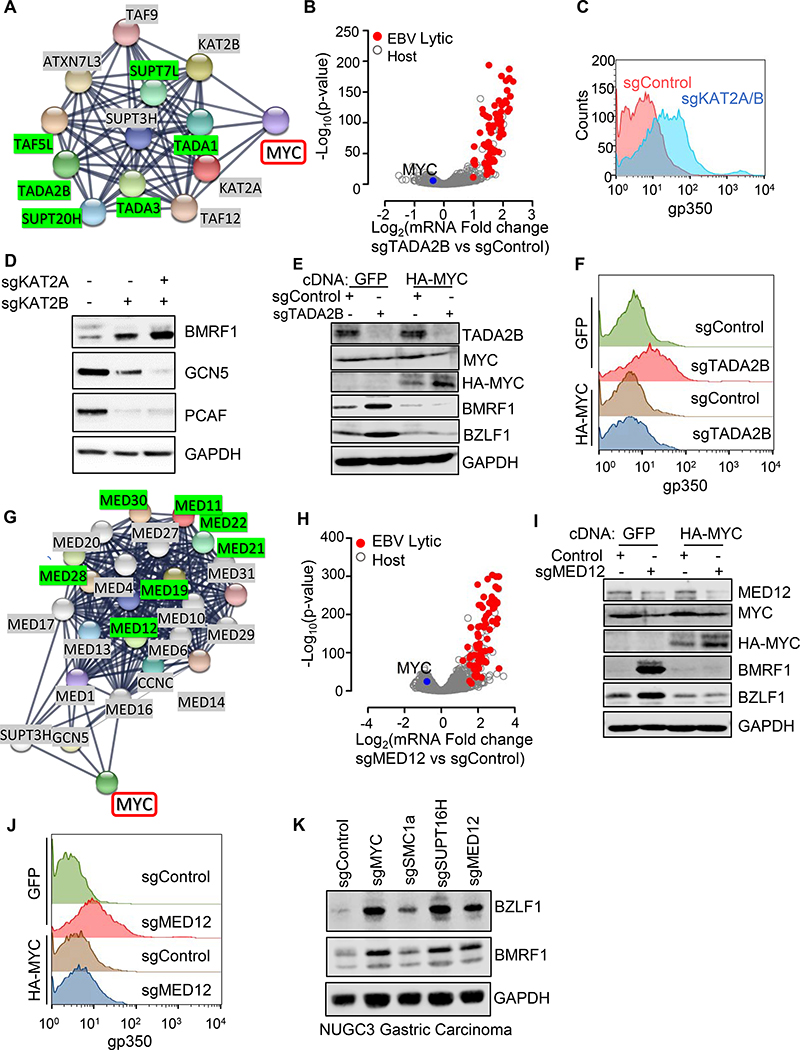
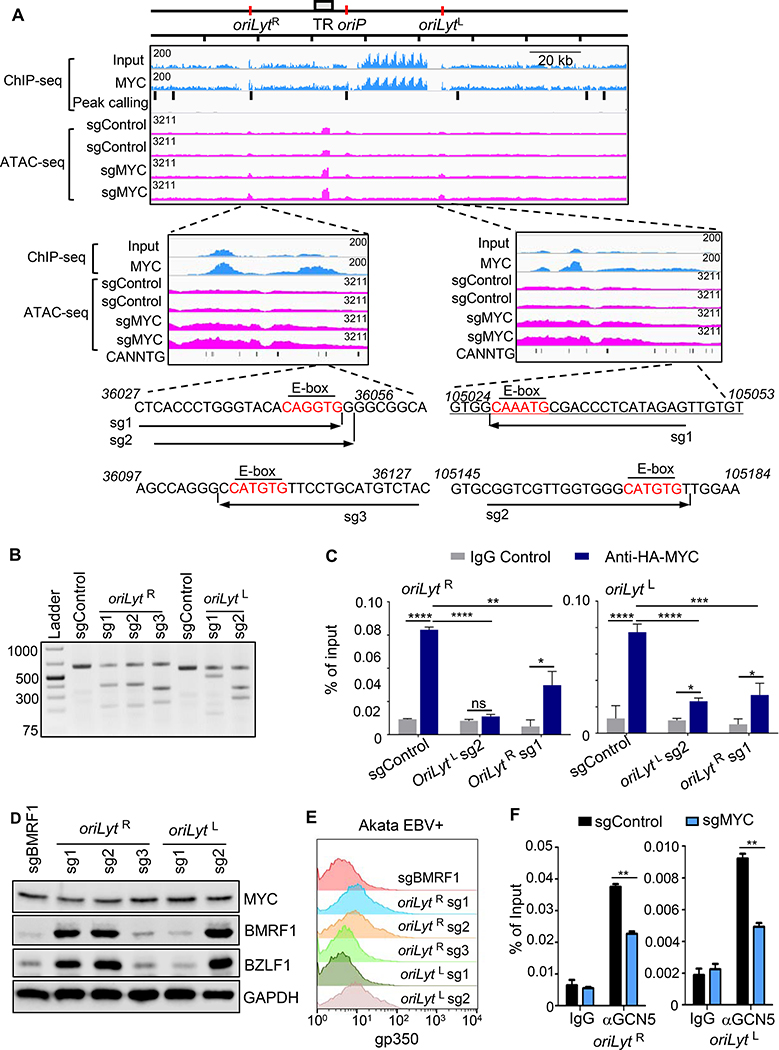
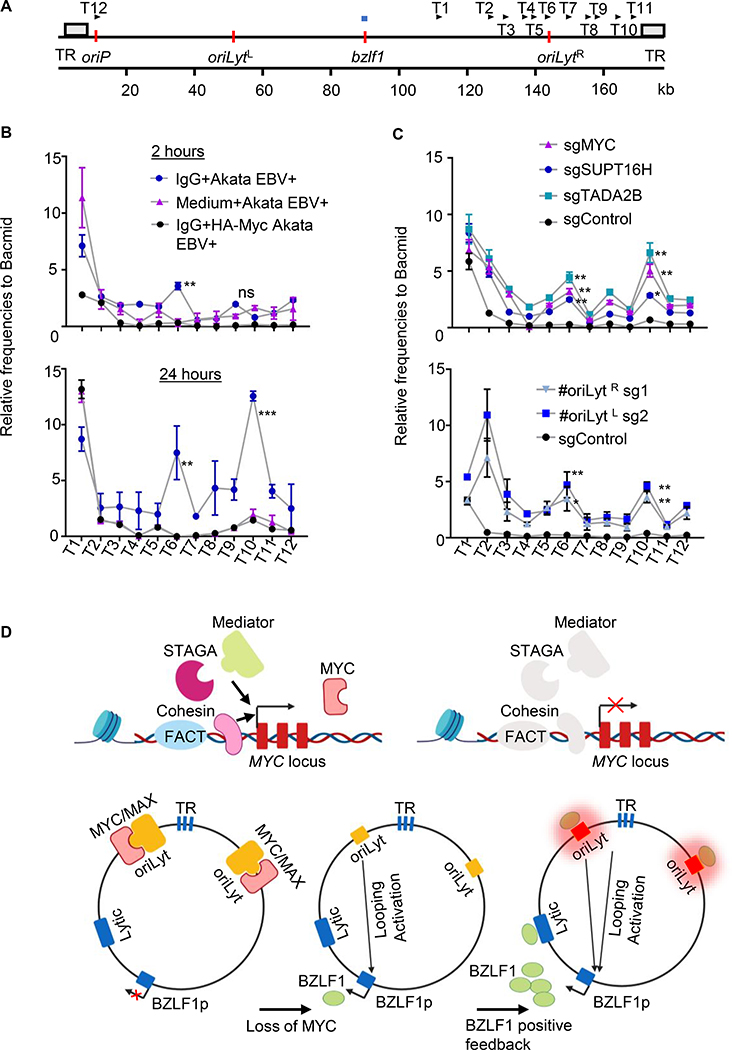
Epstein-Barr virus (EBV) is associated with multiple human malignancies. To evade immune detection, EBV switches between latent and lytic programs. How viral latency is maintained in tumors or in memory B cells, the reservoir for lifelong EBV infection, remains incompletely understood. To gain insights, we performed a human genome-wide CRISPR/Cas9 screen in Burkitt lymphoma B cells. Our analyses identified a network of host factors that repress lytic reactivation, centered on the transcription factor MYC, including cohesins, FACT, STAGA, and Mediator. Depletion of MYC or factors important for MYC expression reactivated the lytic cycle, including in Burkitt xenografts. MYC bound the EBV genome origin of lytic replication and suppressed its looping to the lytic cycle initiator BZLF1 promoter. Notably, MYC abundance decreases with plasma cell differentiation, a key lytic reactivation trigger. Our results suggest that EBV senses MYC abundance as a readout of B cell state and highlights Burkitt latency reversal therapeutic targets.

Keywords: DNA looping; MYC; herpesvirus; latency reversal; lytic reactivation; tumor virus.


Conflict of interest statement

Declaration of Interests L.G.-R. is a consultant for Janssen, ADC Therapeutics. C.J.F. and F.C. are the employees of Cell Signaling Technologies.

Figures

Figure. 1
Figure. 1. CRISPR Screen for Host Suppressors of EBV Lytic Reactivation.
(A) CRISPR screen workflow. Cas9+ P3HR-1 were transduced with the Avana sgRNA library and sorted for the top 5% cells with plasma membrane (PM) EBV lytic antigen gp350 expression. Lentivirus-integrated sgRNA abundances from input versus sorted cells were quantitated. (B) Volcano plots showing the -Log10 (p-value) and Log2 fold-change of sgRNA abundance in input versus Day 6 (top) or Day 9 output (bottom). Selected screen hit categories are highlighted. (C) Selected screen hits organized by category. Day 6 and 9 hits are indicated by blue versus orange coloring, respectively. Screen hit validation are indicated. PARP1 was reported as a repressor of EBV lytic reactivation (Lupey-Green et al., 2017). See also Figure S1.
Figure 2.
Figure 2.. MYC is a Major Repressor of EBV Lytic Antigen Expression in BL cells.
(A) STRING network analysis (Szklarczyk et al., 2017) of selected hits, centered on MYC. Edges represent protein-protein associations. Confidence scores, which are scaled between 0–1, indicate the strength of data support. Confidence score values indicate the estimated likelihood that a given interaction is biologically meaningful, specific and reproducible. (B) Relative MYC protein abundances of P3HR-1 mock-induced (red) or induced for lytic activation by addition of 4-hydroxytamoxifen, which activates nuclear translocation of a conditional BZLF1 allele. MYC abundances in 4HT-treated and FACSorted gp350+ (green) versus negative (orange) cells are shown. p < 0.05, data are from (Ersing et al., 2017). (C) Immunoblot analysis of whole cell lysates (WCL) from EBV+ Akata BL with anti-human IgG (αIgG, 10μg/ml) for the indicated hours (hr), with acyclovir (100 μg/ml) as shown. (D) Immunoblots of WCL from Akata cells with control or MYC sgRNAs. (E) FACS analysis of plasma membrane (PM) gp350 expression in Akata with indicated sgRNAs. (F) Mean + stand deviation (SD) PM gp350 mean fluorescence intensity (MFI) from n=3 replicates of Akata, as in (E). **** p < 0.0001. (G) Immunoblots of Akata with indicated sgRNAs. (H) Volcano plot comparing RNAseq values from Akata with control or MYC sgRNAs. -Log10 (p-value) and Log2 (mRNA abundance fold change) from n=3 replicates. Significantly changed EBV lytic genes shown in red. (I) qRT-PCR of EBV intracellular or DNAse-treated extracellular genome copy number from Akata with control or MYC sgRNA. Mean + SD values from n=3 replicates are shown. ****p < 0.0001, ***p < 0.001. (J) Immunoblots of WCL from p493–6 after 24 hours of vehicle or doxycycline (1 μg/ml). See also Fig S2E. (K) Immunoblot analysis of WCL from Akata expressing GFP or HA-tagged MYC and the indicated sgRNAs. (L) Mean + SD PM gp350 MFI values from n=3 replicates of Akata with indicated cDNAs and sgRNAs, as in (K). *** p < 0.001. (M) T7E1 analysis of Cas9-mediated BZLF1 editing. Representative T7E1 nuclease-treated PCR products are shown. (N) PM gp350 abundances in Akata with indicated sgRNAs. Blots are representative of n=3 replicates. See also Figure S2.
Figure 3.
Figure 3.. The Cohesin SMC1 Supports MYC Expression and Restricts EBV Lytic Genes
(A) Volcano plot of -Log10 (p-value) and Log2 (mRNA abundance fold change) in Akata with control or SMC1A sgRNAs from n=3 RNA-seq. Upregulated EBV lytic gene (red) and downregulated MYC (blue) are shown. (B) qRT-PCR of EBV intracellular versus DNAse-treated extracellular genome copy number from Akata with control or SMC1A sgRNA at Day 6 post-transduction or 48h post anti-IgG stimulation (10 μg/ml). Mean + SD values from n=3 replicates are shown; ****p < 0.0001, ***p < 0.001. (C) Immunoblot analysis of WCL from Akata with the indicated GFP, HA-MYC and sgRNA expression. (D) FACS of PM gp350 levels in Akata with the indicated GFP, HA-MYC and sgRNA expression. (E) Mean + SD values of PM gp350 MFI from n=3 replicates of Akata, as in 3D. ****p < 0.0001. See also Figure S3.
Figure 4
Figure 4. FACT-driven MYC Expression is a Druggable Target for Lytic Reactivation
(A) Volcano plot of -Log10 (p-value) and Log2 (mRNA fold-change) in Akata cells that express control or SUPT16H sgRNAs, using triplicate RNA-seq datasets. Values for significantly upregulated EBV lytic gene (red) and downregulated MYC (blue) mRNAs are highlighted. (B) qRT-PCR analysis of EBV intracellular vs DNAse-treated extracellular genome copy number from Akata cells expressing control or SUPT16H sgRNAs at Day6 post lentivirus transduction or 48h post anti-IgG stimulation (10 ug/ml). Mean + SD values from n=3 replicates are shown. ****p < 0.0001, ***p < 0.001. (C) Immunoblots of WCL from GM12878 LCLs expressing control or independent SUPT16H sgRNAs. (D) FACS plots of PM gp350 abundance in Akata cells stably expressing GFP or HA-MYC cDNAs, together with control or SUPT16H sgRNAs, as indicated. (E) Mean + SD PM gp350 MFI in Akata cells stably expressing GFP or HA-MYC cDNAs, together with control or SUPT16H sgRNAs, as indicated. Data are from n=3 replicates. ***p < 0.001; ns, not significant. (F) Immunoblot analysis of WCL from Akata cells stably expressing cDNAs encoding GFP or HA-MYC together with control or SUPT16H sgRNAs, as indicated. (G) Immunoblot analysis of WCL from MUTU1 cells which were treated with DMSO or the indicated concentrations of the FACT inhibitor CBL0137 for 6 hours, washed, and then cultured for an additional 42 hours. (H) FACS plots showing MYC or PM gp350 abundances in MUTU I BL treated with DMSO control or 5 μM CBL0137 for 48 hours, as indicated. (I) Schematic of murine BL xenograft experiments. Shown are the timepoints at which MUTU I xenografts were planted, at which vehicle control or CBL0137 were dosed, and when tumors were explanted for EBV lytic gene analysis. (J) Volcano plot of -Log10 (p-value) vs Log2 (mRNA fold change) in xenograft tumors from DMSO or CBL0137 60 mg/kg IV tail vein injection. Data are from triplicate RNA-seq datasets. Values for upregulated EBV lytic genes (red) are highlighted. (K) qRT-PCR analysis of EBV lytic gene mRNA abundances in tumors explanted 48 hours after DMSO, CBL0137 10 mg/kg or 60 mg/kg IV tail vein injection. (L) Immunohistochemistry analysis showing BZLF1 expression in tumors explanted 48 hours following DMSO or CBL0137 60 mg/kg intravenous tail vein injection. C, F, G and H are representative of n=3 replicates. See also Figure S4.
Figure 5.
Figure 5.. STAGA and Mediator Support MYC and Restrict EBV Lytic Expression in BL
(A) STRING analysis of STAGA and MYC interactions. Edges represent protein-protein associations. STAGA complex screen hits highlighted in green. See also Figure S5A. (B) Volcano plot of -Log10 (p-value) vs Log2 (mRNA fold-change) in Akata with indicated sgRNAs using n=3 RNAseq. Significantly upregulated EBV lytic gene (red) and downregulated MYC (blue) are shown. (C) FACS PM gp350 levels in Akata with the indicated sgRNAs from n=3 replicates. (D) Immunoblot of WCL from Akata with indicated sgRNA. (E) Immunoblot of Akata with indicated cDNA and sgRNA. (F) FACS plots of PM gp350 levels in Akata with indicated cDNA and sgRNA. (G) STRING analysis of interactions between Mediator and MYC. Mediator screen hits highlighted in green. See also Figure S5A. (H) Volcano plot of -Log10 (p-value) vs Log2 (mRNA fold-change) in Akata with indicated sgRNAs using n=3 RNAseq. Significantly upregulated EBV lytic gene (red) and downregulated MYC (blue) are shown. (I) Immunoblot analysis of Akata with indicated cDNA and sgRNA. (J) FACS PM gp350 abundances in Akata with indicated cDNA and sgRNA. (K) Immunoblot analysis of WCL from Cas9+ NUGC3 gastric carcinoma cells expressing the indicated sgRNAs. Blots are representative of n=3 replicates. See also Figure S5 and S6.
Figure 6
Figure 6. MYC Occupancy of EBV Genome oriLyt E-Box Sites Maintains Latency in BL
(A) ChIP-seq analysis of EBV genome MYC occupancy and ATAC-seq analysis of effects of MYC depletion on EBV genomic accessibility. Shown are Daudi BL EBV genome input and MYC ChIP-seq tracks. Background-subtracted peak calling identified seven significant EBV genomic peaks, highlighted by black bars. Values at top left indicate track heights. n=2 ATAC-seq tracks from Akata with indicated sgRNAs and treated with acyclovir (100 μg/ml). Zoomed tracks of oriLyt regions are shown. Akata EBV DNA sequences of sgRNA-targeted regions are shown, with E-boxes in red. (B) T7E1 assay of Cas9 oriLyt region editing. Representative T7E1 nuclease-treated PCR products are shown. (C) ChIP-qPCR of MYC oriLyt region occupancy. Ig-control or anti-HA ChIP was performed on chromatin from Akata with HA-MYC and indicated sgRNA expression. qPCR was done with E-box regions primers. Mean + SD are shown for n=3 replicates. ****p < 0.0001, **p < 0.001, **p<0.01. (D) Immunoblot of WCL from Akata with indicated sgRNAs. Blot is representative of n=3. (E) FACS PM gp350 abundances in Akata with indicated sgRNAs. (F) ChIP-qPCR analysis of STAGA subunit GCN5 occupancy at oriLyt regions. αGCN5 ChIP was performed on chromatin from Akata with control or MYC sgRNAs, followed by qPCR using primers specific for oriLyt E-box regions. Mean + SD are shown for n=3 replicates. **p<0.01. See also Figure S7.
Figure 7
Figure 7. MYC Loss or B-cell Receptor Stimulation Induces OriLyt looping to BZLF1.
(A) Schematic diagram depicting chromatin conformation capture (3C) assay anchor and testing (T) primers. BZLF1 promotor region anchor primer shown by horizontal blue bar above the map. Positions of the 12 T primers are shown by arrows above the map. TR regions are depicted as grey boxes, whereas oriP, BZLF1 and oriLyt regions are depicted by vertical orange bars. Kilobase (kb). (B) 3C assay quantitation of interaction frequency between the BZLF1 anchor primer and test primer regions in Akata with control (blue) or HA-MYC (black), following anti-IgG crosslinking for 2 or 24 hours. Values from mock-induced Akata (pink) are shown. Mean + SD values from n=3. 3C assay frequencies were normalized by Bacmid input values. ** p<0.01, *** p<0.001. (C) 3C assay of interaction frequency between BZLF1 anchor primer and test primer regions in Akata with the indicated control (black), MYC (pink), SUPT16H (blue) or TADA2B (turquoise) sgRNAs (top graph), or in Akata expressing oriLyt region E-box targeting sgRNAs (bottom graph). Mean + SEM values from n=3 replicates 3C assay frequencies were normalized by Bacmid input values. *, p<0.05; ** p<0.01. (D) Model of MYC as a key repressor of EBV lytic reactivation. FACT, Cohesin, STAGA and Mediator are important for MYC expression. MYC/MAX heterodimers bind to oriLyt regions and maintain EBV latency by preventing oriLyt association with the BZLF1 promoter. MYC depletion causes DNA looping, which juxtaposes oriLyt and TR regions with the BZLF1 promoter. Newly induced BZLF1 binds to oriLyt, converting it into a strong enhancer, which then drives high level BZLF1 expression and triggers early lytic gene expression.

References

    1. Allen BL, and Taatjes DJ (2015). The Mediator complex: a central integrator of transcription. Nature reviews Molecular cell biology 16, 155–166. - PMC - PubMed
    1. Arvey A, Tempera I, and Lieberman PM (2013). Interpreting the Epstein-Barr Virus (EBV) epigenome using high-throughput data. Viruses 5, 1042–1054. - PMC - PubMed
    1. Babcock GJ, Hochberg D, and Thorley-Lawson DA (2000). The Expression Pattern of Epstein-Barr Virus Latent Genes In Vivo Is Dependent upon the Differentiation Stage of the Infected B Cell. Immunity 13, 497–506. - PubMed
    1. Belotserkovskaya R, Oh S, Bondarenko VA, Orphanides G, Studitsky VM, and Reinberg D (2003). FACT facilitates transcription-dependent nucleosome alteration. Science (New York, NY) 301, 1090–1093. - PubMed
    1. Bergbauer M, Kalla M, Schmeinck A, Gobel C, Rothbauer U, Eck S, Benet-Pages A, Strom TM, and Hammerschmidt W (2010). CpG-methylation regulates a class of Epstein-Barr virus promoters. PLoS pathogens 6, e1001114. - PMC - PubMed

Publication types

MeSH terms

Substances