. 2020 Jul 21;142(3):244-258.
doi: 10.1161/CIRCULATIONAHA.120.046038. Epub 2020 Apr 22.

Bone Marrow Endothelial Cells Regulate Myelopoiesis in Diabetes Mellitus

Affiliations

Bone Marrow Endothelial Cells Regulate Myelopoiesis in Diabetes Mellitus

Friedrich Felix Hoyer et al. Circulation. .

Abstract

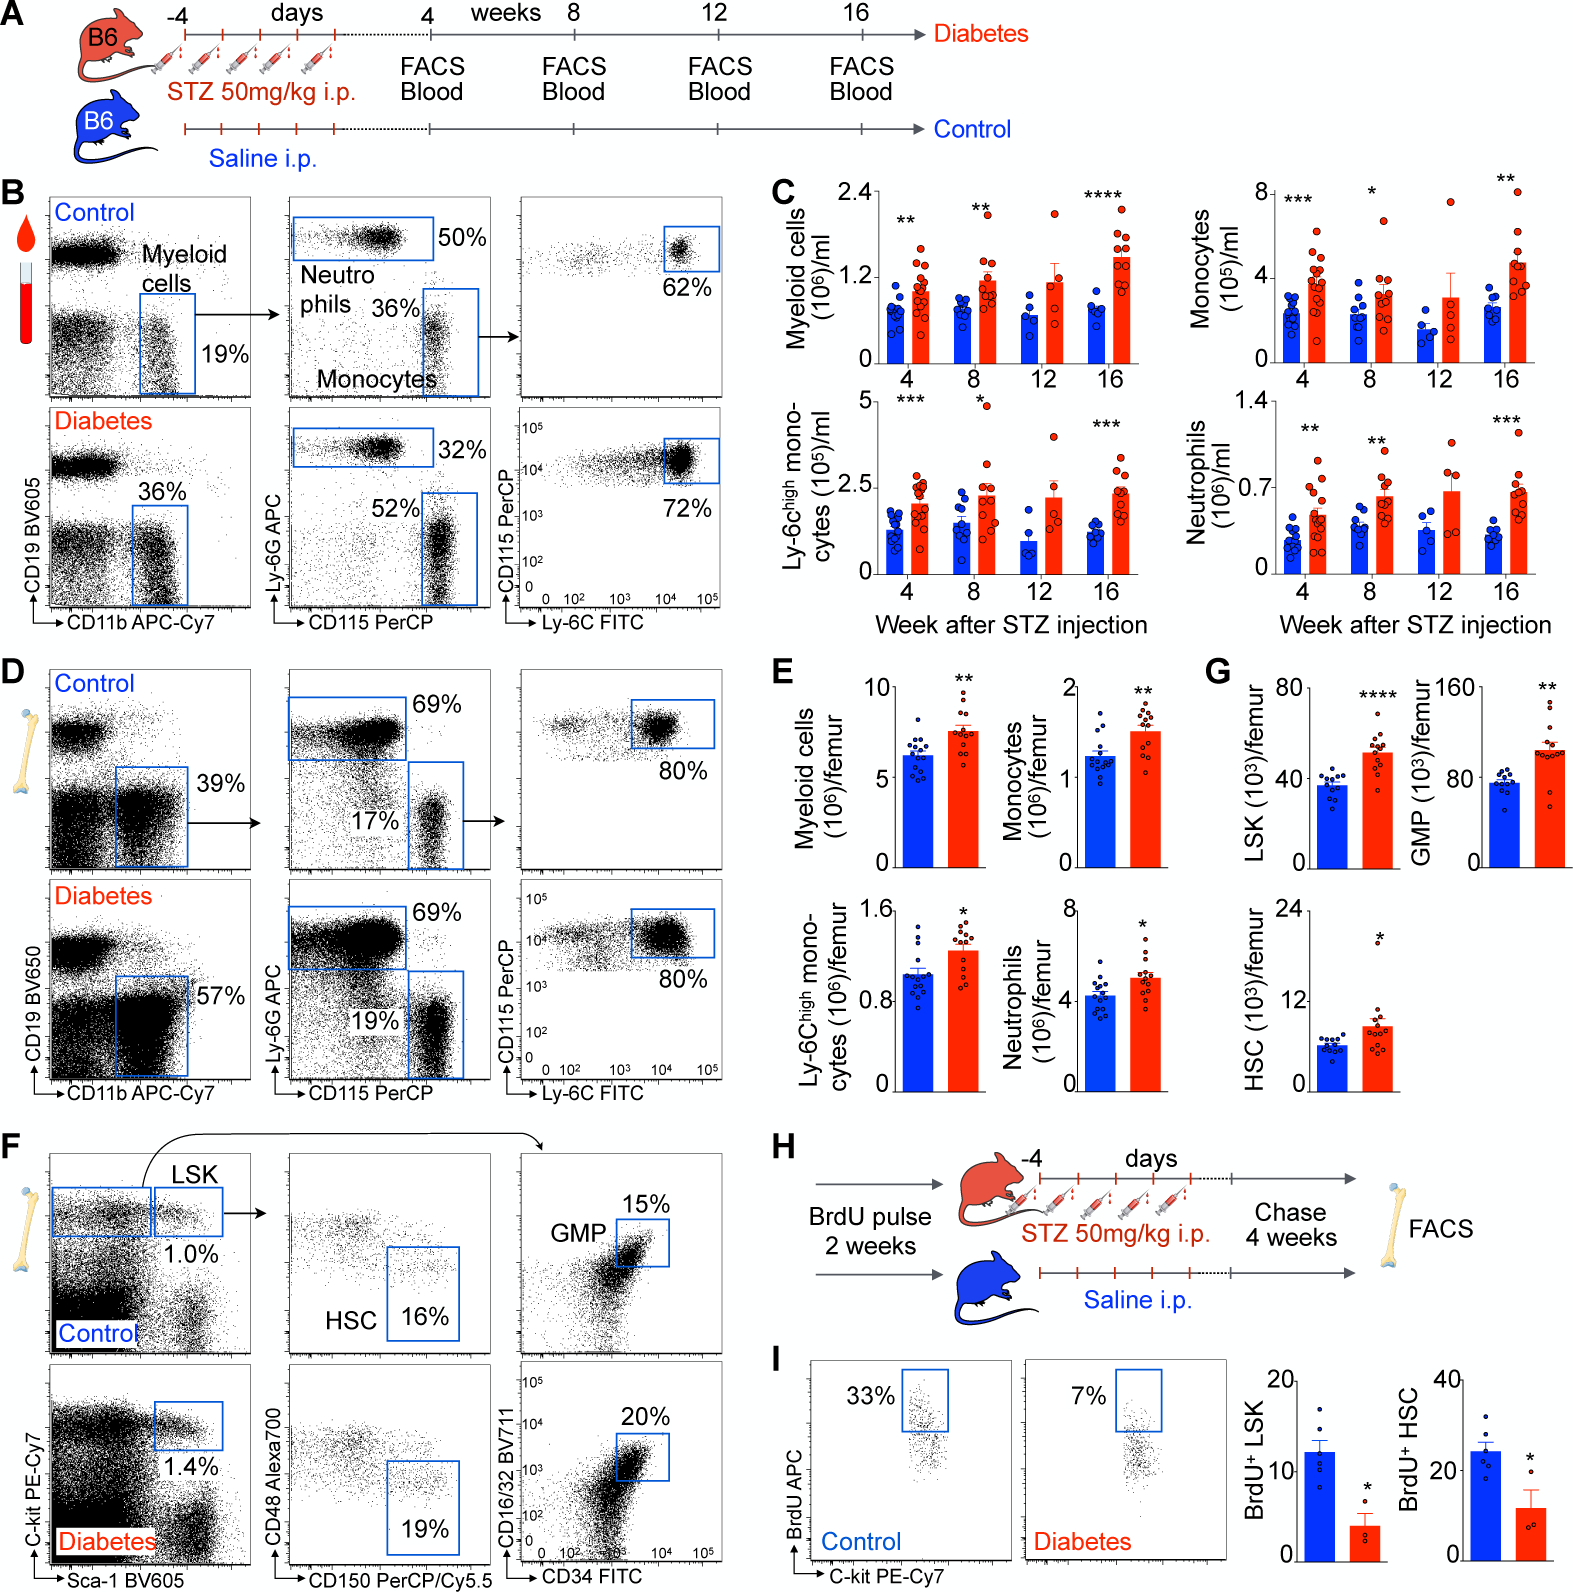
Background: Diabetes mellitus is a prevalent public health problem that affects about one-third of the US population and leads to serious vascular complications with increased risk for coronary artery disease. How bone marrow hematopoiesis contributes to diabetes mellitus complications is incompletely understood. We investigated the role of bone marrow endothelial cells in diabetic regulation of inflammatory myeloid cell production.

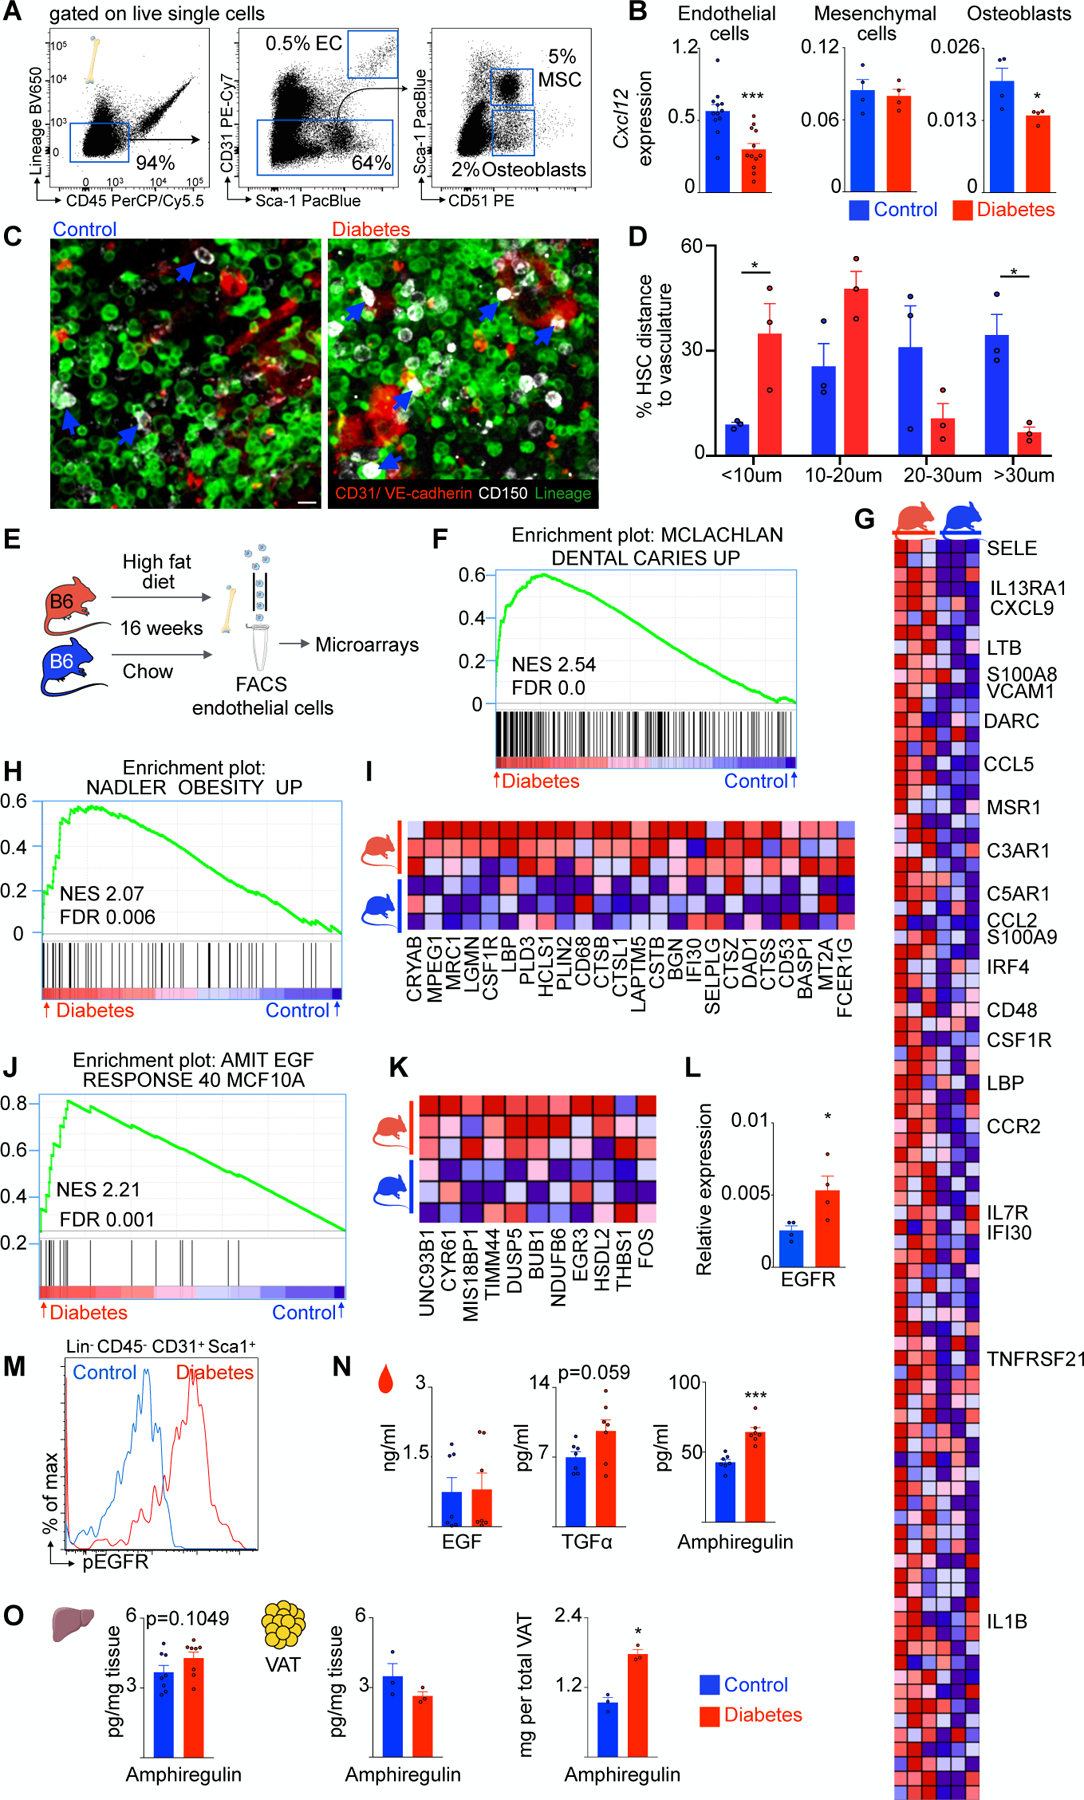
Methods: In 3 types of mouse diabetes mellitus, including streptozotocin, high-fat diet, and genetic induction using leptin-receptor-deficient db/db mice, we assayed leukocytes, hematopoietic stem and progenitor cells (HSPC). In addition, we investigated bone marrow endothelial cells with flow cytometry and expression profiling.

Results: In diabetes mellitus, we observed enhanced proliferation of HSPC leading to augmented circulating myeloid cell numbers. Analysis of bone marrow niche cells revealed that endothelial cells in diabetic mice expressed less Cxcl12, a retention factor promoting HSPC quiescence. Transcriptome-wide analysis of bone marrow endothelial cells demonstrated enrichment of genes involved in epithelial growth factor receptor (Egfr) signaling in mice with diet-induced diabetes mellitus. To explore whether endothelial Egfr plays a functional role in myelopoiesis, we generated mice with endothelial-specific deletion of Egfr (Cdh5CreEgfrfl/fl). We found enhanced HSPC proliferation and increased myeloid cell production in Cdh5CreEgfrfl/fl mice compared with wild-type mice with diabetes mellitus. Disrupted Egfr signaling in endothelial cells decreased their expression of the HSPC retention factor angiopoietin-1. We tested the functional relevance of these findings for wound healing and atherosclerosis, both implicated in complications of diabetes mellitus. Inflammatory myeloid cells accumulated more in skin wounds of diabetic Cdh5CreEgfrfl/fl mice, significantly delaying wound closure. Atherosclerosis was accelerated in Cdh5CreEgfrfl/fl mice, leading to larger and more inflamed atherosclerotic lesions in the aorta.

Conclusions: In diabetes mellitus, bone marrow endothelial cells participate in the dysregulation of bone marrow hematopoiesis. Diabetes mellitus reduces endothelial production of Cxcl12, a quiescence-promoting niche factor that reduces stem cell proliferation. We describe a previously unknown counterregulatory pathway, in which protective endothelial Egfr signaling curbs HSPC proliferation and myeloid cell production.

Keywords: atherosclerosis; diabetes mellitus; hematopoiesis; monocytes; myelopoiesis.


Figures

Figure 1.
Figure 1.. Streptozotocin-induced type 1 diabetes increases myelopoiesis.
A, Experimental outline. B, Representative flow plots and gating strategy of blood myeloid cells in control and diabetic mice. C, Quantification of blood myeloid cells, monocytes, Ly6Chigh monocytes and neutrophils over time in control (blue) and diabetic (red) mice. D, Representative flow plots and gating strategy of bone marrow leukocytes in control and diabetic mice. E, Quantification of bone marrow leukocytes in control and diabetic mice. F, Representative flow plots and gating strategy of bone marrow progenitor cells. G, Quantification of LSK, GMP and HSC in control and diabetic mice. H, Experimental design of BrdU pulse chase experiments in streptozotocin-induced diabetic and control mice. I, Representative flow plot of BrdU+ HSC and quantification of BrdU+ HSC and LSK in control and diabetic mice. Unpaired, two-tailed t-test was used for normally distributed data, two-tailed Mann-Whitney test for non-parametric data. N=3–15 mice per group. Data are mean ± s.e.m. *P<0.05, **P<0.01, ***P<0.001, ****P<0.0001.
Figure 2.
Figure 2.. High fat diet-induced type 2 diabetes increases myelopoiesis.
A, Experimental design. B, Representative flow plot and gating strategy of blood myeloid cells. C, Quantification of blood myeloid cells, monocytes, Ly6Chigh monocytes and neutrophils over time in control (blue) and diabetic (red) mice. D, Representative flow plots and gating strategy of bone marrow hematopoietic progenitor cells. E, Quantification of LSK, GMP, LRP and HSC in control and diabetic mice. F, Experimental design of BrdU pulse chase experiments in high fat diet-induced diabetic and control mice. G, Representative flow plot of BrdU+ HSC and quantification of BrdU+ HSC and LSK in control and diabetic mice. H, Representative flow plots for GMP Annexin-V staining. I, Apoptosis quantification for LSK, GMP and HSC in control and diabetic mice. Unpaired, two-tailed t-test was used for normally distributed data, two-tailed Mann-Whitney test for non-parametric data. N=5–12 mice per group. Data are mean ± s.e.m. *P<0.05, **P<0.01, ***P<0.001.
Figure 3.
Figure 3.. Diabetes induces endothelial cell Egfr signaling.
A, Representative flow plots and FACS gating for bone marrow endothelial cells, mesenchymal stem cells and osteoblasts. B, CXCL12 mRNA expression levels in FACS-isolated cells of control and type 2 diabetes mice. C, Representative immunofluorescence images of control and diabetic marrow. CD150+ HSC are white, CD31+ VE-cadherin+ endothelial cells are red, lineage+ cells are green. Blue arrows point at HSC. Scale bar is 10μm. D, Distance of HSC to endothelial cells. E, Experimental design for transcriptome analysis. F, Enrichment of gene set MCLACHLAN_DENTAL_CARIES_UP. G, Heatmap of enriched genes from (D). H, Enrichment of gene set NADLER_OBESITY_UP. I, Heatmap of enriched genes from (F). J, Egfr gene set (AMIT_EGF_RESPONSE_40_MCF10A). K, Heatmap of enriched genes from (H). L, Egfr mRNA levels in bone marrow endothelial cells of control and diabetic mice. M, Representative flow histogram showing enhanced phosphorylation of EGF-receptor in bone marrow endothelial cells of diabetic mice. N, Different Egfr ligands in serum of control and diabetic mice. O, Amphiregulin concentration in liver tissue and visceral adipose tissue as well as total amphiregulin amount per visceral adipose tissue. Unpaired, two-tailed t-test was used for normally distributed data, two-tailed Mann-Whitney test for non-parametric data. N=3–12 mice per group. Data are mean ± s.e.m. *P<0.05, ***P<0.001.
Figure 4.
Figure 4.. Endothelial cell Egfr regulates myelopoiesis.
A, Representative flow plots of blood myeloid cells in Cdh5Cre Egfrfl/fl and control mice on high fat diet. B, Quantification of blood myeloid cells, monocytes, Ly6Chigh monocytes and neutrophils. C, Representative flow plots of bone marrow hematopoietic progenitor cells. D, Quantification of LSK, GMP and HSC. E, Representative flow plots of intracellular Ki-67/ PI staining of HSC and analysis of cell cycle G0, G1 and SG2M. F, Bone marrow endothelial cells of Cdh5Cre Egfrfl/fl and control mice on high fat diet were FAC-sorted. Niche factors were determined by qPCR. Unpaired, two-tailed t-test was used for normally distributed data, two-tailed Mann-Whitney test for non-parametric data. N=3–10 mice per group. Data are mean ± s.e.m. *P<0.05, **P<0.01, ***P<0.001.
Figure 5.
Figure 5.. Diabetic skin wounds in Cdh5Cre Egfrfl/fl mice.
A, Experimental design. B, Representative flow plots of skin wounds in control and Cdh5Cre Egfrfl/fl mice. C, Quantification of myeloid cells in diabetic skin wounds of control and Cdh5Cre Egfrfl/fl mice. D, Representative skin wound images of control and Cdh5Cre Egfrfl/fl mice. E, Skin wound healing in Cdh5Cre Egfrfl/fl and control mice over time. Unpaired t-test was used for normally distributed data, Mann-Whitney test for non-parametric data. N=4–10 mice per group. Data are mean ± s.e.m. *P<0.05, **P<0.01.
Figure 6.
Figure 6.. Enhanced myelopoiesis in Cdh5Cre Egfrfl/fl mice accelerates atherosclerosis.
A, Experimental design. Atherosclerosis was induced via AAV2/8 PCSK9 injection. B, Flow plots of blood myeloid cells in Cdh5Cre Egfrfl/fl and control mice on high fat diet. C, Quantification of blood myeloid cells, monocytes, Ly6Chigh monocytes and neutrophils. D, Representative flow plots of bone marrow hematopoietic progenitor cells. E, Quantification of LSK, GMP and HSC. F, Representative flow plots and gating strategy of aortic myeloid cells. G, Quantification of aortic myeloid cells. H, Representative oil red o staining of aortic roots and quantification of atherosclerotic lesion. Unpaired t-test was used for normally distributed data, Mann-Whitney test for non-parametric data. N=5–8 mice per group. Data are mean ± s.e.m. *P<0.05, **P<0.01. Scale bar 500μm.
Figure 7.
Figure 7.. Human diabetes and summary cartoon.
A, Representative flow plots and gating strategy for human bone marrow endothelial cells. B, Bone marrow endothelial cell EGFR phosphorylation in non-diabetic and diabetic patients, as assessed with intracellular phospho-flow cytometry. C, HSC retention factor transcript level in bone marrow endothelial cells from non-diabetic and diabetic patients. Unpaired one-tailed t-test was used for normally distributed data, one-tailed Mann-Whitney test for non-parametric data. n=3–4 per group, *P<0.05. D, Summary cartoon.

Comment in

References

    1. Rowley WR, Bezold C, Arikan Y, Byrne E, Krohe S. Diabetes 2030: Insights from Yesterday, Today, and Future Trends. Popul Health Manag. 2017;20:6–12. - PMC - PubMed
    1. Centers for Disease Control and Prevention. National Diabetes Statistics Report, 2020. Atlanta, GA: Centers for Disease Control and Prevention, US Department of Health and Human Services; 2020.
    1. Zheng Y, Ley SH, Hu FB. Global aetiology and epidemiology of type 2 diabetes mellitus and its complications. Nat Rev Endocrinol. 2018;14:88–98. - PubMed
    1. Booth GL, Kapral MK, Fung K, Tu JV. Relation between age and cardiovascular disease in men and women with diabetes compared with non-diabetic people: a population-based retrospective cohort study. Lancet. 2006;368:29–36. - PubMed
    1. DeFronzo RA, Ferrannini E, Groop L, Henry RR, Herman WH, Holst JJ, Hu FB, Kahn CR, Raz I, Shulman GI et al. Type 2 diabetes mellitus. Nat Rev Dis Primers. 2015;1:15019. - PubMed

Publication types