Review
. 2020 Apr 7:14:300.
doi: 10.3389/fnins.2020.00300. eCollection 2020.

Frequency-Domain Techniques for Cerebral and Functional Near-Infrared Spectroscopy

Affiliations
Review

Frequency-Domain Techniques for Cerebral and Functional Near-Infrared Spectroscopy

Sergio Fantini et al. Front Neurosci. .

Abstract

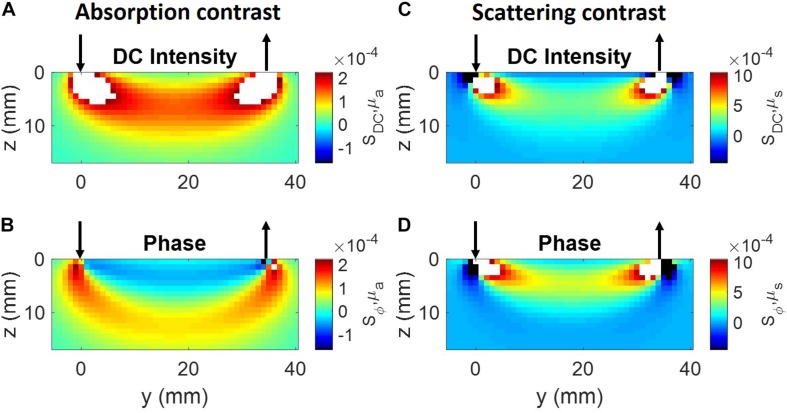
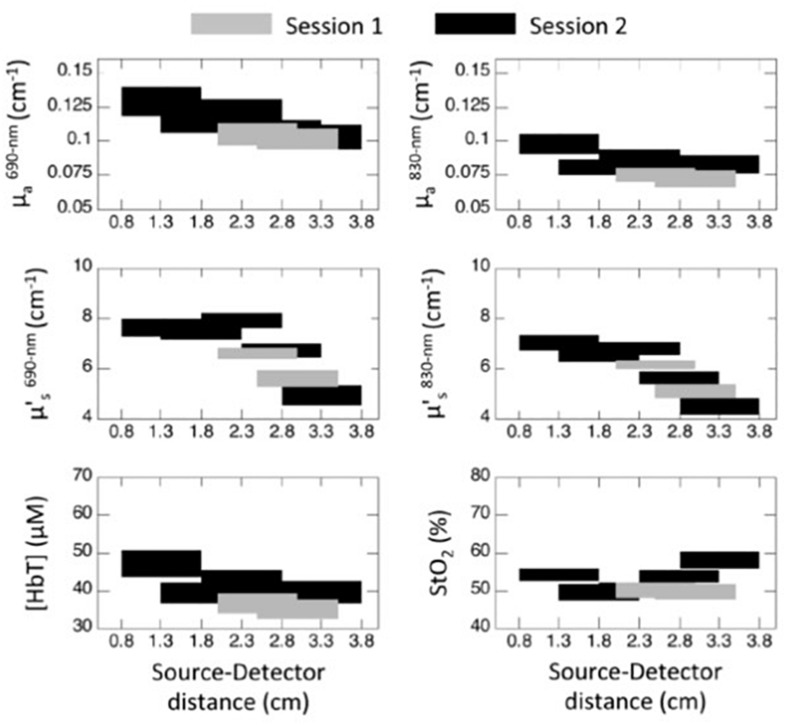
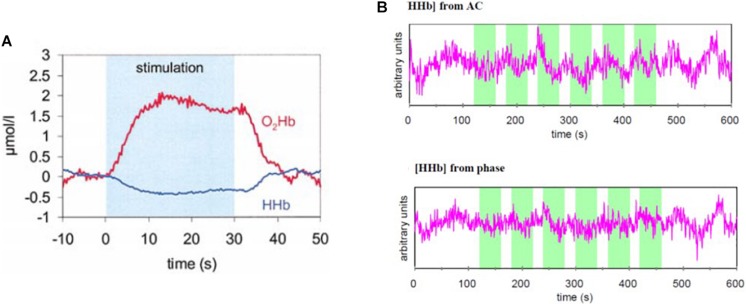
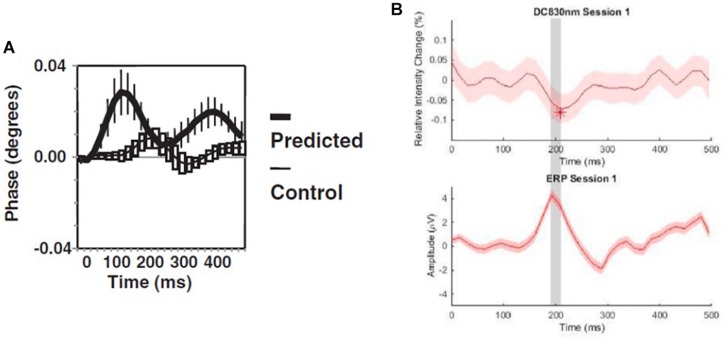
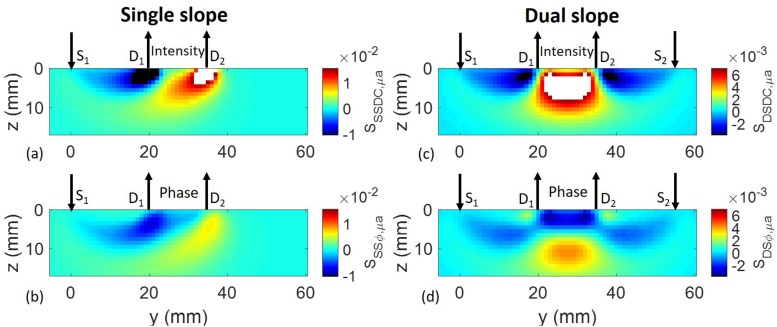
This article reviews the basic principles of frequency-domain near-infrared spectroscopy (FD-NIRS), which relies on intensity-modulated light sources and phase-sensitive optical detection, and its non-invasive applications to the brain. The simpler instrumentation and more straightforward data analysis of continuous-wave NIRS (CW-NIRS) accounts for the fact that almost all the current commercial instruments for cerebral NIRS have embraced the CW technique. However, FD-NIRS provides data with richer information content, which complements or exceeds the capabilities of CW-NIRS. One example is the ability of FD-NIRS to measure the absolute optical properties (absorption and reduced scattering coefficients) of tissue, and thus the absolute concentrations of oxyhemoglobin and deoxyhemoglobin in brain tissue. This article reviews the measured values of such optical properties and hemoglobin concentrations reported in the literature for animal models and for the human brain in newborns, infants, children, and adults. We also review the application of FD-NIRS to functional brain studies that focused on slower hemodynamic responses to brain activity (time scale of seconds) and faster optical signals that have been linked to neuronal activation (time scale of 100 ms). Another example of the power of FD-NIRS data is related to the different regions of sensitivity featured by intensity and phase data. We report recent developments that take advantage of this feature to maximize the sensitivity of non-invasive optical signals to brain tissue relative to more superficial extracerebral tissue (scalp, skull, etc.). We contend that this latter capability is a highly appealing quality of FD-NIRS, which complements absolute optical measurements and may result in significant advances in the field of non-invasive optical sensing of the brain.

Keywords: brain activation; cerebral hemodynamics; depth sensitivity; diffuse optical imaging; fast optical signal; frequency domain; near-infrared spectroscopy.


Figures

FIGURE 1
FIGURE 1
Sensitivity maps in the (y.z) plane, where the tissue boundary is the x-y plane, the source (arrow pointing down) is at (0,0,0), and the detector (arrow pointing up) is at (0, 35 mm, 0). (A) DC Intensity, absorption contrast; (B) phase, absorption contrast; (C) DC intensity, scattering contrast, (D) phase, scattering contrast. The color bar labels in panels (A,C) indicate the sensitivity of DC intensity with respect to absorption (SDC,μa) and reduced scattering coefficients (SDC,μs), respectively. The color bar labels in panels (B,D) indicate the sensitivity of phase with respect to absorption (Sϕ,μa) and reduced scattering coefficients (Sϕ,μs), respectively. White and black in the color maps indicate values greater than the maximum or smaller than the minimum, respectively, of the color bars.
FIGURE 2
FIGURE 2
Absolute absorption coefficients (μa: top panels) and reduced scattering coefficients (μs: middle panels) measured with multi-distance FD-NIRS at 690 nm (left panels) and 830 nm (right panels) on the forehead of 16 elderly subjects (85 ± 6 years old) using diffusion theory for a homogeneous semi-infinite medium. From the absorption coefficients at two wavelengths, absolute values of concentration of hemoglobin ([HbT]) and tissue saturation (StO2) were obtained (bottom panels). The blocks represent the mean ± standard error (vertical dimension) of the measurements performed at the range of distances corresponding to the horizontal range. The black and gray blocks correspond to two measurement sessions performed on the same group of 16 subjects 5 months apart. Reprinted with permission from Hallacoglu et al. (2012).
FIGURE 3
FIGURE 3
Functional FD-NIRS on the human brain. (A) Hemodynamic response to visual stimulation (checkerboard reversing) measured in the human visual cortex with AC data at two wavelengths (758 and 830 nm) translated into concentration changes in oxyhemoglobin (O2Hb) and deoxyhemoglobin (HHb). (B) Deoxyhemoglobin concentration ([HHb]) traces obtained from AC data (top) and phase data (bottom) in the human prefrontal cortex in a protocol involving arithmetic calculations (indicated by the green shaded areas in the two panels. (A) Reprinted with permission from Wolf et al. (2002b) Elsevier; (B) Reprinted with permission from Toronov et al. (2001) The Optical Society of America.
FIGURE 4
FIGURE 4
Fast optical signal measured by FD-NIRS with (A) phase from the visual cortex of human subjects at the cortical location of predicted response and at a control location (EROS: event-related optical signal), and (B) DC Intensity from the prefrontal cortex (top) in comparison with the event-related potential (ERP) response. (A) Reprinted with permission from Gratton and Fabiani (2003)© Wiley; (B) Reprinted with permission from Proulx et al. (2018b)© Elsevier.
FIGURE 5
FIGURE 5
Sensitivity maps for absorption contrast of (A) single-slope intensity, (B) single-slope phase, (C) dual-slope intensity, and (D) dual-slope phase. The arrows pointing down indicate the light sources (S1, S2), and the arrows pointing up indicate the optical detectors (D1, D2). The color bar labels in panels (A,C) indicate the sensitivity to absorption perturbations for single slope DC intensity (SSSDC,μa) and dual slope DC intensity (SDSDC,μa), respectively. The color bar labels in panels (B,D) indicate the sensitivity to absorption perturbations for single slope phase (SSSφ,μa) and dual slope phase (SDSφ,μa), respectively. White and black in the color maps indicate values greater than the maximum or smaller than the minimum, respectively, of the color bars. Adapted with permission from Sassaroli et al. (2019)© The Optical Society of America.

References

    1. Applegate M. B., Roblyer D. (2018). Multi-distance diffuse optical spectroscopy with a single optode via hypotrochoidal scanning. Opt. Lett. 43 747–750. 10.1364/OL.43.000747 - DOI - PubMed
    1. Arnesano C., Santoro Y., Gratton E. (2012). Digital parallel frequency-domain spectroscopy for tissue imaging. J. Biomed. Opt. 17:096014. - PMC - PubMed
    1. Baniqued P. L., Low K. A., Fabiani M., Gratton G. (2013). Frontoparietal traffic signals; a fast optical imaging study of preparatory dynamics in response mode switching. J. Cogn. Neurosci. 25 887–902. 10.1162/jocn_a_00341 - DOI - PubMed
    1. Bevilacqua F., Berger A. J., Cerussi A. E., Jakubowski D., Tromberg B. J. (2000). Broadband absorption spectroscopy in turbid media by combined frequency-domain and steady-state methods. Appl. Opt. 39 6498–6507. - PubMed
    1. Bigio I. J., Fantini S. (2016). Quantitative Biomedical Optics. Cambridge: Cambridge University Press.

LinkOut - more resources