. 2020 Apr 7:8:294.
doi: 10.3389/fbioe.2020.00294. eCollection 2020.

Imaging the Cell Morphological Response to 3D Topography and Curvature in Engineered Intestinal Tissues

Affiliations

Imaging the Cell Morphological Response to 3D Topography and Curvature in Engineered Intestinal Tissues

Gizem Altay et al. Front Bioeng Biotechnol. .

Abstract

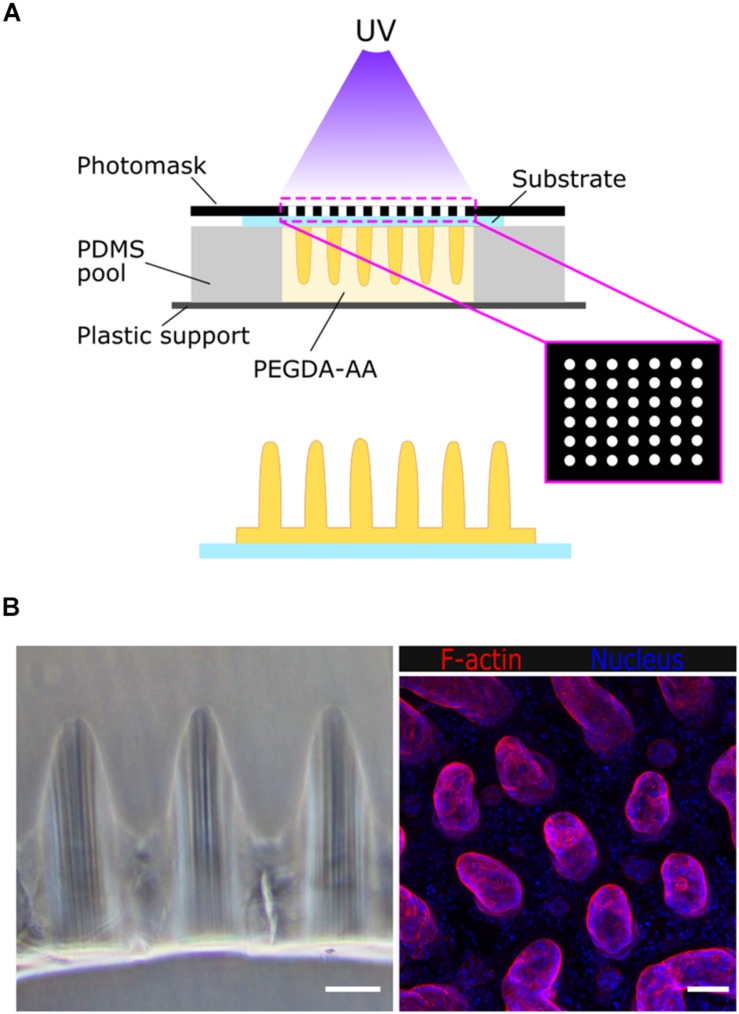
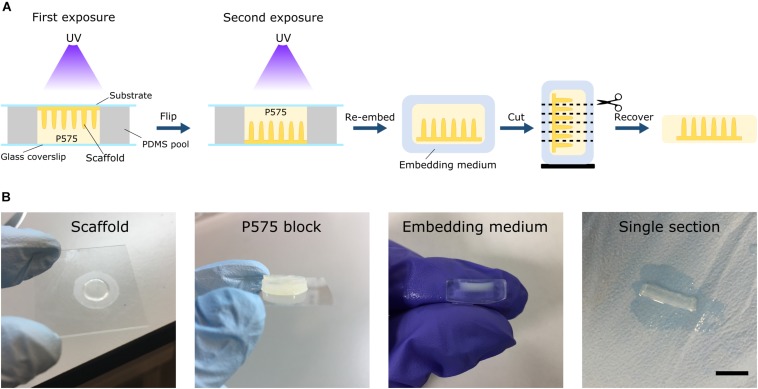
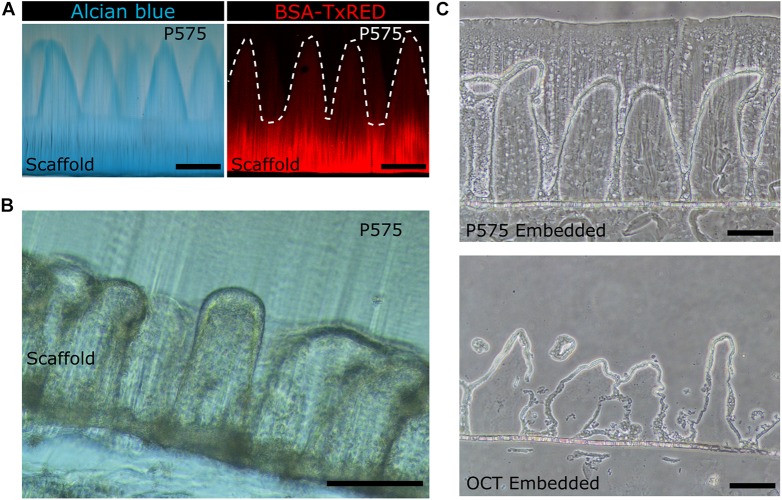
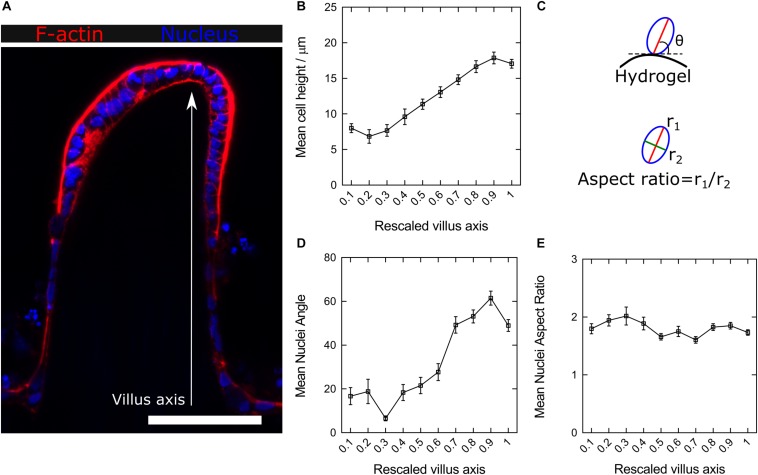
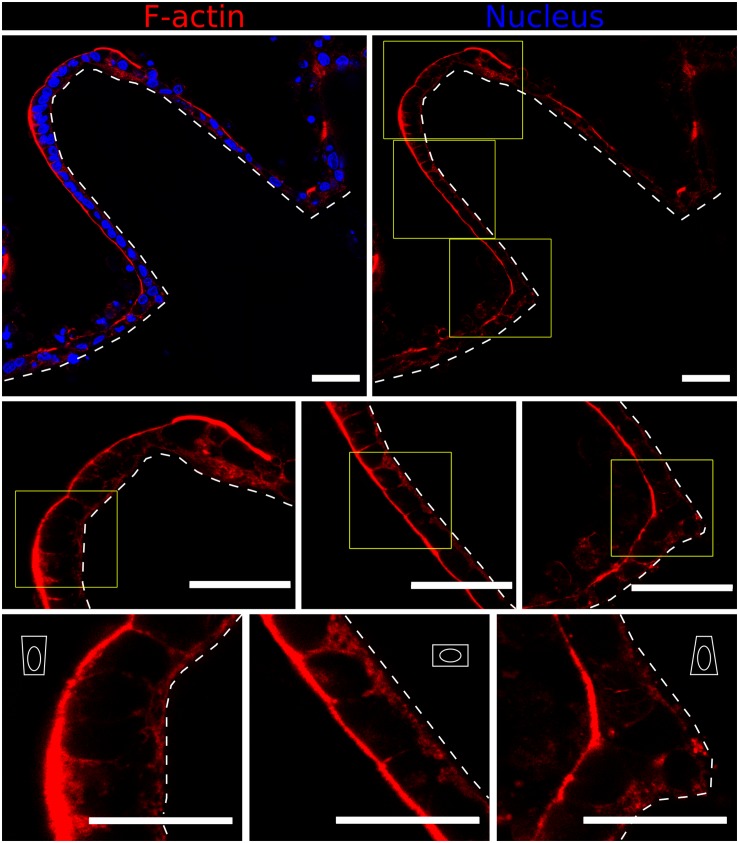
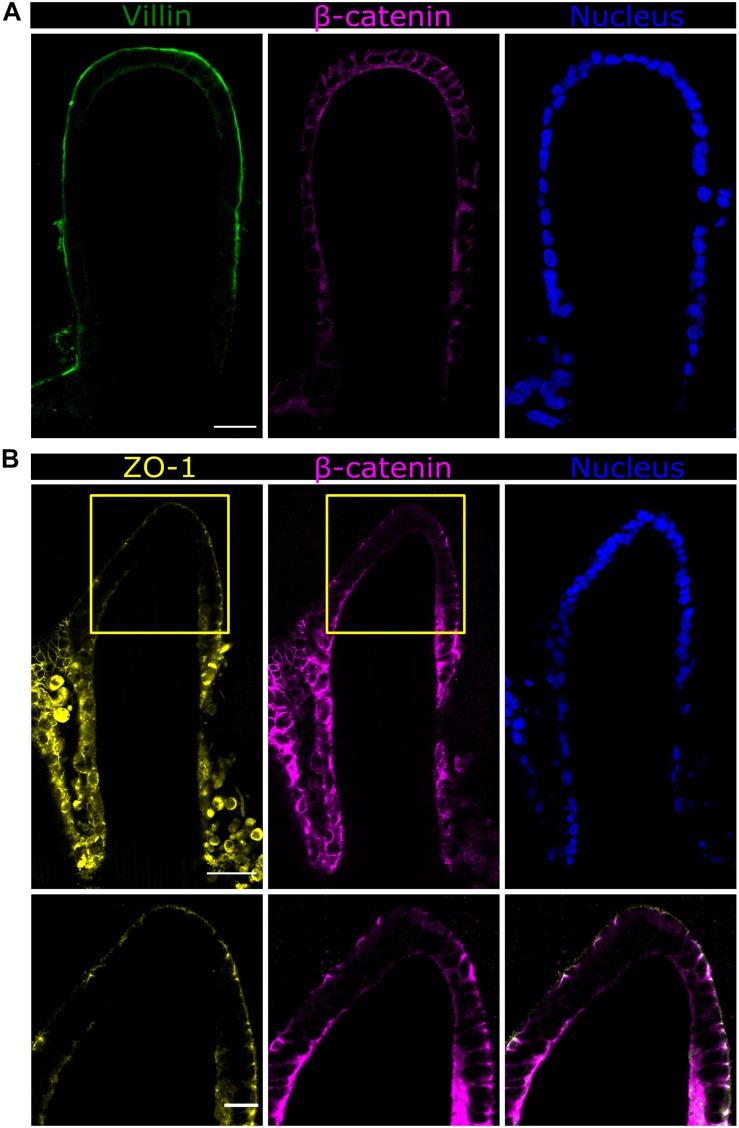
While conventional cell culture methodologies have relied on flat, two-dimensional cell monolayers, three-dimensional engineered tissues are becoming increasingly popular. Often, engineered tissues can mimic the complex architecture of native tissues, leading to advancements in reproducing physiological functional properties. In particular, engineered intestinal tissues often use hydrogels to mimic villi structures. These finger-like protrusions of a few hundred microns in height have a well-defined topography and curvature. Here, we examined the cell morphological response to these villus-like microstructures at single-cell resolution using a novel embedding method that allows for the histological processing of these delicate hydrogel structures. We demonstrated that by using photopolymerisable poly(ethylene) glycol as an embedding medium, the villus-like microstructures were successfully preserved after sectioning with vibratome or cryotome. Moreover, high-resolution imaging of these sections revealed that cell morphology, nuclei orientation, and the expression of epithelial polarization markers were spatially encoded along the vertical axis of the villus-like microstructures and that this cell morphological response was dramatically affected by the substrate curvature. These findings, which are in good agreement with the data reported for in vivo experiments on the native tissue, are likely to be the origin of more physiologically relevant barrier properties of engineered intestinal tissues when compared with standard monolayer cultures. By showcasing this example, we anticipate that the novel histological embedding procedure will have a positive impact on the study of epithelial cell behavior on three-dimensional substrates in both physiological and pathological situations.

Keywords: cell morphology; cell orientation; confocal microscopy; histological section; hydrogel scaffold; small intestine; substrate curvature; villus.


Figures

FIGURE 1
FIGURE 1
(A) Schematic drawing of the fabrication of villus-like microstructured PEGDA-AA hydrogel scaffolds. (B) Left: bright field microscope image of the cross-section of the villus-like microstructured hydrogel scaffolds. Right: confocal maximum intensity projection showing F-actin and nuclei staining of Caco-2 cells grown on top of the villus-like scaffold. Scale bars: 100 μm.
FIGURE 2
FIGURE 2
(A) Schematic drawing of the embedding protocol using low molecular weight PEGDA (P575) for soft hydrogel scaffolds with high aspect-ratio features. The scaffolds can be re-embedded in routine embedding media and sectioned using either cryosectioning or vibrating microtomy. (B) Image sequence of the different stages of the process. From left to right: a microstructured scaffold fabricated on PET membrane, the P575 block embedding the microstructured scaffold, the P575 block re-embedded in an agarose medium, and a free-standing, robust single section after vibrating microtomy sectioning. Scale bar: 5 mm.
FIGURE 3
FIGURE 3
(A) Bright field microscopy image of villus-like microstructured PEGDA-AA hydrogels stained with Alcian Blue (left panel) and confocal maximum intensity projection image of the PEGDA-AA microstructures functionalized with BSA-Texas Red (right panel) after P575 embedding and sectioning. White dashed lines mark the border of the microstructures. Scale bars: 200 μm. (B) Bright field microscopy image of a vibratome section of the P575 embedded villus-like hydrogel scaffold with Caco-2 cells grown on top. Scale bar: 200 μm. (C) Bright field microscopy images of cryosectioned villus-like hydrogel scaffolds with Caco-2 cells grown on top. The upper panel shows the hydrogel embedded in P575 and then in OCT; the lower panel shows the control only with the OCT embedding. Scale bars: 100 μm.
FIGURE 4
FIGURE 4
(A) Confocal microscopy image of F-actin and nuclei staining of the Caco-2 monolayer formed on top of microstructured hydrogels after 21 days in culture. Scale bar: 100 μm. (B) Average cell heights along the rescaled villus axis. (C) Schematic drawing showing the nuclei orientation (the major axis angle of the fitted ellipse with respect to the hydrogel surface) and elongation (the ratio between the major to the minor axes of the fitted ellipse) analysis. (D) Change in the mean nuclei angle (nuclei orientation) and (E) nuclei aspect ratio (nuclei elongation) along the rescaled villus axis. Data presented as mean ± standard error of the mean (SEM).
FIGURE 5
FIGURE 5
Fast Airyscan confocal images showing F-actin and nuclei staining of the Caco-2 monolayer formed on top of microstructured hydrogels after 21 days in culture (upper row). Yellow boxed regions are shown in high magnification (middle and lower rows). Different cell shapes are observed: basally constricted wedge-shaped at the villi tips, cuboidal along the walls and apically constricted at the base, as represented by the white drawings. Scale bars (upper and middle rows): 50 μm, (lower row): 30 μm.
FIGURE 6
FIGURE 6
Fast Airyscan confocal images of the Caco-2 monolayer formed on top of the microstructured hydrogels after 21 days in culture showing the expression of (A) villin in green or (B) ZO-1 in yellow, β-catenin in magenta, and nuclei in blue. Yellow boxed regions are shown in high magnification. Scale bars (upper and middle rows): 50 μm, (lower row): 20 μm.

References

    1. Assoian R. K., Bade N. D., Cameron C. V., Stebe K. J. (2019). Cellular sensing of micron-scale curvature: a frontier in understanding the microenvironment. Open Biol. 9:190155. 10.1098/rsob.190155 - DOI - PMC - PubMed
    1. Baptista D., Teixeira L., van Blitterswijk C., Giselbrecht S., Truckenmüller R. (2019). Overlooked? Underestimated? Effects fof substrate curvature on cell behavior. Trends Biotechnol. 37 838–854. 10.1016/j.tibtech.2019.01.006 - DOI - PubMed
    1. Booij T. H., Price L. S., Danen E. H. J. (2019). 3D cell-based assays for drug screens: challenges in imaging, image analysis, and high-content analysis. SLAS Discov. 24 615–627. 10.1177/2472555219830087 - DOI - PMC - PubMed
    1. Broaders K. E., Cerchiari A. E., Gartner Z. J. (2015). Coupling between apical tension and basal adhesion allow epithelia to collectively sense and respond to substrate topography over long distances. Integr. Biol. 7 1611–1621. 10.1039/c5ib00240k - DOI - PMC - PubMed
    1. Caliari S. R., Burdick J. A. (2016). A practical guide to hydrogels for cell culture. Nat. Methods 13 405–414. 10.1038/nmeth.3839 - DOI - PMC - PubMed