. 2020 May;56(5):1162-1174.
doi: 10.3892/ijo.2020.5007. Epub 2020 Mar 5.

ADAM12 silencing promotes cellular apoptosis by activating autophagy in choriocarcinoma cells

Affiliations

ADAM12 silencing promotes cellular apoptosis by activating autophagy in choriocarcinoma cells

Lin Wang et al. Int J Oncol. 2020 May.

Abstract

ADAM metallopeptidase domain 12 (ADAM12) has been demonstrated to mediate cell proliferation and apoptosis resistance in several types of cancer cells. However, the effect of ADAM12 silencing on the proliferation and apoptosis of choriocarcinoma cells remains unknown. The present study revealed that ADAM12 silencing significantly inhibited cellular activity and proliferation in the human choriocarcinoma JEG3 cell line and increased the rate of apoptosis. In addition, ADAM12 silencing significantly increased the expression levels of the autophagy proteins microtubule‑associated protein‑light‑chain 3 (LC3B) and autophagy related 5 (ATG5) and the fluorescence density of LC3B in JEG‑3 cells. However, the suppression of autophagy by 3‑methyladenine could block ADAM12 silencing‑induced cellular apoptosis. ADAM12 silencing reduced the levels of the inflammatory factors interleukin‑1β, interferon‑γ and TNF‑α, and inactivated nuclear p65‑NF‑κB and p‑mTOR in JEG‑3 cells. The downregulation of p‑mTOR expression by ADAM12 silencing was rescued in 3‑methyladenine‑treated JEG‑3 cells, indicating that mTOR might participate in the autophagy‑mediated pro‑apoptotic effect of ADAM12 silencing. In conclusion, ADAM12 silencing promoted cellular apoptosis in human choriocarcinoma JEG3 cells, which might be associated with autophagy and the mTOR response. These findings indicate that ADAM12 silencing might be a potential novel therapeutic target for choriocarcinoma.

Keywords: ADAM12; choriocarcinoma cell; proliferation; apoptosis; autophagy.


Figures

Figure 1
Figure 1
JEG-3 cell culture and ADAM12-siRNA transfection. (A) Untransfected JEG-3 cells observed under an optical microscope (magnification, x200). (B) Western blotting revealed that the levels of ADAM12 protein were decreased after ADAM12-siRNA transfection with three different targets (1, 2 and 3). (C) Quantification of the western blotting showed that ADAM12-siRNA target 3 had the highest transfection efficiency in JEG-3 cells, compared with targets 1 and 2. ***P<0.05, as indicated. ADAM12, ADAM metallopeptidase domain 12; siRNA, small interfering RNA; NC, negative control; BC, blank control; n.s., not significant.
Figure 2
Figure 2
JEG-3 cell proliferation and apoptosis after ADAM12 silencing. (A) The CCK-8 assay showed that cell proliferation in the si-ADAM12 group was decreased compared with the BC and si-NC groups. (B) The CCK-8 assay showed that cell proliferation in the si-ADAM12 + 3MA group was slightly decreased compared with the si-ADAM12 group. (C) Flow cytometry showed that the apoptosis rate was increased in the si-ADAM12 group compared with the blank control and si-NC groups. (D) Flow cytometry test showed that the apoptosis rate was decreased in the si-ADAM12 + 3MA group compared with the si-ADAM12 group. *P<0.05, as indicated. ADAM12, ADAM metallopeptidase domain 12; CCK-8, Cell Counting Kit-8; siRNA, small interfering RNA; BC, blank control; NC, negative control; 3MA, 3-methyladenine; OD, optical density; n.s., not significant.
Figure 3
Figure 3
Western blotting was used to investigate the expression levels of apoptosis- and autophagy-assciacted proteins after ADAM12 silencing in JEG-3 cells. (A) Western blotting bands of autophagy-associated proteins (ATG5 and LC3B) and apoptosis-associated proteins (caspase 3, caspase 9, Bax and p53) in the BC, si-NC and si-ADAM12 groups. (B) Quantification of western blotting showed that the level of ATG5 expression was increased in the si-ADAM12 group compared with the BC and si-NC groups. (C) Quantification of western blotting showed that the level of Bax expression was increased in the si-ADAM12 group compared with the BC and si-NC groups. (D) Quantification of western blotting showed that the level of LC3BI expression was increased in the si-ADAM12 group compared with the BC and si-NC groups. (E) Quantification of western blotting showed that the level of p53 expression was increased in the si-ADAM12 group compared with the BC and si-NC groups. (F) Quantification of western blotting showed that the level of LC3BII expression was increased in the si-ADAM12 group compared with the BC and si-NC groups. Western blotting was used to investigate the expression levels of apoptosis- and autophagy-assciacted proteins after ADAM12 silencing in JEG-3 cells. Quantification of western blotting showed that the level of (G) procaspase 3, (H) cleaved caspase 3 (19 kDa) and (I) cleaved caspase 3 (17 kDa) expression in the si-ADAM12 groups was similar to the BC and si-NC groups. Quantification of western blotting showed that the level of (J) procaspase 9, (K) cleaved caspase 9 (37 kDa) and (L) cleaved caspase 9 (35 kDa) in the si-ADAM12 group was similar to the BC and si-NC groups. *P<0.05, as indicated. ADAM12, ADAM metallopeptidase domain 12; ATG5, autophagy related 5; LC3B, microtubule-associated protein-light-chain 3; BC, blank control; si, small interfering; NC, negative control; n.s., not significant.
Figure 3
Figure 3
Western blotting was used to investigate the expression levels of apoptosis- and autophagy-assciacted proteins after ADAM12 silencing in JEG-3 cells. (A) Western blotting bands of autophagy-associated proteins (ATG5 and LC3B) and apoptosis-associated proteins (caspase 3, caspase 9, Bax and p53) in the BC, si-NC and si-ADAM12 groups. (B) Quantification of western blotting showed that the level of ATG5 expression was increased in the si-ADAM12 group compared with the BC and si-NC groups. (C) Quantification of western blotting showed that the level of Bax expression was increased in the si-ADAM12 group compared with the BC and si-NC groups. (D) Quantification of western blotting showed that the level of LC3BI expression was increased in the si-ADAM12 group compared with the BC and si-NC groups. (E) Quantification of western blotting showed that the level of p53 expression was increased in the si-ADAM12 group compared with the BC and si-NC groups. (F) Quantification of western blotting showed that the level of LC3BII expression was increased in the si-ADAM12 group compared with the BC and si-NC groups. Western blotting was used to investigate the expression levels of apoptosis- and autophagy-assciacted proteins after ADAM12 silencing in JEG-3 cells. Quantification of western blotting showed that the level of (G) procaspase 3, (H) cleaved caspase 3 (19 kDa) and (I) cleaved caspase 3 (17 kDa) expression in the si-ADAM12 groups was similar to the BC and si-NC groups. Quantification of western blotting showed that the level of (J) procaspase 9, (K) cleaved caspase 9 (37 kDa) and (L) cleaved caspase 9 (35 kDa) in the si-ADAM12 group was similar to the BC and si-NC groups. *P<0.05, as indicated. ADAM12, ADAM metallopeptidase domain 12; ATG5, autophagy related 5; LC3B, microtubule-associated protein-light-chain 3; BC, blank control; si, small interfering; NC, negative control; n.s., not significant.
Figure 4
Figure 4
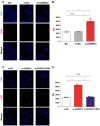
Immunofluorescence staining of the autophagy-associated protein LC3B in JEG-3 cells after ADAM12 silencing. (A) Images of immunofluorescence staining (magnification, x400). (B) Quantification of immunofluorescence showed that the IFD of LC3B was increased in the si-ADAM12 group compared with the BC and si-NC groups. (C) Images of immunofluorescence staining (magnification, x400). (D) Quantification of immunofluorescence showed that the IFD of LC3B was decreased in the si-ADAM12 + 3MA group compared with the si-ADAM12 group, but similar to the si-NC group. *P<0.05, as indicated. LC3B, microtubule-associated protein-light-chain 3; ADAM12, ADAM metallopeptidase domain 12; IFD, immunofluorescence density; si, small interfering; 3MA, 3-methyladenine; NC, negative control; BC, blank control; n.s., not significant.
Figure 5
Figure 5
Cell cycle analysis of si-ADAM12 transfected JEG-3 cells after treatment with the autophagy inhibitor 3MA. (A) Column plot of cell cycle (G1, S and G2 phases) in JEG-3 cells in the si-NC, si-ADAM12 and si-ADAM12 + 3MA groups. (B) Quantification of the G1 phase showed that the percentage of cells in this phase was increased in the JEG-3 cells in the si-ADAM12 + 3MA group compared with the si-NC group, but was similar to the si-ADAM12 group. (C) Quantification of S phase showed that the percentage of cells in this stage was decreased in the JEG-3 cells in the si-ADAM12 + 3MA group compared with the si-NC group, but was similar to the si-ADAM12 group. (D) Quantification of the G2 phase showed that the percentage of cells in this phase was decreased in the JEG-3 cells in the si-ADAM12 + 3MA group compared with the si-NC group, but was similar to the si-ADAM12 group. (E) Quantification of the S and G2 phase showed that the percentage of cells in this S+G phase was decreased in JEG-3 cells in the si-ADAM12 + 3MA group compared with the si-NC group, but was similar to the si-ADAM12 group.*P<0.05, as indicated. si, small interfering; ADAM12, ADAM metallopeptidase domain 12; 3MA, 3-methyladenine; NC, control; n.s., not significant.
Figure 6
Figure 6
Western blotting was used to detect the expression levels of apoptosis- and autophagy-associated proteins, nuclear p65 and mTOR after 3MA treatment in si-ADAM12 transfected JEG-3 cells. (A) Western blotting bands of LC3B, Bax, p53, nuclear p65 and m-TOR in the si-NC, si-ADAM12 and si-ADAM12 + 3MA groups. (B) Quantification of western blotting showed that the level of nuclear p65 expression was decreased in the si-ADAM12 + 3MA group in compared with the si-NC group but was similar to the si-ADAM12 group. (C) Quantification of western blotting showed that the level of p53 expression was decreased in the si-ADAM12 + 3MA group compared with the si-ADAM12 group but was similar to the si-NC group. (D) Quantification of western blotting showed that the level of mTOR expression in the si-ADAM12 + 3MA group was similar to the si-ADAM12 and si-NC groups. (E) Quantification of western blotting showed that the level of Bax expression was decreased in the si-ADAM12 + 3MA group compared with the si-ADAM12 group but similar to the si-NC group. (F) Quantification of western blotting showed that the level of p-mTOR expression was increased in the si-ADAM12 + 3MA group compared with the si-ADAM12 group but slightly decreased compared with the si-NC group. Western blotting was used to detect the expression levels of apoptosis- and autophagy-associated proteins, nuclear p65 and mTOR after 3MA treatment in si-ADAM12 transfected JEG-3 cells. (G) Quantification of western blotting showed that the level of LC3BI expression was decreased in the si-ADAM12 +3 MA group compared with si-ADAM12 group but was similar to the si-NC group. (H) Quantification of western blotting showed that the level of LC3BII expression was increased in the si-ADAM12 + 3MA group compared with the si-ADAM12 group but similar to the si-NC group. (I) Quantification of western blotting showed that the level of Bcl-2 expression was decreased in the si-ADAM12 group compared with the si-NC but partly rescued in the si-ADAM12 + 3MA group. *P<0.05, as indicated. 3MA, 3-methyladenine; si, small interfering; ADAM12, ADAM metallopeptidase domain 12; LC3B, microtubule-associated protein-light-chain 3; NC, negative control; PCNA, proliferating cell nuclear antigen; n.s., not significant.
Figure 6
Figure 6
Western blotting was used to detect the expression levels of apoptosis- and autophagy-associated proteins, nuclear p65 and mTOR after 3MA treatment in si-ADAM12 transfected JEG-3 cells. (A) Western blotting bands of LC3B, Bax, p53, nuclear p65 and m-TOR in the si-NC, si-ADAM12 and si-ADAM12 + 3MA groups. (B) Quantification of western blotting showed that the level of nuclear p65 expression was decreased in the si-ADAM12 + 3MA group in compared with the si-NC group but was similar to the si-ADAM12 group. (C) Quantification of western blotting showed that the level of p53 expression was decreased in the si-ADAM12 + 3MA group compared with the si-ADAM12 group but was similar to the si-NC group. (D) Quantification of western blotting showed that the level of mTOR expression in the si-ADAM12 + 3MA group was similar to the si-ADAM12 and si-NC groups. (E) Quantification of western blotting showed that the level of Bax expression was decreased in the si-ADAM12 + 3MA group compared with the si-ADAM12 group but similar to the si-NC group. (F) Quantification of western blotting showed that the level of p-mTOR expression was increased in the si-ADAM12 + 3MA group compared with the si-ADAM12 group but slightly decreased compared with the si-NC group. Western blotting was used to detect the expression levels of apoptosis- and autophagy-associated proteins, nuclear p65 and mTOR after 3MA treatment in si-ADAM12 transfected JEG-3 cells. (G) Quantification of western blotting showed that the level of LC3BI expression was decreased in the si-ADAM12 +3 MA group compared with si-ADAM12 group but was similar to the si-NC group. (H) Quantification of western blotting showed that the level of LC3BII expression was increased in the si-ADAM12 + 3MA group compared with the si-ADAM12 group but similar to the si-NC group. (I) Quantification of western blotting showed that the level of Bcl-2 expression was decreased in the si-ADAM12 group compared with the si-NC but partly rescued in the si-ADAM12 + 3MA group. *P<0.05, as indicated. 3MA, 3-methyladenine; si, small interfering; ADAM12, ADAM metallopeptidase domain 12; LC3B, microtubule-associated protein-light-chain 3; NC, negative control; PCNA, proliferating cell nuclear antigen; n.s., not significant.
Figure 7
Figure 7
ELISA assay for the expression levels of inflammatory factors after ADAM12 silencing in JEG-3 cells. (A) Quantification of ELISA showed that the level of IL-1β expression was decreased in the si-ADAM12 group compared with the BC and si-NC groups. (B) Quantification of ELISA showed that the level of IFNγ expression was decreased in the si-ADAM12 group compared with the BC and si-NC groups. (C) Quantification of ELISA showed that the level of TNFα expression was decreased in the si-ADAM12 group compared with the BC and si-NC groups. (D) Quantification of ELISA showed that the level of IL-1β expression was decreased in the si-ADAM12 + 3MA group compared with si-NC group, but was similar to the si-ADAM12 group. (E) Quantification of ELISA showed that the level of IFNγ expression was greatly decreased in the si-ADAM12 + 3MA group compared with the si-NC group and slightly decreased compared with the si-ADAM12 group. (F) Quantification of ELISA showed that the level of TNFα expression was decreased in the si-ADAM12 + 3MA group compared with the si-NC group but was similar to the si-ADAM12 group. *P<0.05, as indicated. ADAM12, ADAM metallopeptidase domain 12; IL-1β, interleukin-1β; BC, blank control; si, small interfering; NC, negative control; IFNγ, interferon γ; 3MA, 3-methyladenine; TNFα, tumour necrosis α; n.s., not significant.

References

    1. Wreczycka-Cegielny P, Cegielny T, Oplawski M, Sawicki W, Kojs ZC. Current treatment options for advanced choriocar-cinoma on the basis of own case and review of the literature. Ginekol Pol. 2018;89:711–715. doi: 10.5603/GP.a2018.0120. - DOI - PubMed
    1. Cheung AN, Zhang HJ, Xue WC, Siu MK. Pathogenesis of choriocarcinoma: Clinical, genetic and stem cell perspectives. Future Oncol. 2009;5:217–231. doi: 10.2217/14796694.5.2.217. - DOI - PubMed
    1. Wells M. The pathology of gestational trophoblastic disease: Recent advances. Pathology. 2007;39:88–96. doi: 10.1080/00313020601137367. - DOI - PubMed
    1. Becherer JD, Blobel CP. Biochemical properties and functions of membrane-anchored metallprotease-disintegrin proteins (ADAMs) Curr Top Dev Biol. 2003;54:101–123. doi: 10.1016/S0070-2153(03)54006-6. - DOI - PubMed
    1. Klein T, Bischoff R. Active metalloproteases of the A disin-tegrin and metalloprotease (ADAM) family: Biological function and structure. J Proteome Res. 2011;10:17–33. doi: 10.1021/pr100556z. - DOI - PubMed