. 2020 Aug 1;202(3):433-447.
doi: 10.1164/rccm.201911-2202OC.

Metagenomics Reveals a Core Macrolide Resistome Related to Microbiota in Chronic Respiratory Disease

Affiliations

Metagenomics Reveals a Core Macrolide Resistome Related to Microbiota in Chronic Respiratory Disease

Micheál Mac Aogáin et al. Am J Respir Crit Care Med. .

Abstract

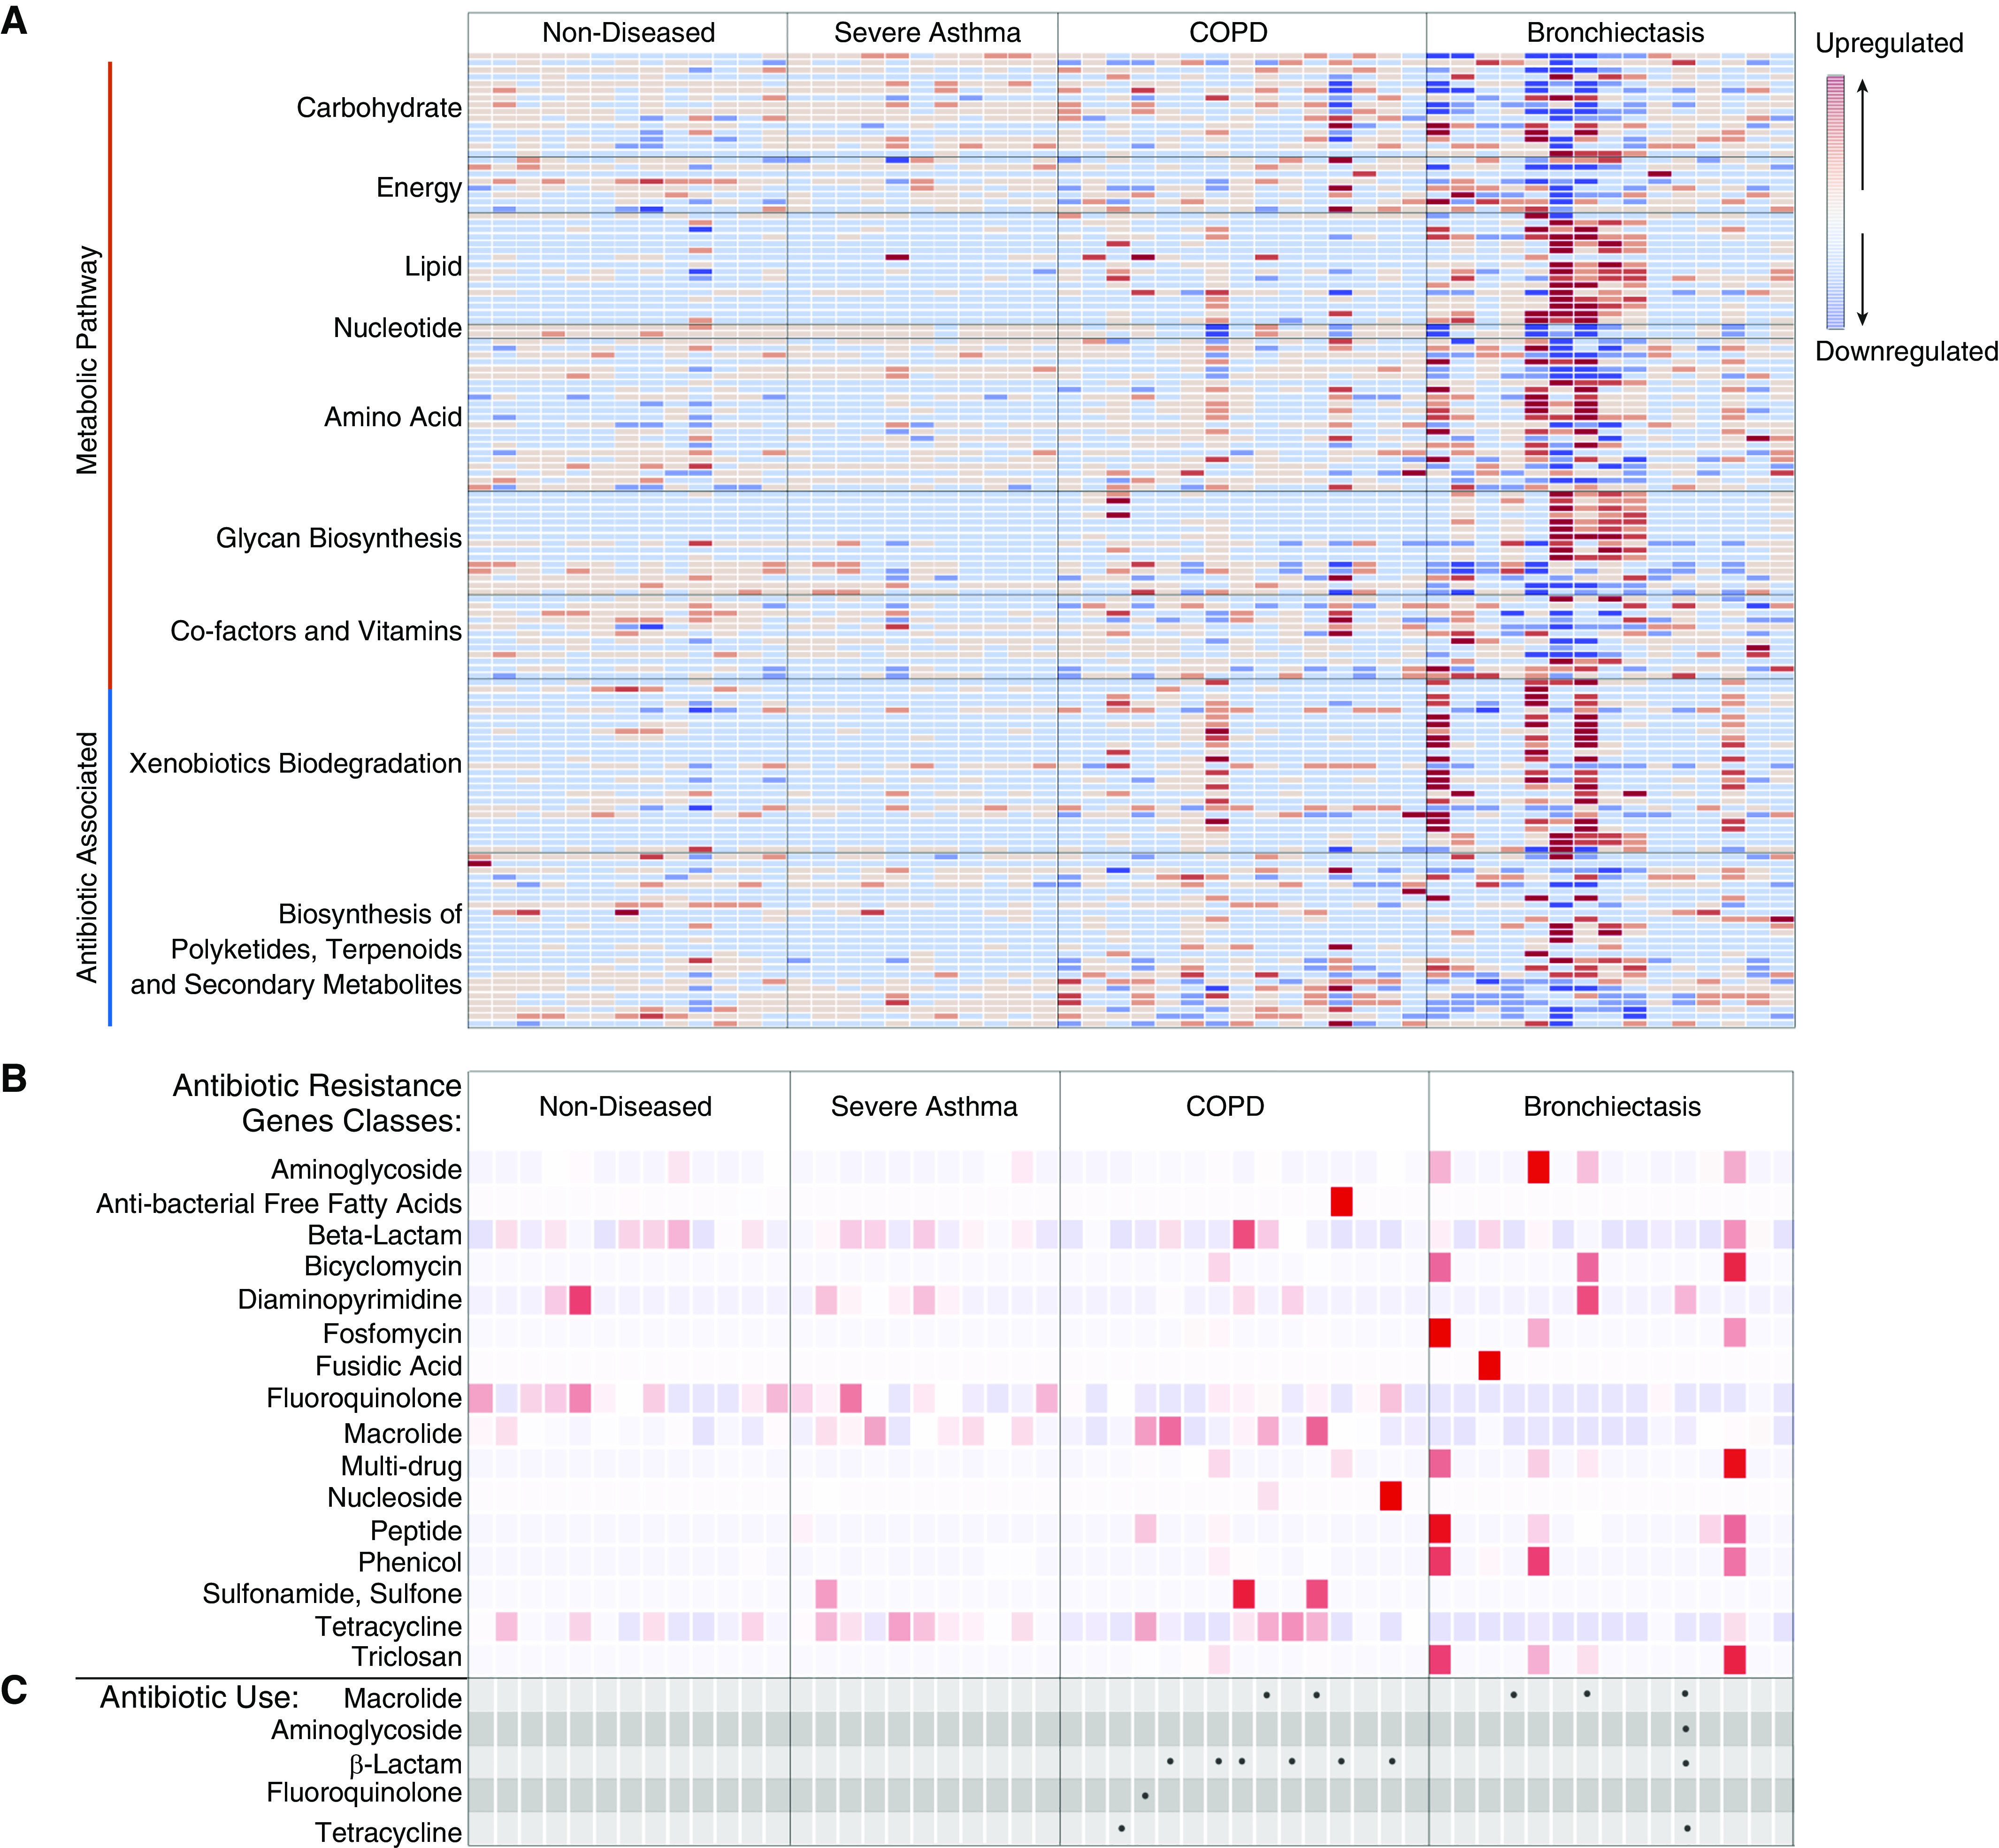
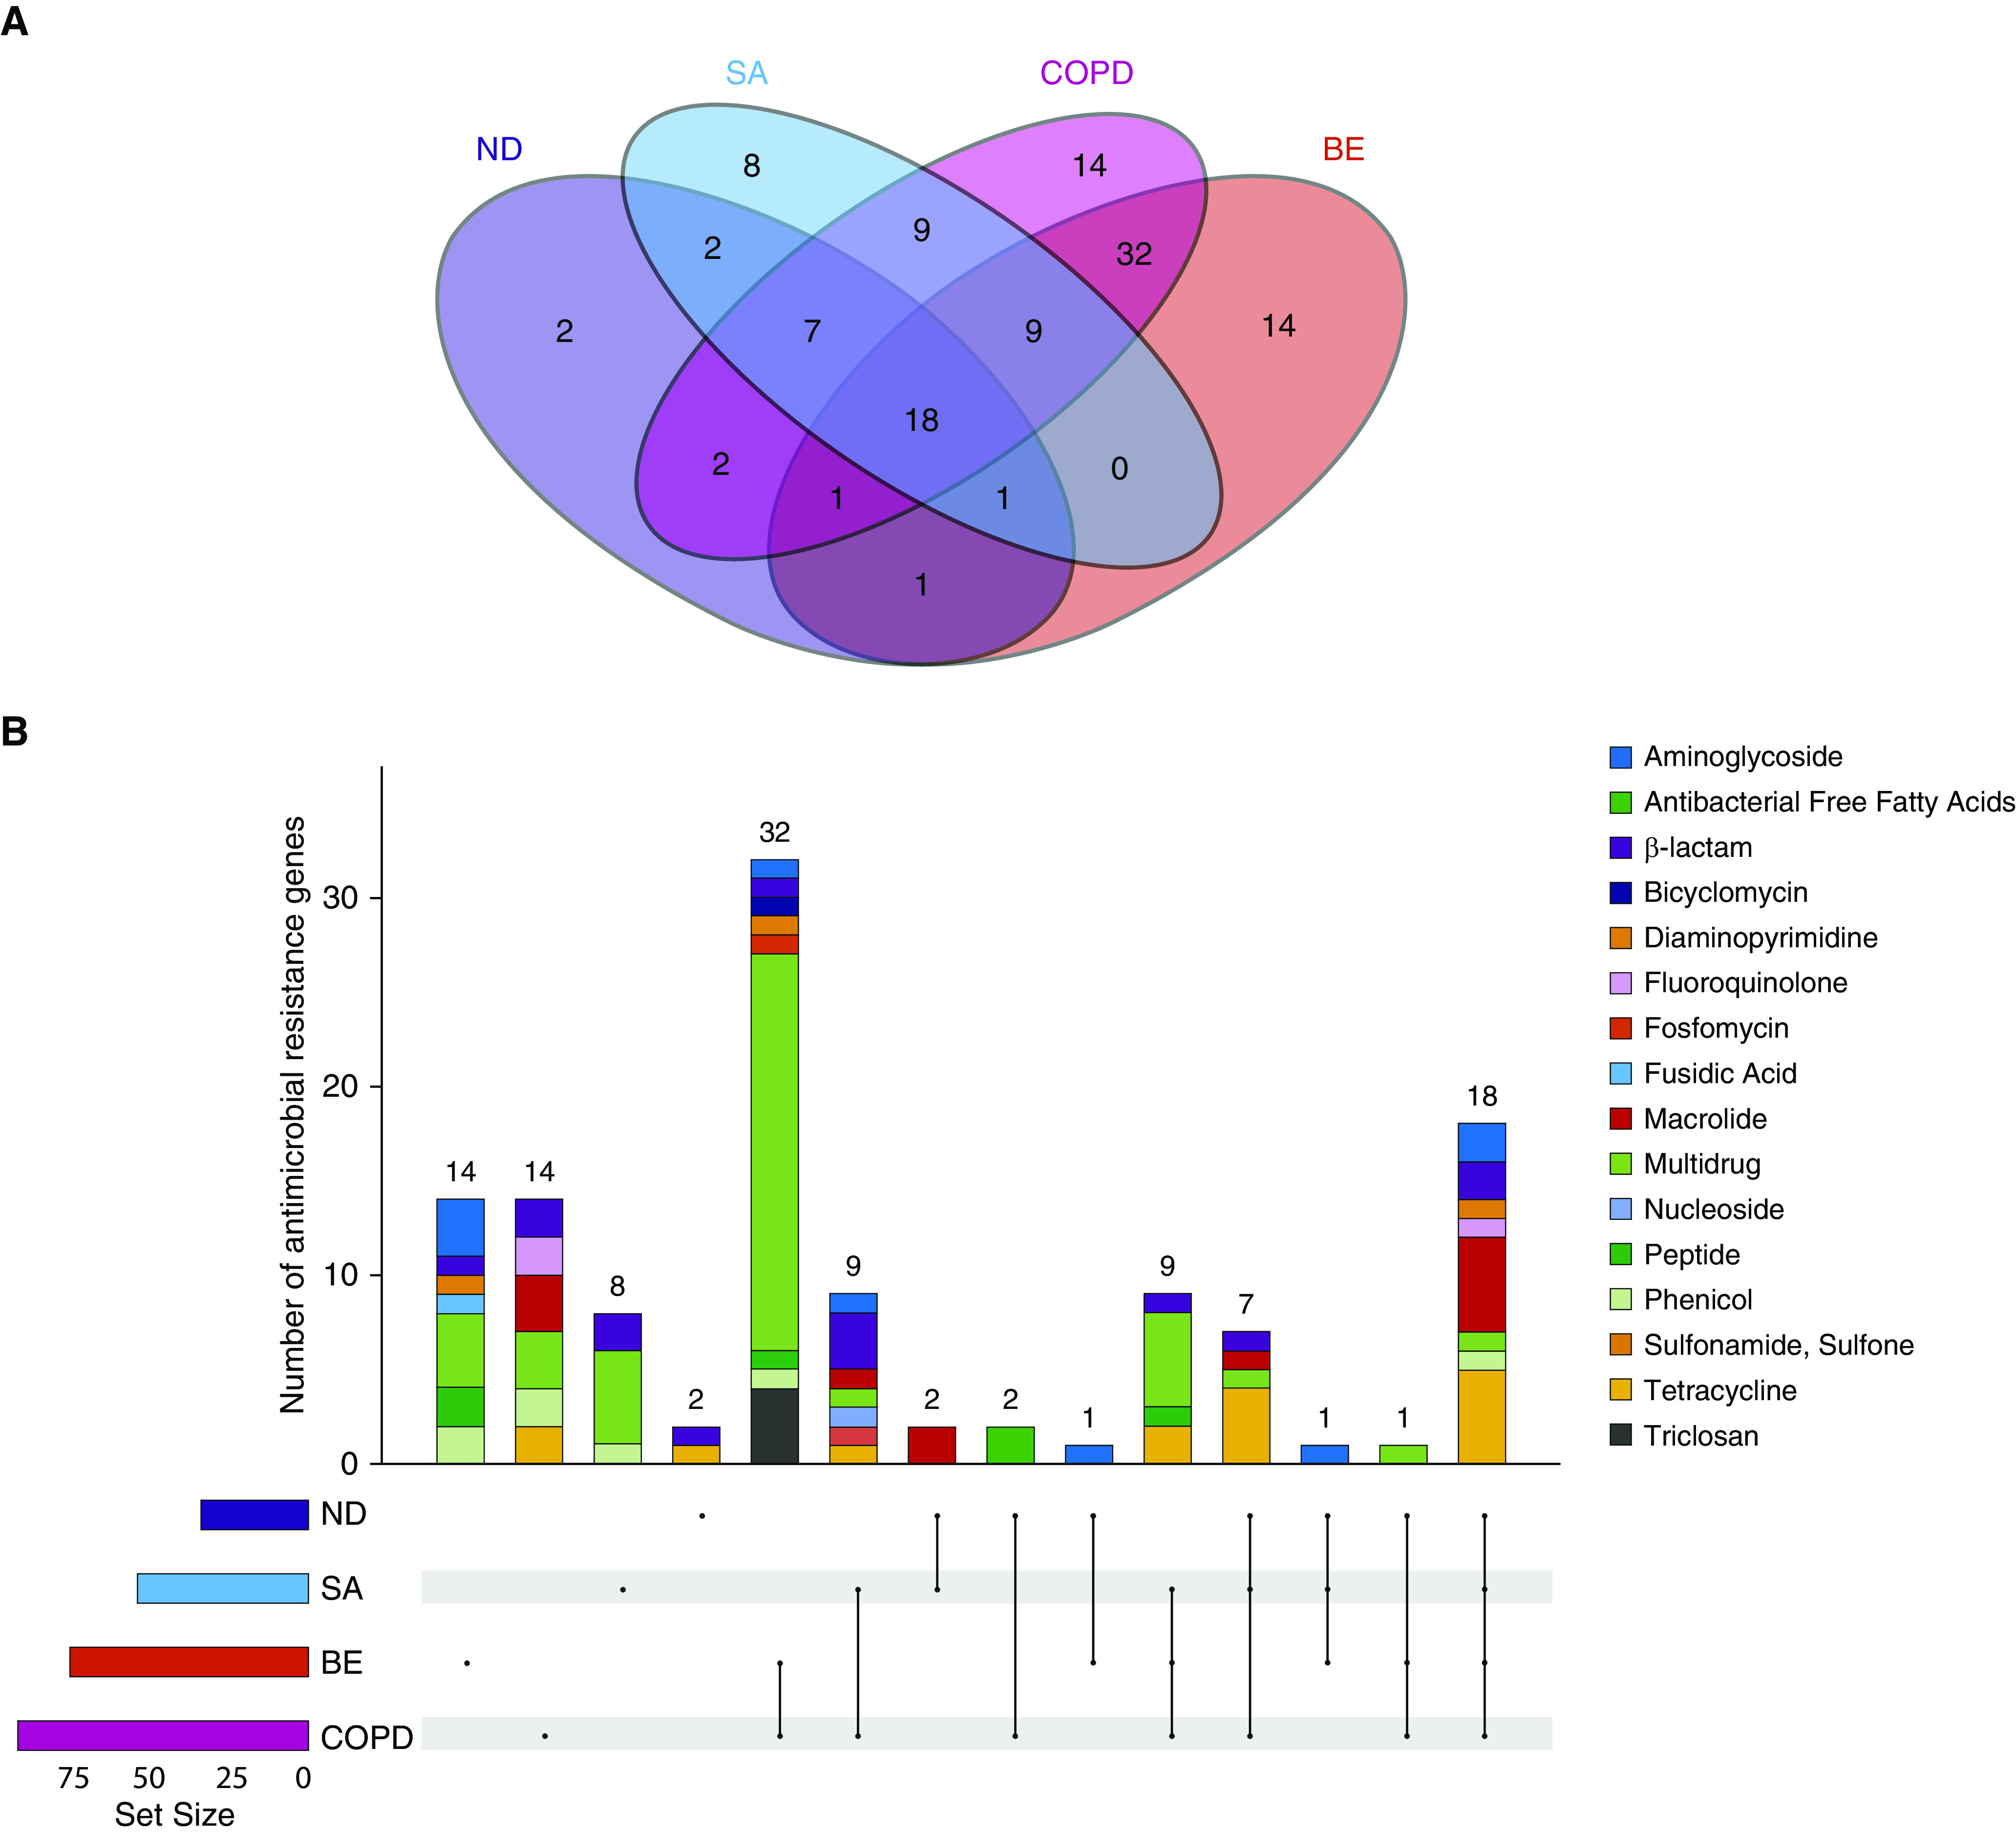
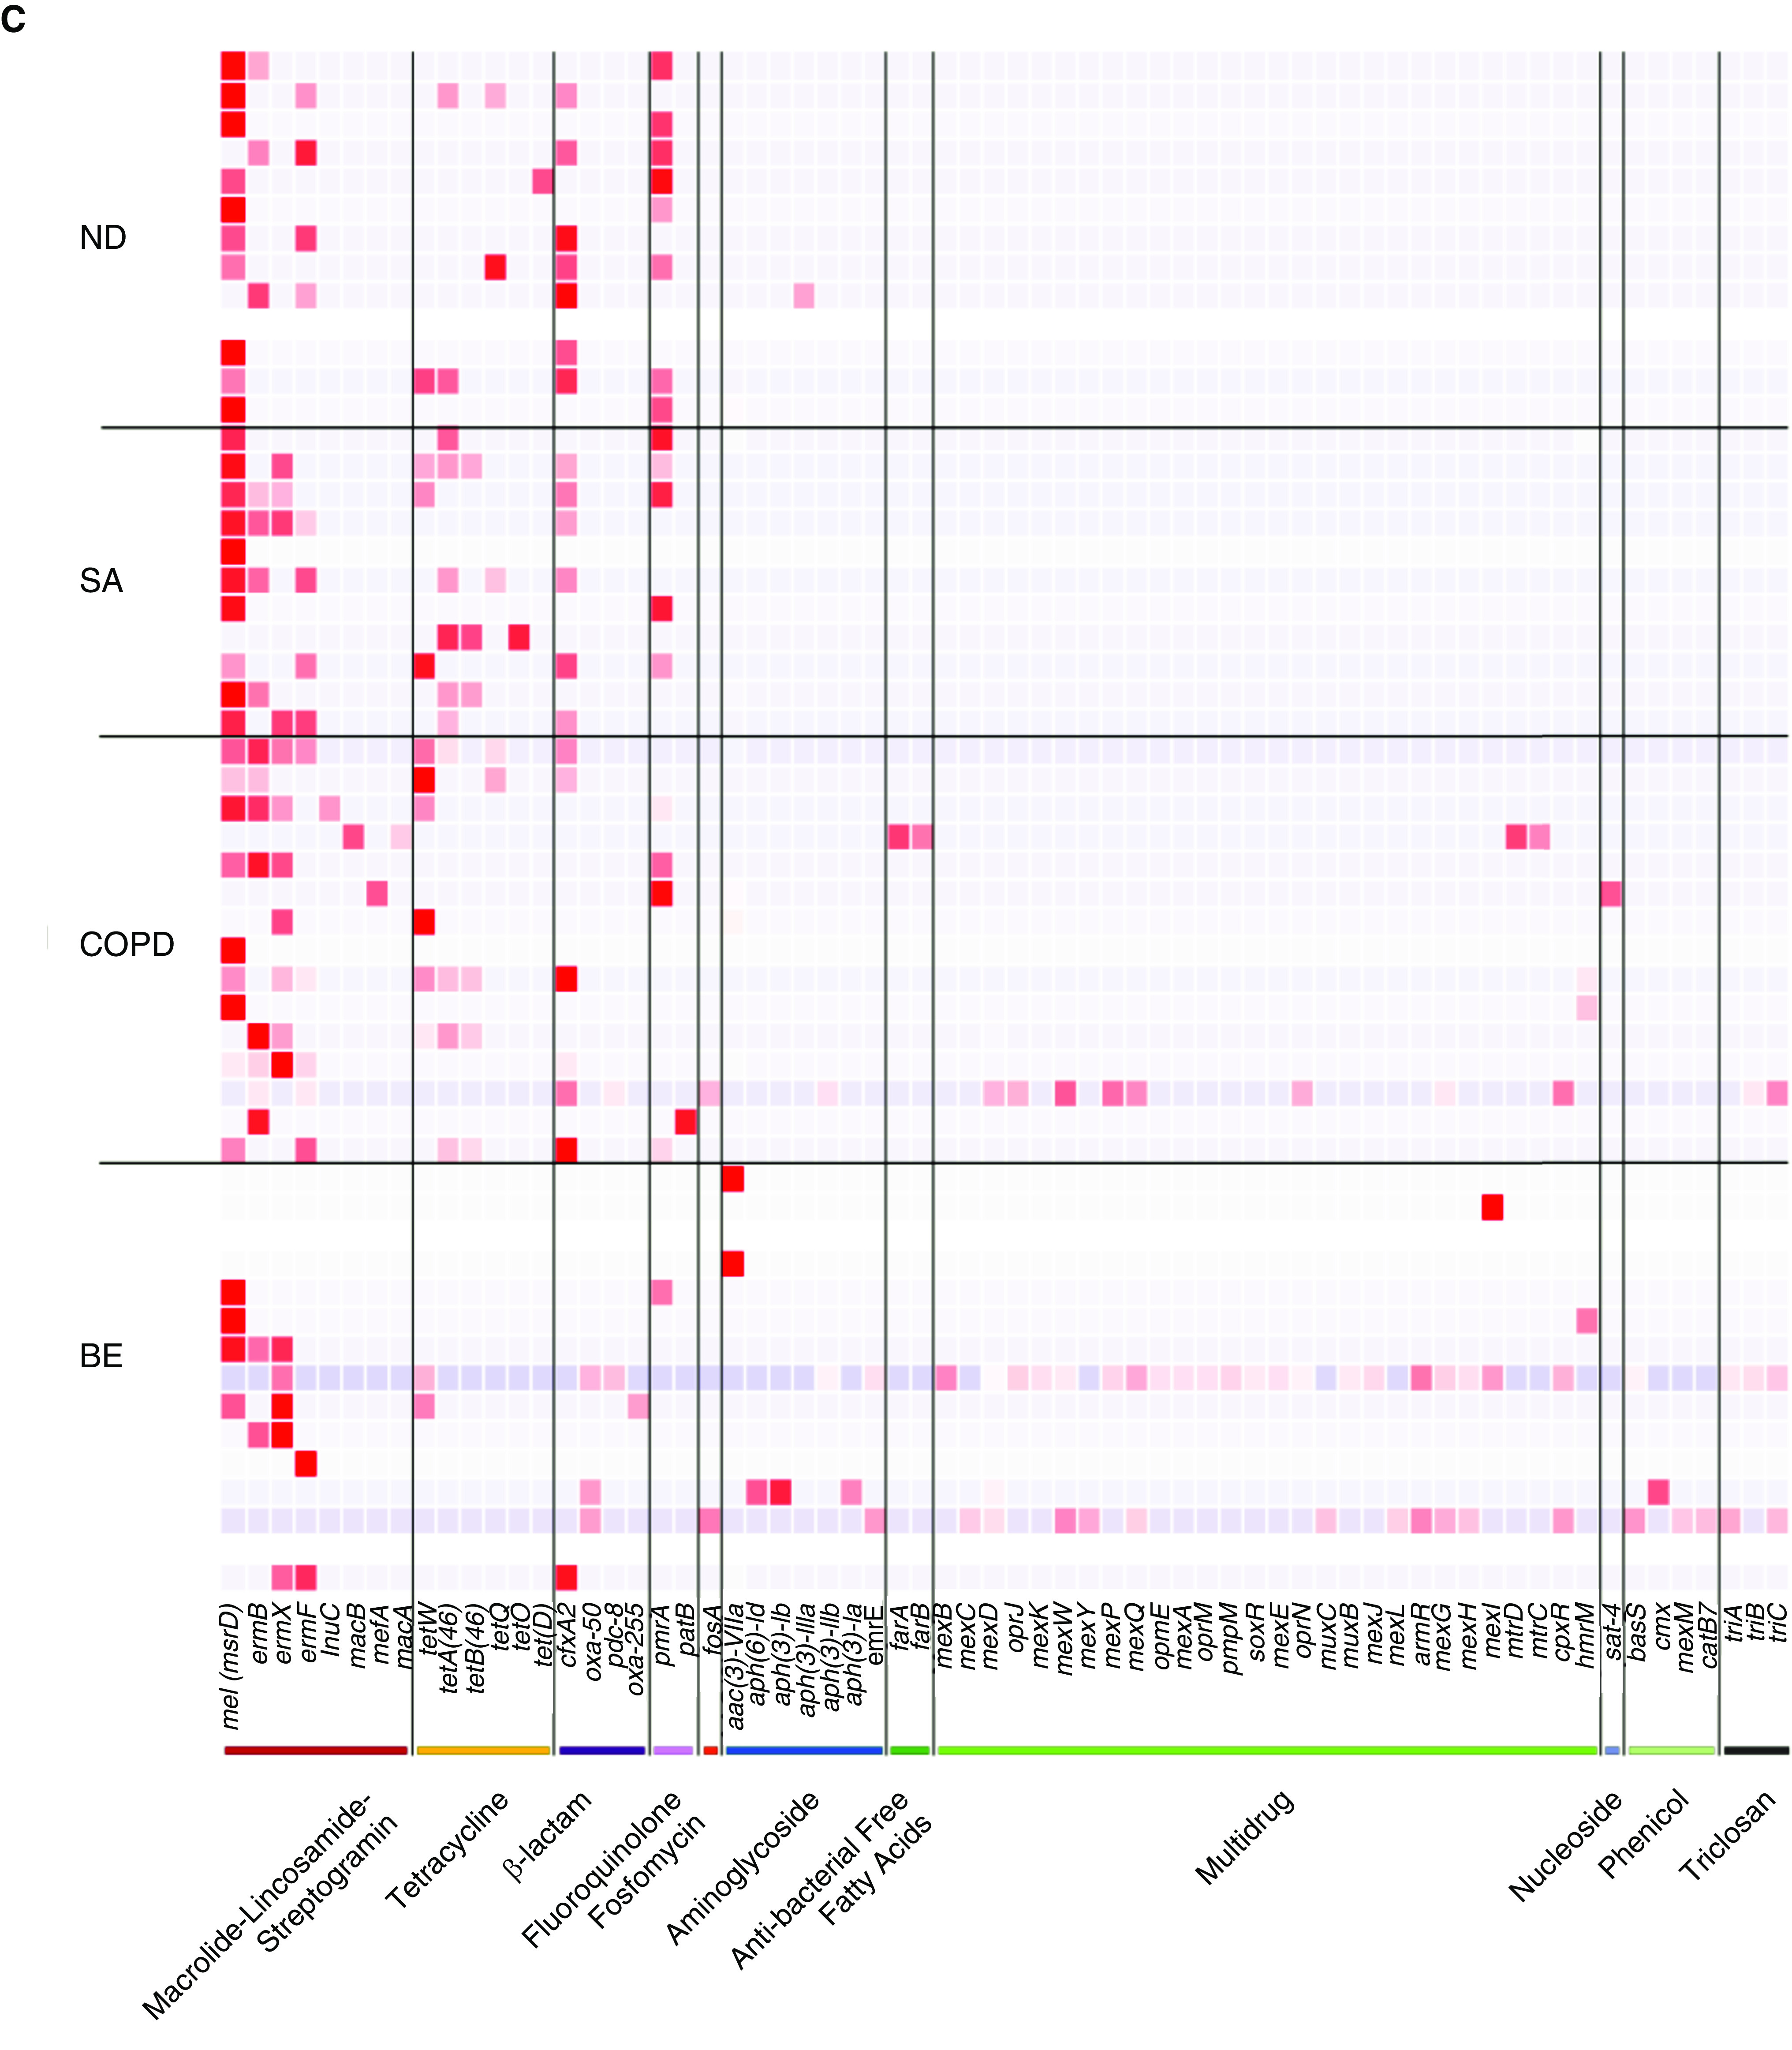
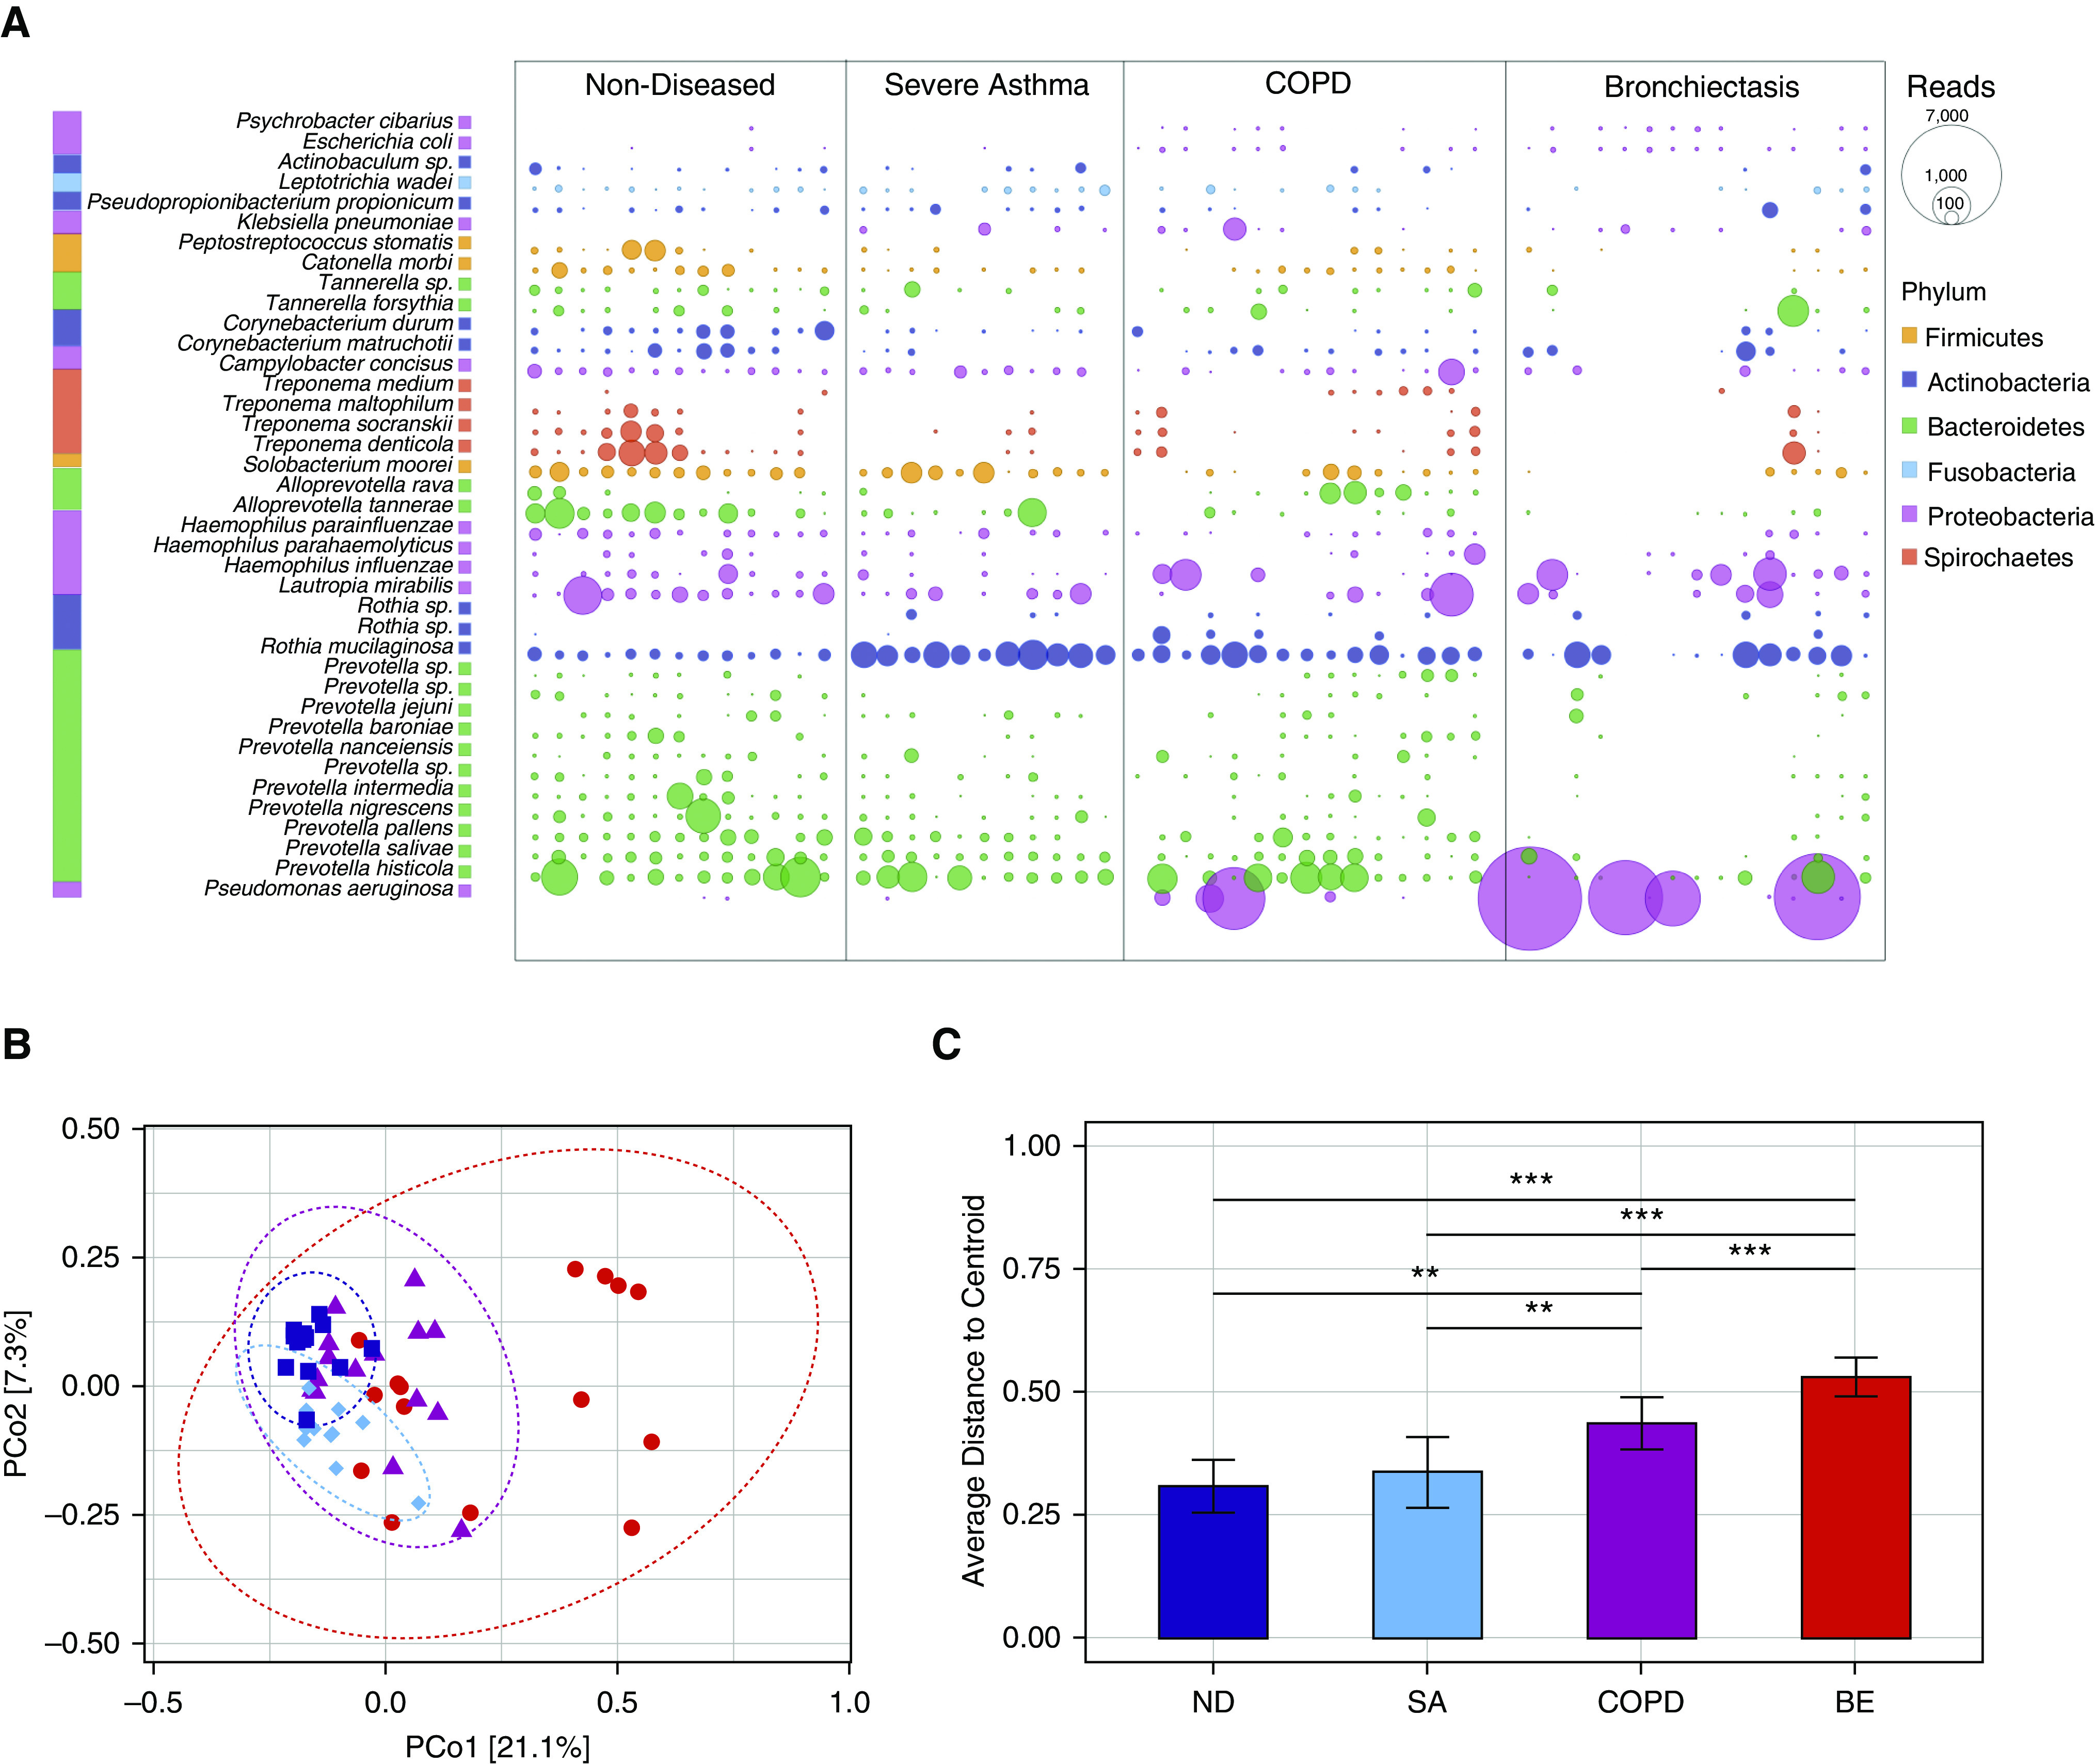
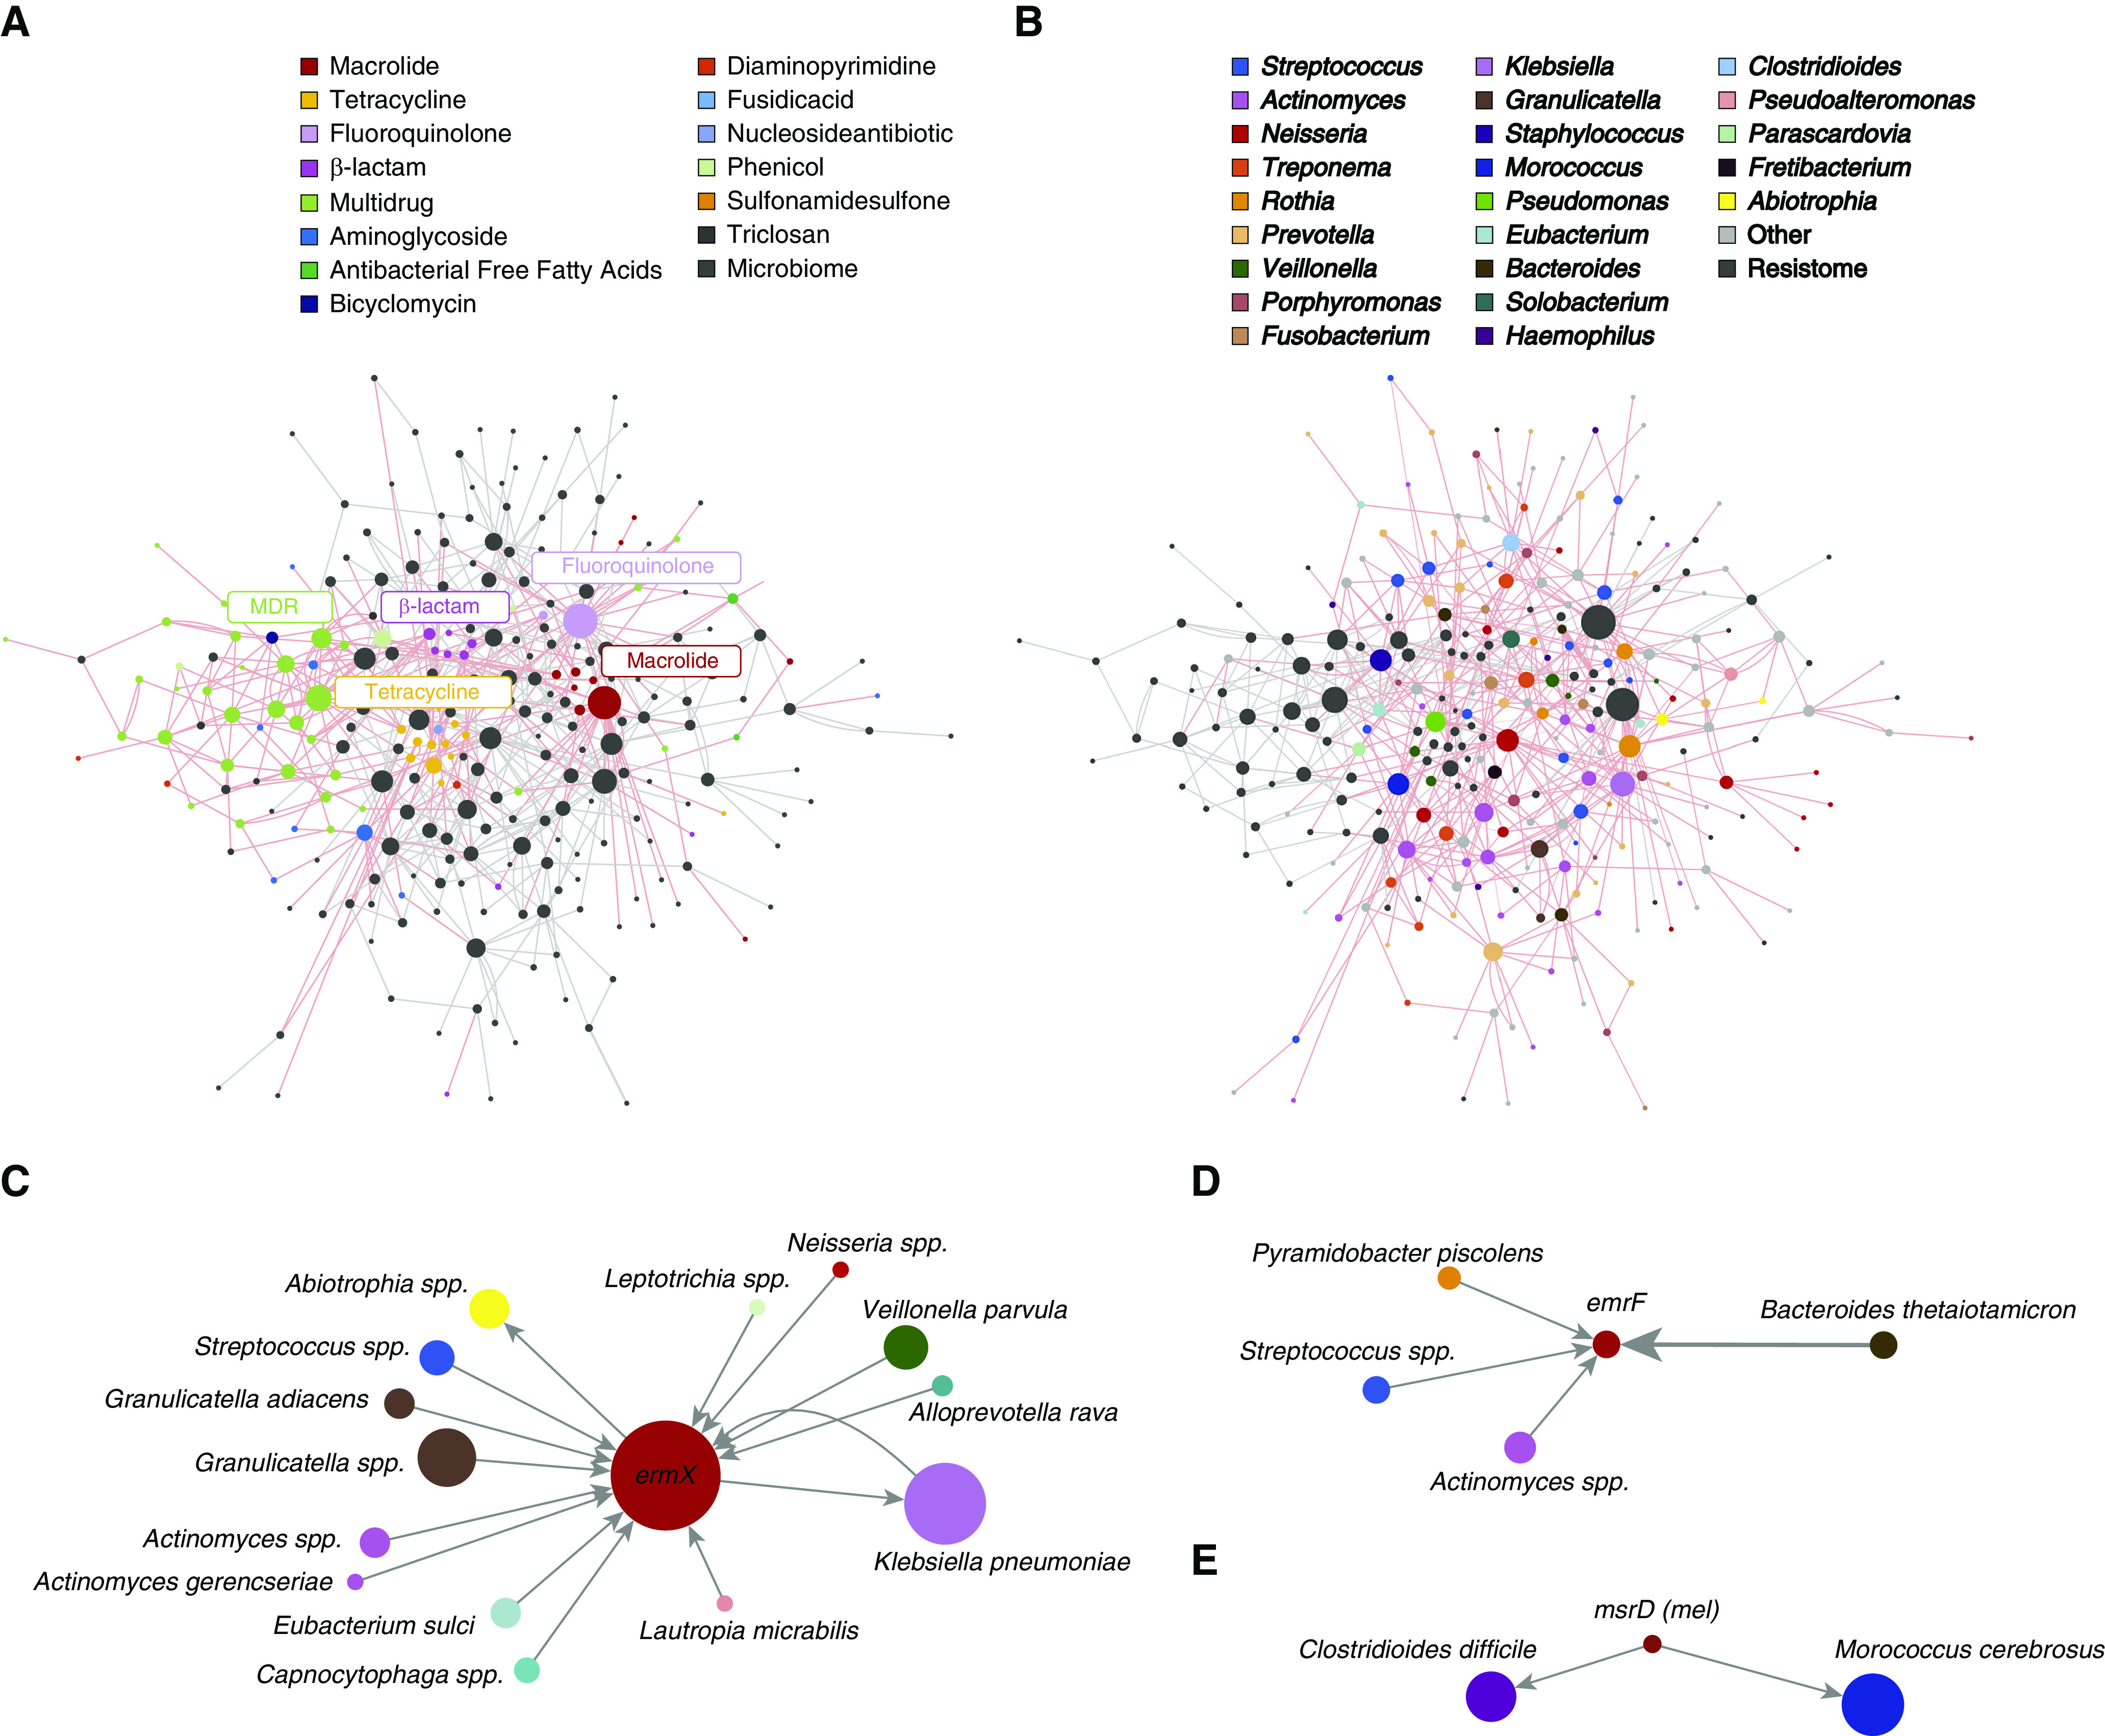
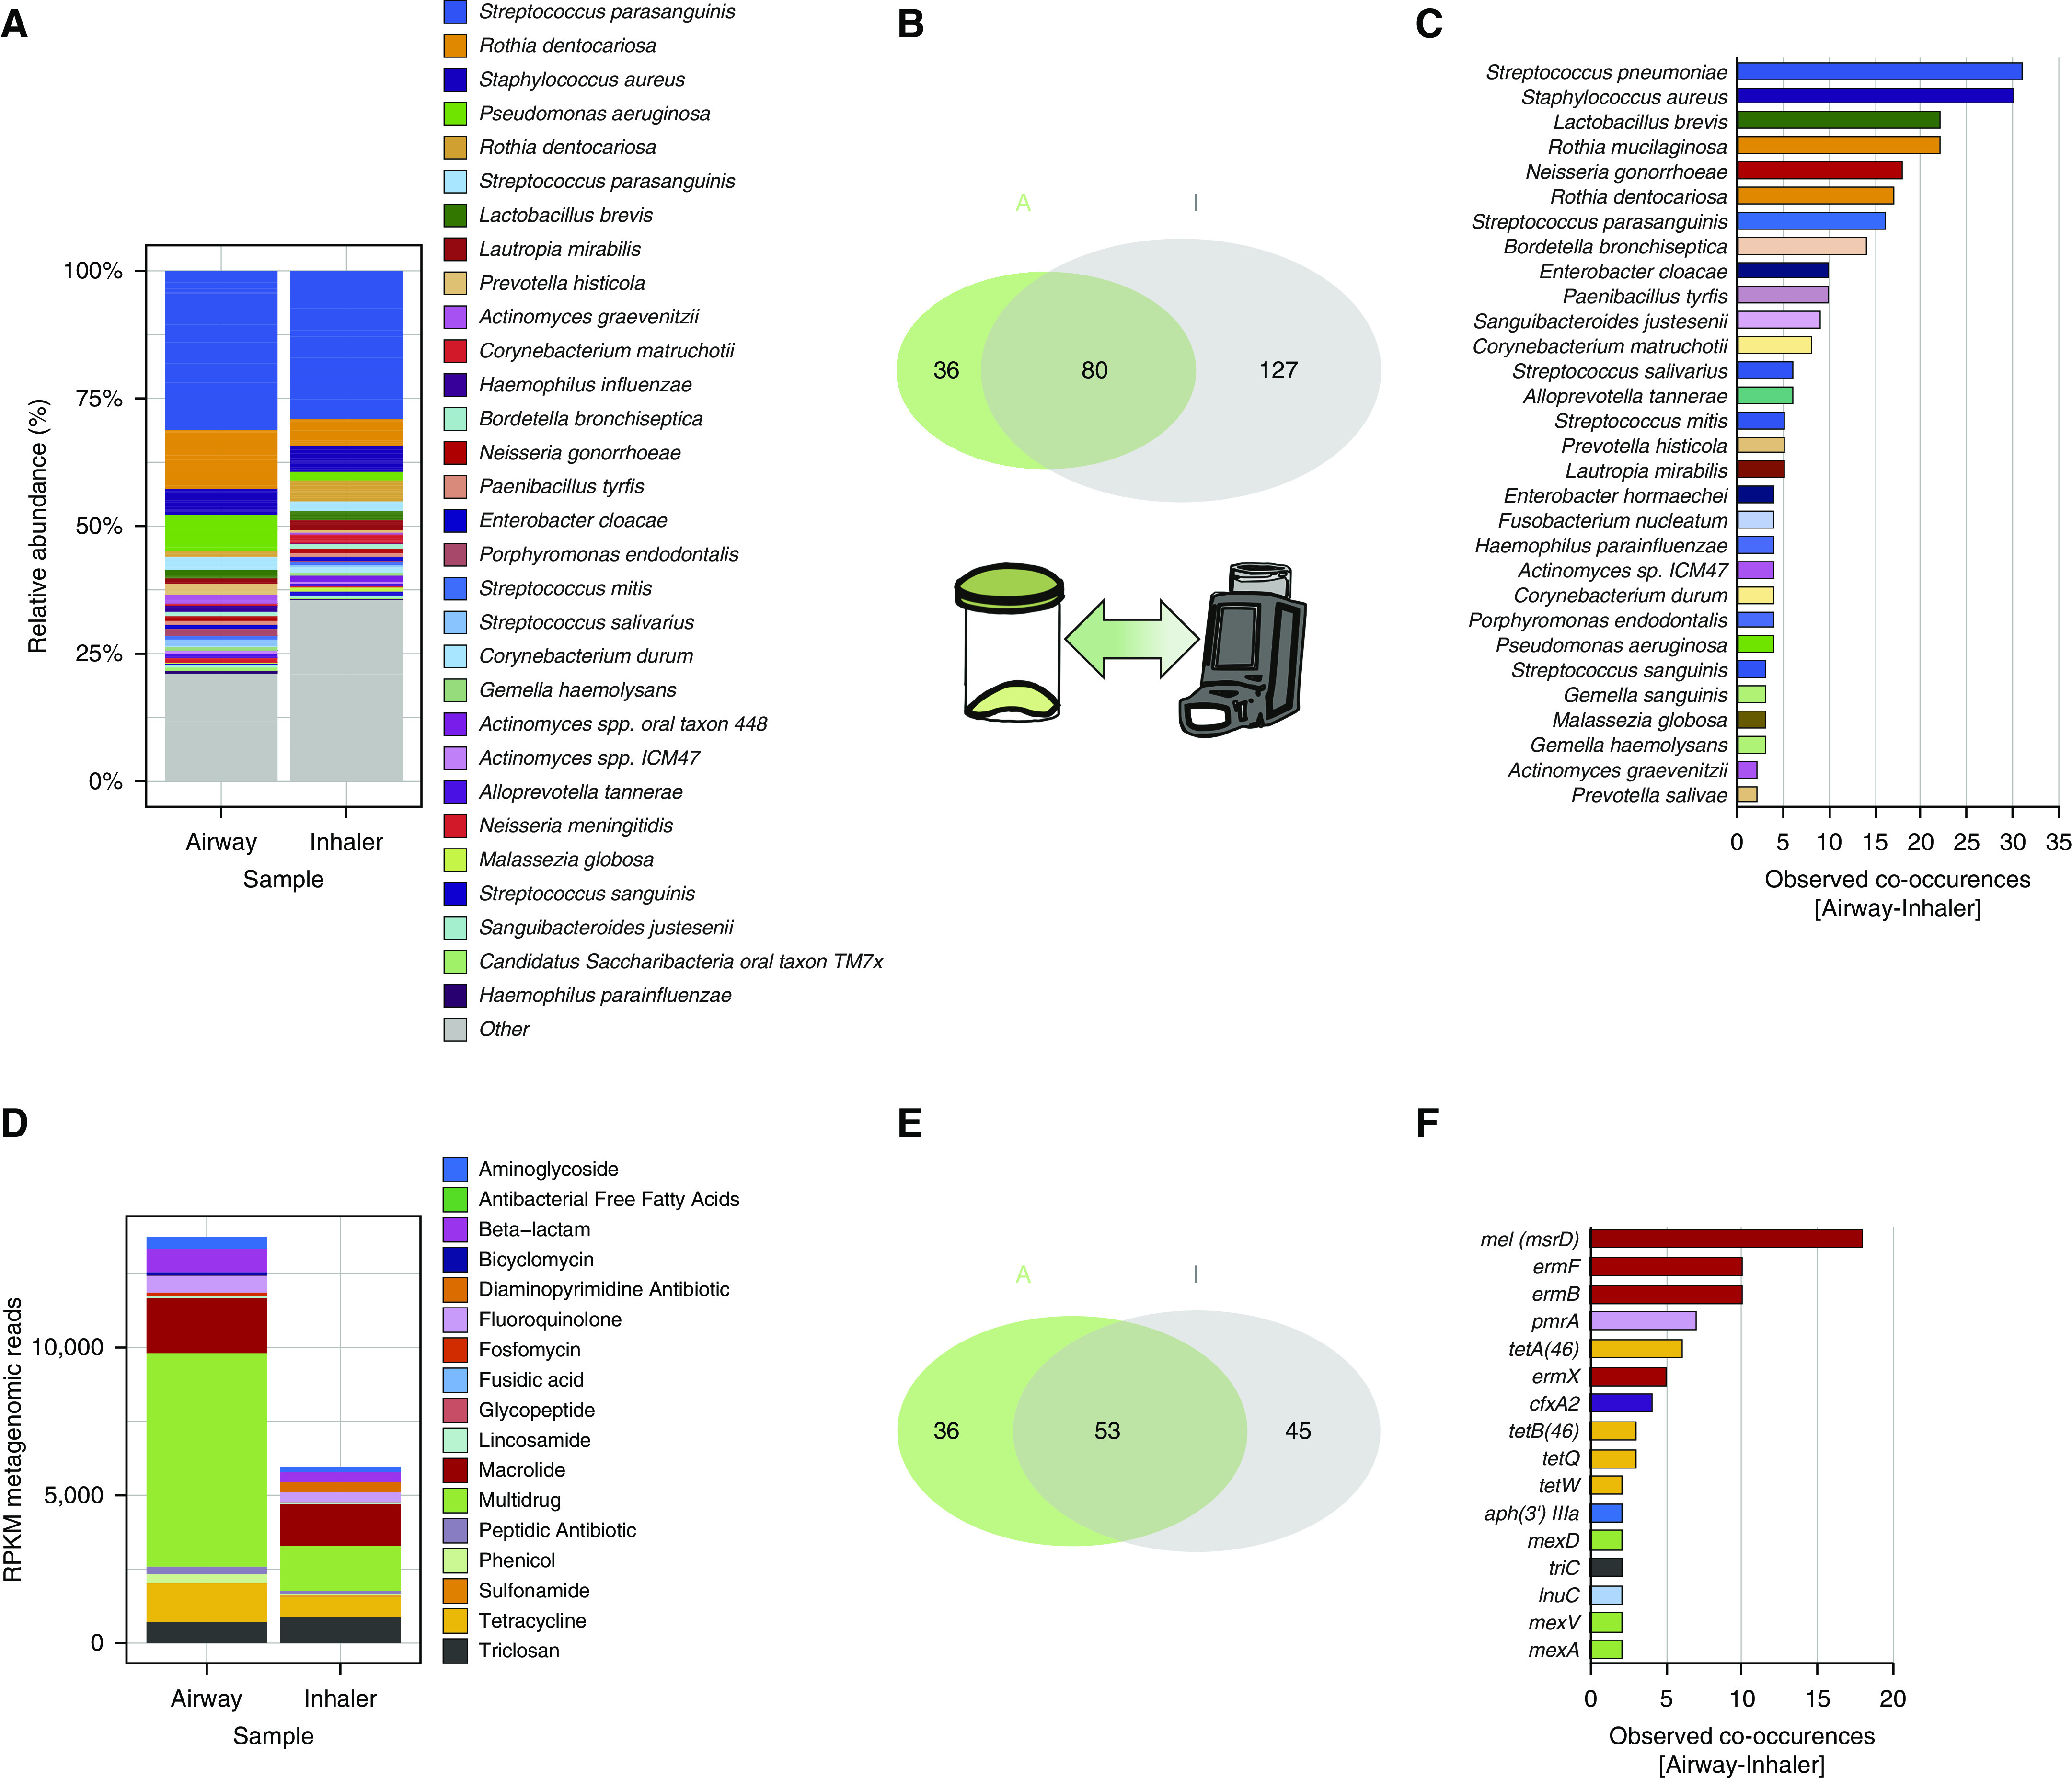
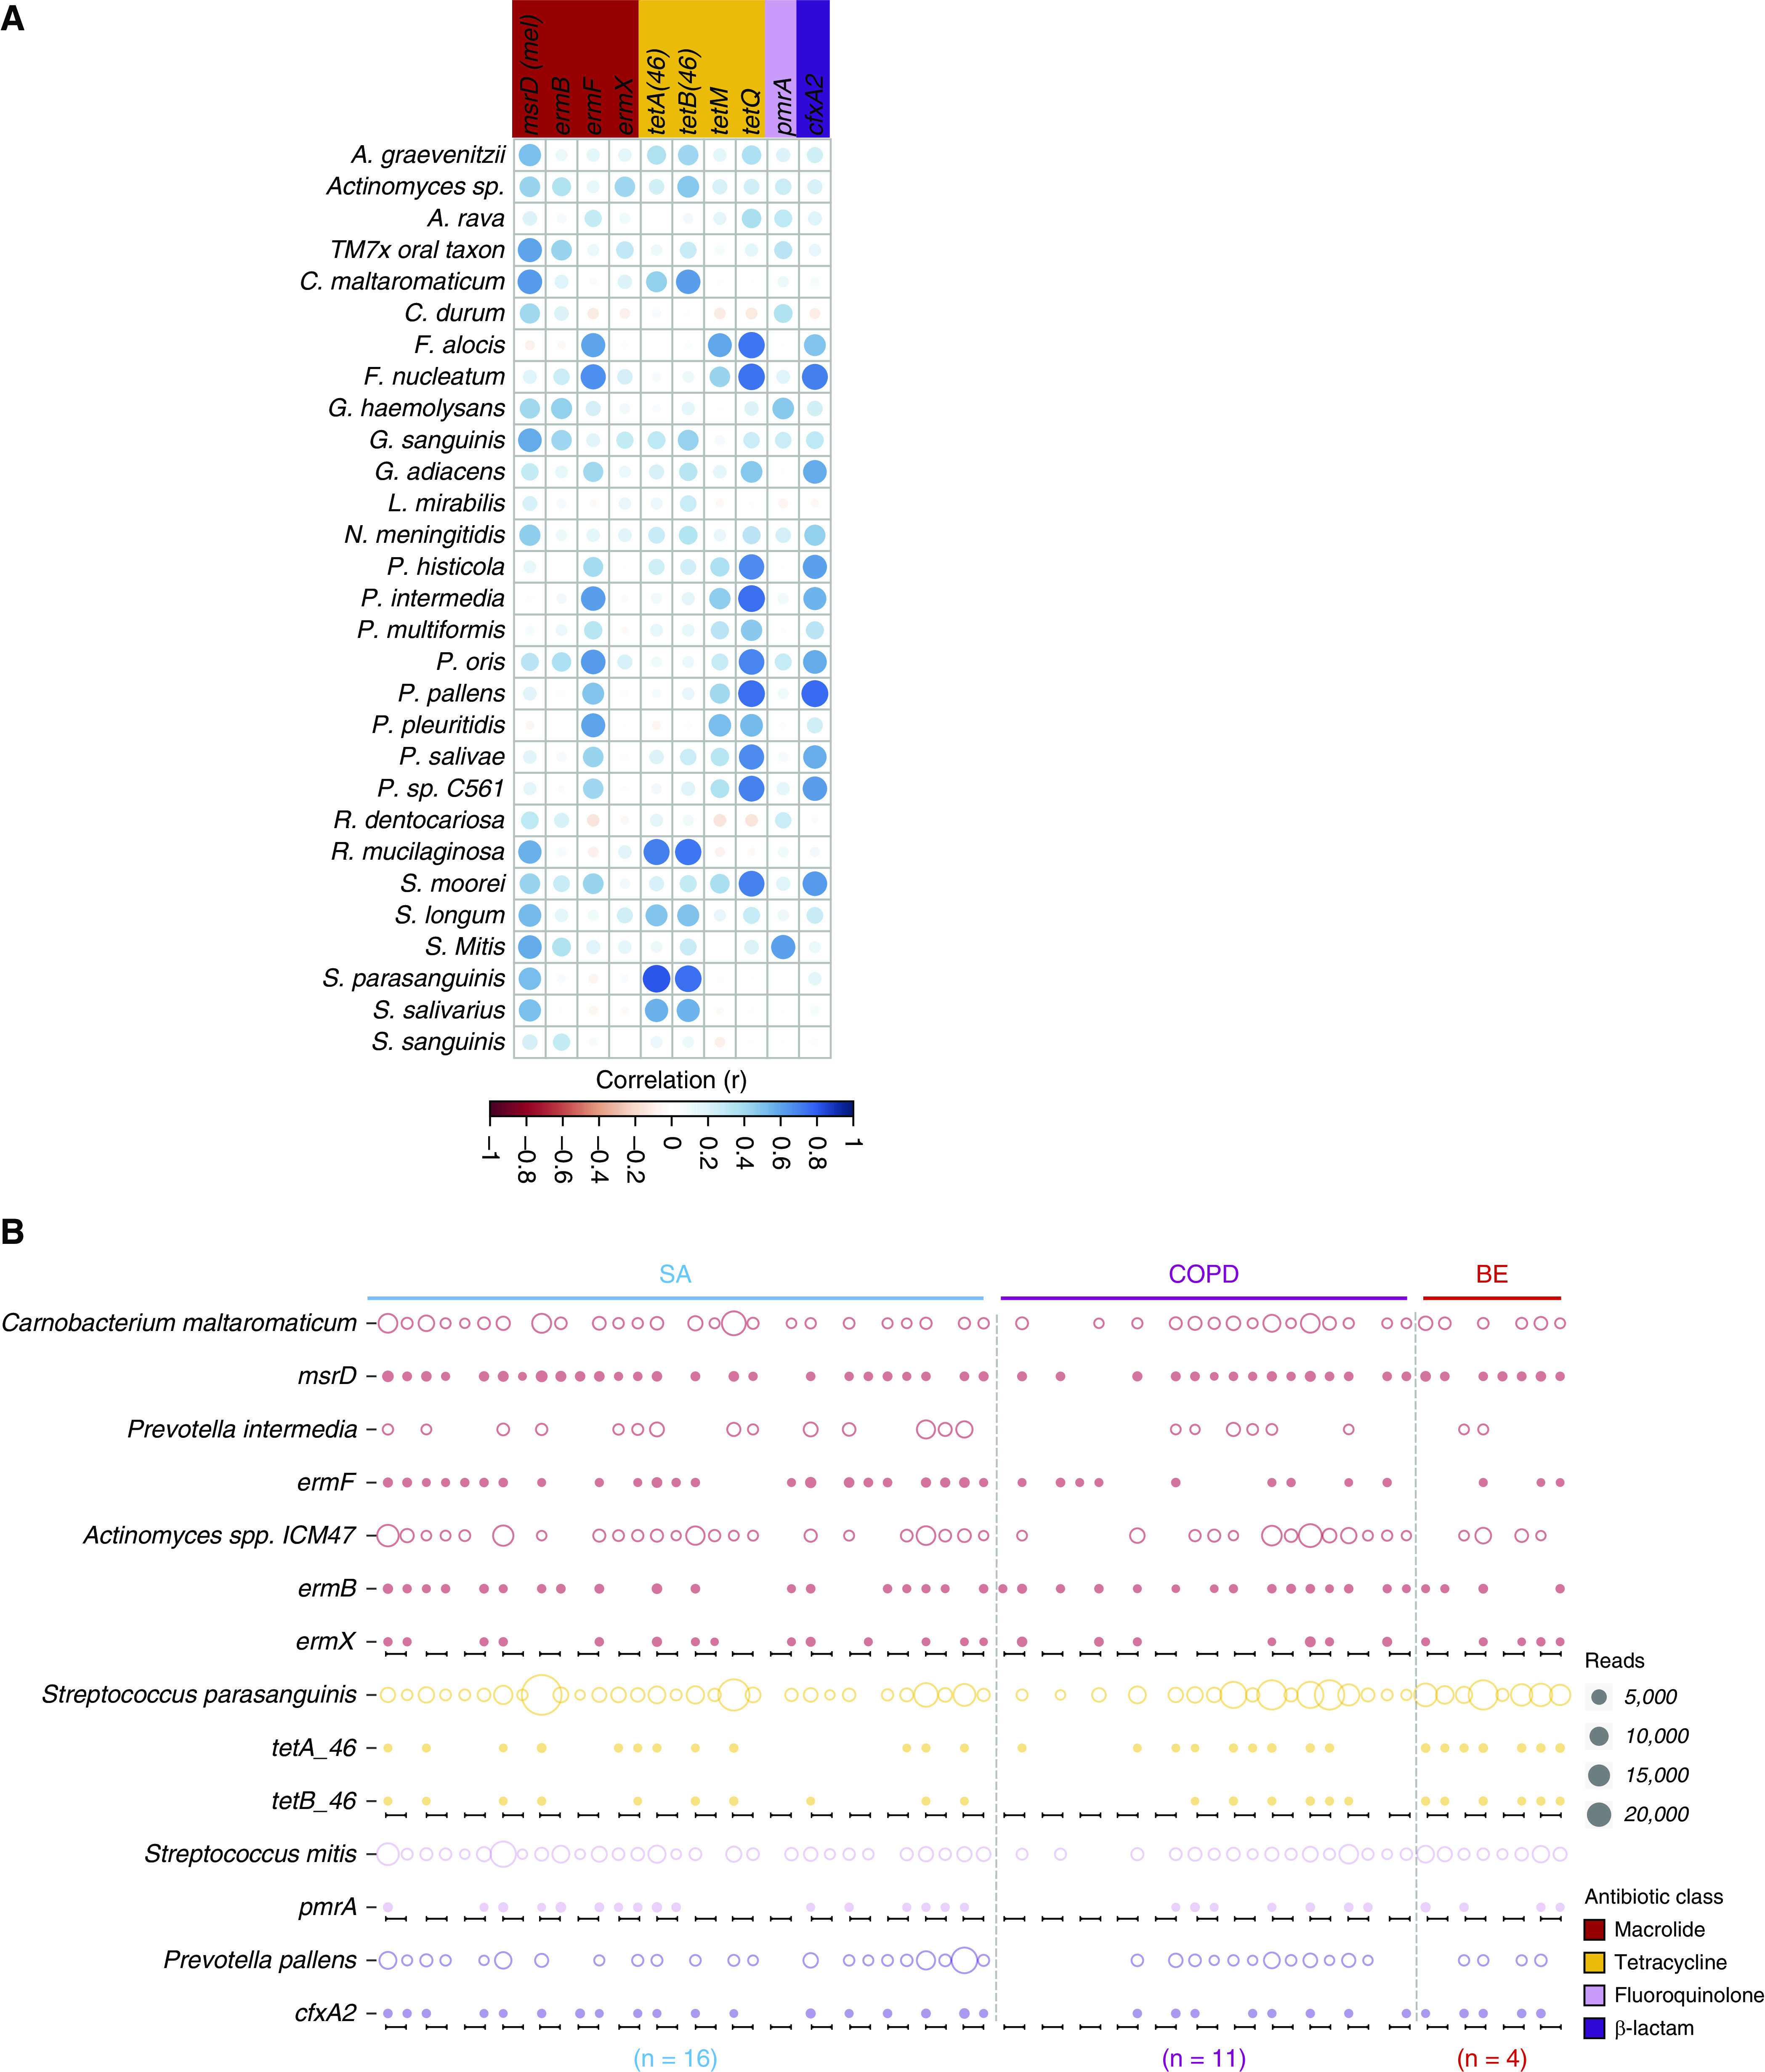
Rationale: Long-term antibiotic use for managing chronic respiratory disease is increasing; however, the role of the airway resistome and its relationship to host microbiomes remains unknown.Objectives: To evaluate airway resistomes and relate them to host and environmental microbiomes using ultradeep metagenomic shotgun sequencing.Methods: Airway specimens from 85 individuals with and without chronic respiratory disease (severe asthma, chronic obstructive pulmonary disease, and bronchiectasis) were subjected to metagenomic sequencing to an average depth exceeding 20 million reads. Respiratory and device-associated microbiomes were evaluated on the basis of taxonomical classification and functional annotation including the Comprehensive Antibiotic Resistance Database to determine airway resistomes. Co-occurrence networks of gene-microbe association were constructed to determine potential microbial sources of the airway resistome. Paired patient-inhaler metagenomes were compared (n = 31) to assess for the presence of airway-environment overlap in microbiomes and/or resistomes.Measurements and Main Results: Airway metagenomes exhibit taxonomic and metabolic diversity and distinct antimicrobial resistance patterns. A "core" airway resistome dominated by macrolide but with high prevalence of β-lactam, fluoroquinolone, and tetracycline resistance genes exists and is independent of disease status or antibiotic exposure. Streptococcus and Actinomyces are key potential microbial reservoirs of macrolide resistance including the ermX, ermF, and msrD genes. Significant patient-inhaler overlap in airway microbiomes and their resistomes is identified where the latter may be a proxy for airway microbiome assessment in chronic respiratory disease.Conclusions: Metagenomic analysis of the airway reveals a core macrolide resistome harbored by the host microbiome.

Keywords: antimicrobial resistance; macrolides; metagenomics; resistome; respiratory disease.


Figures

Figure 1.
Figure 1.
Airway shotgun metagenomics reveals functional metabolic dysbiosis and an increased antibiotic resistance gene abundance across chronic respiratory disease states. (A) Heatmap illustrating the relative abundance of functionally classified sequence reads assigned to functional categories (Kyoto Encyclopedia of Genes and Genomes) in each microbiome profile. Values are expressed as z-scores (calculated on the basis of the deviation from the mean abundance in each group and scaled to the SD). Higher abundance (indicated in red) is associated with specific functional pathways including lipid metabolism, xenobiotic biodegradation, and antibiotic-associated biosynthetic pathways. These are highest in patients with chronic obstructive pulmonary disease (COPD) and bronchiectasis. (B) Heatmap illustrating specific antibiotic resistance gene abundance (by class) based on read alignment to the Comprehensive Antimicrobial Resistance Database. β-Lactam, fluoroquinolone, macrolide, and tetracycline resistance genes are detectable in subjects with and without disease. Patients with COPD and bronchiectasis have the highest load of antibiotic resistance determinants. (C) Patient antibiotic usage and respective class (in the 6 mo preceding airway sampling) is indicated by black dots.
Figure 2.
Figure 2.
A core airway resistome exists across respiratory disease states including antibiotic-naive and nondiseased (healthy) individuals. (A) Venn diagram illustrating the number of individual antibiotic resistance genes among the study cohorts and their intersections. (B) An upset plot, corresponding to the presented Venn diagram in A, illustrating the antibiotic resistance gene composition across individual cohorts and their intersections. Stacked bar charts reflect the detected antibiotic resistance genes colored according to antibiotic class. Individual groups and their intersections are indicated for each cohort separately (ND, SA, COPD, and BE), followed by their respective intersection by a matrix (located below stacked bars). Set size (i.e., the number of resistance genes detected per group) is indicated by horizontal bars (ND < SA < COPD < BE). Black dots indicate sets, and connecting lines indicate relevant intersections related to each stacked bar chart. An 18-gene core resistome was identified (across all four cohorts) and largely comprises genes conferring macrolide, tetracycline, β-lactam, and aminoglycoside resistance, whereas the 32 genes shared by patients with COPD and patients with bronchiectasis are predominantly multidrug and triclosan resistance classes. (C) Heatmap illustrating specific antibiotic resistance genes by class and individual cohort. Specific antibiotic resistance genes grouped by colored class (x axis) are plotted against individual cohorts (ND, SA, COPD, and BE) (y axis). Genes are presented in order of detected abundance with msrD (mel), ermB, ermF, and ermX macrolide resistance genes most frequently observed across all four cohorts followed by genes encoding tetracycline, β-lactam, and fluoroquinolone resistance. BE = bronchiectasis; COPD = chronic obstructive pulmonary disease; ND = nondiseased; SA = severe asthma.
Figure 2.
Figure 2.
A core airway resistome exists across respiratory disease states including antibiotic-naive and nondiseased (healthy) individuals. (A) Venn diagram illustrating the number of individual antibiotic resistance genes among the study cohorts and their intersections. (B) An upset plot, corresponding to the presented Venn diagram in A, illustrating the antibiotic resistance gene composition across individual cohorts and their intersections. Stacked bar charts reflect the detected antibiotic resistance genes colored according to antibiotic class. Individual groups and their intersections are indicated for each cohort separately (ND, SA, COPD, and BE), followed by their respective intersection by a matrix (located below stacked bars). Set size (i.e., the number of resistance genes detected per group) is indicated by horizontal bars (ND < SA < COPD < BE). Black dots indicate sets, and connecting lines indicate relevant intersections related to each stacked bar chart. An 18-gene core resistome was identified (across all four cohorts) and largely comprises genes conferring macrolide, tetracycline, β-lactam, and aminoglycoside resistance, whereas the 32 genes shared by patients with COPD and patients with bronchiectasis are predominantly multidrug and triclosan resistance classes. (C) Heatmap illustrating specific antibiotic resistance genes by class and individual cohort. Specific antibiotic resistance genes grouped by colored class (x axis) are plotted against individual cohorts (ND, SA, COPD, and BE) (y axis). Genes are presented in order of detected abundance with msrD (mel), ermB, ermF, and ermX macrolide resistance genes most frequently observed across all four cohorts followed by genes encoding tetracycline, β-lactam, and fluoroquinolone resistance. BE = bronchiectasis; COPD = chronic obstructive pulmonary disease; ND = nondiseased; SA = severe asthma.
Figure 3.
Figure 3.
Metagenomic microbiome taxonomic composition exhibits disease-associated signatures with greatest heterogeneity in COPD and bronchiectasis. (A) Bubble chart illustrating microbial abundance of discriminant taxa in nondiseased versus diseased cohorts based on species-level classification. Bubble size corresponds to read count, and phylum membership is color-coded. Rothia mucilaginosa was consistently increased in subjects with disease versus subjects without disease (Dunn’s test, P = 0.01), whereas Pseudomonas aeruginosa was also increased, most notably among patients with bronchiectasis (Dunn’s test, P = 0.02). (B) A principle coordinate analysis plot illustrating β-diversity between the study groups including ND (dark blue), SA (light blue), COPD (purple), and BE (red), each highlighted by a colored ellipse. (C) The average distances to centroid from the principle coordinate analysis was plotted for each respective study group illustrating the heterogeneity of their respective microbiome profiles (error bars reflect SD). Difference in average distance to centroid was formally confirmed by ANOVA and Tukey post hoc analysis; **P < 0.01 and ***P < 0.001. BE = bronchiectasis; COPD = chronic obstructive pulmonary disease; ND = nondiseased; PCo1 = principle coordinate 1; PCo2 = principle coordinate 2; SA = severe asthma.
Figure 4.
Figure 4.
Network inference through co-occurrence analysis reveals gene–microbe associations of the core macrolide resistome. (A) Antibiotic resistance genes within the co-occurrence network are color-coded with respect to antibiotic class, whereas microbes are colored black. Gray lines denote interactions between nodes (representing both microbes and resistance genes), with line thickness reflecting their observed interaction strength. Interactions between resistance genes are highlighted by red lines. (B) Microbes within the co-occurrence network are color-coded with respect to their species, whereas antibiotic resistance genes are colored black. Gray lines denote interactions between nodes (microbes or resistance genes), with thickness reflecting interaction strength. Interactions between species are highlighted by red lines. (C–E) Identified nodes of the macrolide resistome are highlighted, indicating the specific microbes (by species) that associate with ermX (C), ermF (D), and msrD (E). Line thickness reflects the observed interaction strength between microbial nodes and the central resistance gene, whereas arrows depict directionality of the co-occurrence prediction.
Figure 5.
Figure 5.
Metagenomics assessment of inhaler devices as potential antibiotic resistance reservoirs. Metagenomics shotgun analyses were performed on paired (airway–inhaler) specimens obtained through sputum collection and swabbing of mouthpieces of patient-inhaler devices. n = total of 31 pairs consisting of n = 16 (severe asthma), n = 11 (chronic obstructive pulmonary disease), and n = 4 (bronchiectasis). (A) Microbiome profiles of paired airway–inhaler devices exhibit a comparable overall pattern illustrated by stacked bar plots of a species-level relative abundance. (B) Venn diagram illustrating the observed metagenomics-derived microbial taxa present in the airway (green set, “A,” n = 116) and inhaler device (gray set, “I,” n = 207) and the co-occurrence of microbial species that are detectable in both groups (intersect, n = 80). Thirty-six and 127 species were therefore unique to the airway sputum and inhaler metagenomics profiles, respectively. (C) Horizontal bar plot indicating microbial species confirmed to co-occur in paired specimens (i.e., species found in both the airway and inhaler device of the same patient) (n = 63 species). (D) Resistance gene profiles for paired airway–inhaler devices demonstrate comparability with a higher abundance of resistance genes (measured in RPKM) detected in airway specimens. (E) Venn diagram illustrating the observed diversity of resistance genes detected in airway specimens (green set, “A,” n  = 89) and inhaler devices (gray set, “I,” n = 98) by metagenomics. Co-occurrence of a significant number of microbial species were detected (intersect, n = 53 species). Thirty-six and 45 resistance genes were unique to the airway sputum and inhaler metagenomics profiles, respectively. (F) Horizontal bar plot indicating resistance genes confirmed to co-occur in paired specimens (i.e., genes found in both the airway and inhaler device of the same patient) (n = 46 genes). Gene co-occurrences observed in n ≥ 2 subjects are plotted. RPKM = reads per kilobase million.
Figure 6.
Figure 6.
Metagenomic derivation of microbe–gene associations highlighting a potential source of resistance implicated in airway–inhaler device crossover. (A) Correlation plot of microbes and resistance genes coidentified in metagenomic profiles from paired patient airway and inhaler device specimens. The presence of a circle indicates significant association (P < 0.05), whereas circle size and color intensity reflect observed Pearson’s correlation for all pairwise comparisons indicating the strong positive correlations detected between microbes and resistance genes. The antibiotic resistance genes are color-coded according to their respective antibiotic class. (B) Bubble chart illustrating the co-occurrence of the most highly correlated microbe (open circle) and resistance gene (solid circle) combinations illustrated by disease (i.e., SA, COPD, and BE). Bubble size represents the number of classified reads, whereas color indicates the antibiotic class. Black bars along x axis indicate each individual paired airway and inhaler specimen, respectively (from left to right). A. graevenitzii = Actinomyces graevenitzii; A. rava = Alloprevotella rava; BE = bronchiectasis; COPD = chronic obstructive pulmonary disease; C. maltaromaticum = Carnobacterium maltaromaticum; C. durum = Corynebacterium durum; F. alocis = Filifactor alocis; F. nucleatum = Fusobacterium nucleatum; G. adiacens = Granulicatella adiacens; G. haemolysans = Gemella haemolysans; G. sanguinis = Globicatella sanguinis; L. mirabilis = Lautropia mirabilis; N. meningitidis = Neisseria meningitidis; P. histicola = Prevotella histicola; P. intermedia = Prevotella intermedia; P. multiformis = Prevotella multiformis; P. oris = Prevotella oris; P. pallens = Prevotella pallens; P. pleuritidis = Prevotella pleuritidis; P. salivae = Prevotella salivae; P. sp. C561 = Prevotella sp. C561; R. dentocariosa = Rothia dentocariosa; R. mucilaginosa = Rothia mucilaginosa; SA = severe asthma; S. longum = Stomatobaculum longum; S. mitis = Streptococcus mitis; S. moorei = Solobacterium moorei; S. parasanguinis = Streptococcus parasanguinis; S. salivarius = Streptococcus salivarius; S. sanguinis = Streptococcus sanguinis.

Comment in

References

    1. Dickson RP, Erb-Downward JR, Martinez FJ, Huffnagle GB. The microbiome and the respiratory tract. Annu Rev Physiol. 2016;78:481–504. - PMC - PubMed
    1. Pitlik SD, Koren O. How holobionts get sick—toward a unifying scheme of disease. Microbiome. 2017;5:64. - PMC - PubMed
    1. Sibila O, Laserna E, Shoemark A, Keir HR, Finch S, Rodrigo-Troyano A, et al. Airway bacterial load and inhaled antibiotic response in bronchiectasis. Am J Respir Crit Care Med. 2019;200:33–41. - PubMed
    1. Herath SC, Normansell R, Maisey S, Poole P. Prophylactic antibiotic therapy for chronic obstructive pulmonary disease (COPD) Cochrane Database Syst Rev. 2018;10:CD009764. - PMC - PubMed
    1. Miravitlles M, Anzueto A. Antibiotics for acute and chronic respiratory infection in patients with chronic obstructive pulmonary disease. Am J Respir Crit Care Med. 2013;188:1052–1057. - PubMed

Publication types

MeSH terms