. 2020 Apr 21;31(3):107549.
doi: 10.1016/j.celrep.2020.107549.

Cellular Importin-α3 Expression Dynamics in the Lung Regulate Antiviral Response Pathways against Influenza A Virus Infection

Affiliations

Cellular Importin-α3 Expression Dynamics in the Lung Regulate Antiviral Response Pathways against Influenza A Virus Infection

Swantje Thiele et al. Cell Rep. .

Erratum in

Abstract

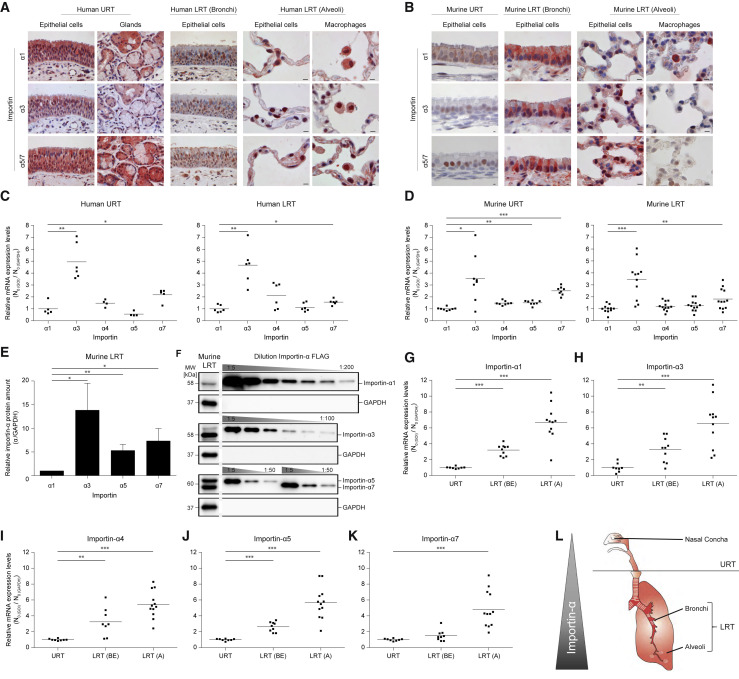
Importin-α adaptor proteins orchestrate dynamic nuclear transport processes involved in cellular homeostasis. Here, we show that importin-α3, one of the main NF-κB transporters, is the most abundantly expressed classical nuclear transport factor in the mammalian respiratory tract. Importin-α3 promoter activity is regulated by TNF-α-induced NF-κB in a concentration-dependent manner. High-level TNF-α-inducing highly pathogenic avian influenza A viruses (HPAIVs) isolated from fatal human cases harboring human-type polymerase signatures (PB2 627K, 701N) significantly downregulate importin-α3 mRNA expression in primary lung cells. Importin-α3 depletion is restored upon back-mutating the HPAIV polymerase into an avian-type signature (PB2 627E, 701D) that can no longer induce high TNF-α levels. Importin-α3-deficient mice show reduced NF-κB-activated antiviral gene expression and increased influenza lethality. Thus, importin-α3 plays a key role in antiviral immunity against influenza. Lifting the bottleneck in importin-α3 availability in the lung might provide a new strategy to combat respiratory virus infections.

Keywords: cytokine storm; immune sensor; influenza; lung; pneumonia.


Conflict of interest statement

Declaration of Interests The authors declare no conflicts of interest.

Figures

None
Graphical abstract
Figure 1
Figure 1
Importin-α Expression in the Mammalian Respiratory Tract (A and B) Importin-α1, -α3, or -α5/7 proteins were stained (red) in human (A) or murine (B) upper (URT, nasal epithelial cells) and lower respiratory tract (LRT, bronchi and alveoli) sections by IHC-P (immunohistochemistry-paraffin protocol) and counterstained with hematoxylin. The importin-α7 antibody cross-reacts with importin-α5. 400× (URT and bronchi in A) or 1000× (alveoli in A and B) original magnification. Scale bar, 10 μm. (C and D) Importin-α mRNA levels in the human (C) and murine (D) URT and LRT determined by qRT-PCR. Relative importin-α1 expression values were set to 1 after normalization against GAPDH (Glycerinaldehyd-3-phosphat-dehydrogenase). Each data point represents an individual sample (n = 6–12). (E and F) Importin-α protein amounts in murine LRT. Western blot analyses using importin-α isoform-specific antibodies and GAPDH adjustment were performed to determine endogenous importin-α protein amounts (α1, α3, α5, α7) in murine organs. For relative quantification (E), standard curves of affinity-purified, FLAG-tagged importin-α proteins were used. Relative importin-α1 protein amount in murine LRT was set to 1. Data shown represent means ± SD (n = 3 biological replicates; technical replicates: n = 1–2 per organ, n = 1–2 western blot analyses). Representative western blots for the endogenous importin-α isoforms and the standard curves are shown in (F). The gaps in (F) depict cropping of the relevant bands run on the same gel. (G–K) Comparison of importin-α mRNA expression levels between murine URT and LRT: α1 (G), α3 (H), α4 (I), α5 (J), or α7 (K). A, alveoli; BE, bronchiolar epithelium; n = 8–12. (L) Schematic partition of the RT with increasing importin-α mRNA levels from URT to LRT. p < 0.05; ∗∗p < 0.01; ∗∗∗p < 0.001.
Figure 2
Figure 2
Molecular Function and Regulation of Importin-α3 (A) Schematic overview of importin-α3-mediated NF-κB p65 nuclear translocation. (B) Pull-down of NF-κB from lysates of untreated or TNF-α-treated A549 cells with Sepharose-immobilized GST-importin-α1 and -α3. Expression of GST-importin-α isoforms was verified with Coomassie staining (upper panel), and bound NF-κB p105, p65, and p50 were detected via western blot (lower panel). GAPDH protein detection served as loading control. One representative experiment is shown out of three independent experiments. (C) Effect of TNF-α treatment on expression and localization of NF-κB p65 and importin-α3 in WT MEFs (n = 3). (D and E) Nuclear fraction (NF; control p84) and cytoplasmic fraction (CF; control GAPDH) localization of NF-κB p65 in α3−/− MEFs or WT controls thereof (α3+/+) after TNF-α treatment using cell fractionation assay (D) or immunofluorescence (E) as well as quantifications thereof (n = 3–5). Scale bar, 20 μm. (F and G) After seeding, cells were serum starved for 24 h. Subsequently, cells were control treated (w/o) or treated with TNF-α. Endogenous importin-α3 and NF-κB p65 protein levels were detected and quantified for whole-cell lysates (WCLs), CFs and NFs of WT MEFs (n = 3) (F), and WCLs of HSAEpCs (n = 3) (G). Control-treated samples of each fraction were set to 100%. (H) NF-κB binding sites in the promoter element of the human importin-α3 gene in A549 cells (Raskatov et al., 2012). (I–K) Effect of TNF-α treatment on importin-α3 promoter activity in HSAEpC (n = 2) (I), MEFs (n = 3) (J), and A549 cells (n = 6) (K) upon control (Ctr) or importin-α3 promoter reporter construct (α3) transfection. Relative importin-α3 promoter activity in control-treated samples was set to 100%. (L) Importin-α3 mRNA levels in mock or TNF-α-treated MEF NEMO−/− cells (n = 6). Relative expression values of importin-α3 in samples were normalized to GAPDH, and importin-α1 mRNA expression was set to 1. Each data point represents an individual sample. (M) MEF NEMO−/− cells were transfected with empty plasmid (Mock) or NEMO and untreated or treated with 50 ng TNF-α. Importin-α3 and NEMO protein expression levels were detected (n = 3). GAPDH protein detection served as loading control. (N) MEF NEMO−/− cells were treated with 10 ng TNF-α, IL-6, IL-10, IFN-γ and TGF-β and importin-α3 mRNA levels were measured as described above (n = 3) (O) Importin-α3 gene expression is controlled by TNF-α-activated NF-κB in a dose-dependent manner. Low amounts of TNF-α induce activation of NF-κB and high expression of importin-α3 (upper panel). In contrast, high amounts of TNF-α induce high activation of NF-κB and low expression of importin-α3 (lower panel). Data shown represent means ± SD of at least three independent biological experiments. p < 0.05; ∗∗p < 0.01; ∗∗∗p < 0.001.
Figure 3
Figure 3
HPAIV Replication Kinetics in Importin-α3−/− Cells (A) TNF-α induction in MEFs infected with avian-type SC35-PB2701D or human-type SC35M-PB2701N H7N7 HPAIV (MOI = 0.1) measured by ELISA (n = 3). (B–E) Protein extracts thereof were analyzed and quantified by western blot at 48 h p.i. Importin-α3 and viral NP protein were detected (B and D) and quantified (C and E) with GAPDH (B and C) or NP adjustment (D and E) (n = 4). Dashed lines in (D) depict cropping of the relevant bands run on the same gel. (F and G) Additionally, importin-α1, -α4, -α5, and -α7 and viral NP protein were detected and quantified with GAPDH adjustment to confirm that observed effects were specific for importin-α3. Control-treated, uninfected samples or SC35-PB2701D-infected samples were set to 100%. Cross-reactivity of importin-α antibodies with NP resulted in a band (#) in (B) and (F). (H–K) Growth kinetics of avian-type SC35-PB2701D (H and I) and human-type SC35M-PB2701N (J and K) H7N7 HPAIV in importin-α−/− MEFs (n = 3). WT (black), importin-α3−/− (α3−/−, red), and importin-α7−/− (α7−/−, green) MEFs were infected with low (H and J) or high (I and K) multiplicities of infection (MOI). Virus titers given in plaque-forming units (p.f.u.) were determined by plaque assay on MDCKII cells (0, 24, 48, 72, and 96 h p.i.). (L) H1299 α3+/+ (black) and α3−/− (red) cells were infected with human-type SC35M-PB2701N HPAIV (MOI = 0.001) and replication kinetics measured in the presence or absence of TNF-α (n = 3). Virus titers were determined by plaque assay on MDCKII cells (0, 24, 48 h p.i.). Data shown represent means of relative importin-α amounts or logarithmic virus titers ± SD of at least three independent biological experiments (*p ˂ 0.05; ∗∗∗p < 0.001).
Figure 4
Figure 4
High Importin-α3 Homology across Species and Its Role in HPAIV Interspecies Transmission from Birds to Humans (A–F) Importin-α homologies across animal kingdoms. Homolgies for importin-α1 (A), -α3 (B), -α4 (C), -α5 (D), -α6 (E), and -α7 (F). Pairwise amino acid sequence identities were calculated for importin-α across species. (G and H) Primary human bronchial (HBEpC; G) or primary human small airway epithelial cells (HSAEpC; H) were infected with clinical fatal case A/Thailand/1(KAN-1)/2004 (H5N1, MOI = 1) or A/Netherlands/219/2003 (H7N7, MOI = 10) isolates harboring the original human-type signatures (PB2701N or PB2627K, respectively) or their recombinant avian-type counterparts (PB2701D or PB2627E, respectively). Importin-α3 was quantified in NP-adjusted western blots of HBEpC (H) and HSAEpC (I) infected with H5N1 (MOI = 0.1) or H7N7 (MOI = 1). Importin-α3/NP ratios of human-type virus infected samples at 24 h p.i. were set to 100%. Data shown represent means ± SD of at least three independent biological experiments. p < 0.05; ∗∗p < 0.01; ∗∗∗p < 0.001.
Figure 5
Figure 5
Importin-α3 Expression and Downregulation in Murine Lungs (A–F) WT mice were control treated or infected with 6 × 104 p.f.u. of H7N7 recombinant viruses. Importin-α mRNA expression levels (α1, α3, α4, α5, α7) on day 3 p.i. in lungs upon control treatment (A) or infection with SC35-PB2701D (B), SC35M-PB2701N (C), SC35-PB2701N (D), SC35-NP319K (E), or SC35-PB2701N-NP319K (F) viruses. Relative importin-α1 expression values were set to 1 after normalization against GAPDH. Each data point represents an individual sample (n = 5, p < 0.05). (G and H) Immunohistochemical staining of importin-α3 (G) and viral antigen (H) on day 3 p.i. in the LRT upon infection with H7N7 HPAIV. 400× original magnification. Scale bar, 10 μm. Immunohistochemical staining of virus antigen (red-brown) in the URT and LRT in α3−/− mice or their WT litters α3+/+ infected with 6 × 104 p.f.u. of SC35-PB2701D or SC35M-PB2701N viruses on day 3 p.i. Control mice received PBS.
Figure 6
Figure 6
Genes Responsive to HPAIV Infection in Lungs of WT and Importin-α3−/− Mice WT and importin-α3−/− (α3−/−) mice were infected with SC35-PB2701D (H7N7) or SC35M-PB2701N (H7N7). Control mice received PBS. (A) Heatmap depicting the row Z scores of the normalized expression values of 143 differentially expressed genes (p value ≤ 0.01 and |log 2FC| ≥ 1.5) that were clustered according to their expression profiles in lungs on day 3 p.i. (B) Heatmap depicting row Z scores of the normalized expression values of 79 genes with a previously described role in innate immunity (Engels et al., 2017). (C) TNF-α expression levels detected by transcriptome analysis on day 3 p.i. in lungs of infected α3+/+ mice relative to the maximum expression observed. Control was set to 100%. (D) TNF-α protein levels measured by ELISA on day 1 p.i. in α3+/+ and α3−/− mice. Data show average results obtained from pooled lung samples of three WT mice per virus strain (p < 0.05; ∗∗∗p < 0.001). (E and F) Relative mRNA-expression levels of antiviral genes under an NF-κB promoter determined by qRT-PCR 3 days p.i. in control (E) and infected lungs (F) of α3+/+ and α3−/− mice. Relative expression values of α3+/+ for each gene normalized to HPRT were set to 1. Data shown represent mean ± SD (n = 5; ∗∗p < 0.01; ∗∗∗p < 0.001). (G and H) Survival in α3+/+ and α3−/− mice infected with avian- (G) or human-type (H) H7N7 HPAIV. Data shown represent means ± SD (n = 9 for SC35 and n = 4 for SC53M).

References

    1. Abdel-Ghafar A.N., Chotpitayasunondh T., Gao Z., Hayden F.G., Nguyen D.H., de Jong M.D., Naghdaliyev A., Peiris J.S., Shindo N., Soeroso S., Uyeki T.M., Writing Committee of the Second World Health Organization Consultation on Clinical Aspects of Human Infection with Avian Influenza A (H5N1) Virus Update on avian influenza A (H5N1) virus infection in humans. N. Engl. J. Med. 2008;358:261–273. - PubMed
    1. Anders S., Huber W. Differential expression analysis for sequence count data. Genome Biol. 2010;11:R106. - PMC - PubMed
    1. Basler C.F., Amarasinghe G.K. Evasion of interferon responses by Ebola and Marburg viruses. J. Interferon Cytokine Res. 2009;29:511–520. - PMC - PubMed
    1. Canton J., Fehr A.R., Fernandez-Delgado R., Gutierrez-Alvarez F.J., Sanchez-Aparicio M.T., García-Sastre A., Perlman S., Enjuanes L., Sola I. MERS-CoV 4b protein interferes with the NF-κB-dependent innate immune response during infection. PLoS Pathog. 2018;14:e1006838. - PMC - PubMed
    1. Christiansen A., Dyrskjøt L. The functional role of the novel biomarker karyopherin α 2 (KPNA2) in cancer. Cancer Lett. 2013;331:18–23. - PMC - PubMed

Publication types

MeSH terms

LinkOut - more resources