. 2020 Sep;146(3):555-570.
doi: 10.1016/j.jaci.2020.03.037. Epub 2020 Apr 19.

Human TH1 and TH2 cells targeting rhinovirus and allergen coordinately promote allergic asthma

Affiliations

Human TH1 and TH2 cells targeting rhinovirus and allergen coordinately promote allergic asthma

Lyndsey M Muehling et al. J Allergy Clin Immunol. 2020 Sep.

Abstract

Background: Allergic asthmatic subjects are uniquely susceptible to acute wheezing episodes provoked by rhinovirus. However, the underlying immune mechanisms and interaction between rhinovirus and allergy remain enigmatic, and current paradigms are controversial.

Objective: We sought to perform a comprehensive analysis of type 1 and type 2 innate and adaptive responses in allergic asthmatic subjects infected with rhinovirus.

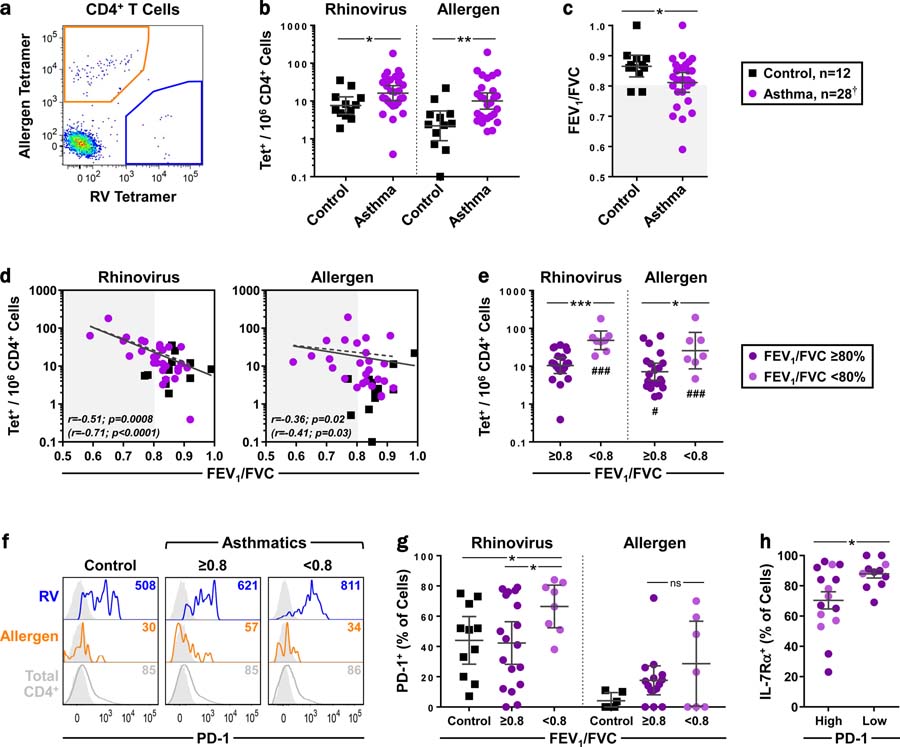
Methods: Circulating virus-specific TH1 cells and allergen-specific TH2 cells were precisely monitored before and after rhinovirus challenge in allergic asthmatic subjects (total IgE, 133-4692 IU/mL; n = 28) and healthy nonallergic controls (n = 12) using peptide/MHCII tetramers. T cells were sampled for up to 11 weeks to capture steady-state and postinfection phases. T-cell responses were analyzed in parallel with 18 cytokines in the nose, upper and lower airway symptoms, and lung function. The influence of in vivo IgE blockade was also examined.

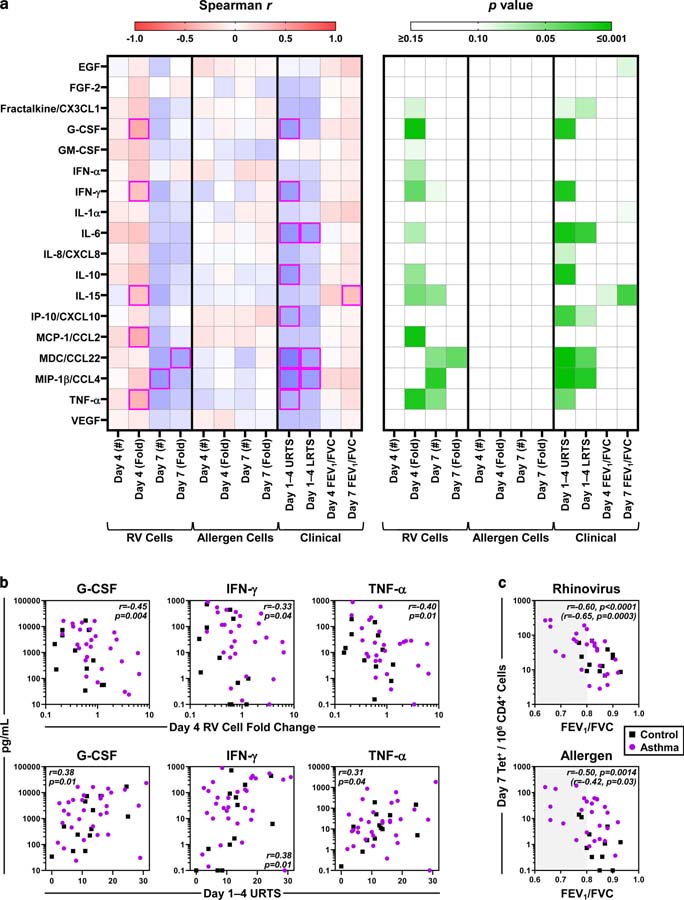
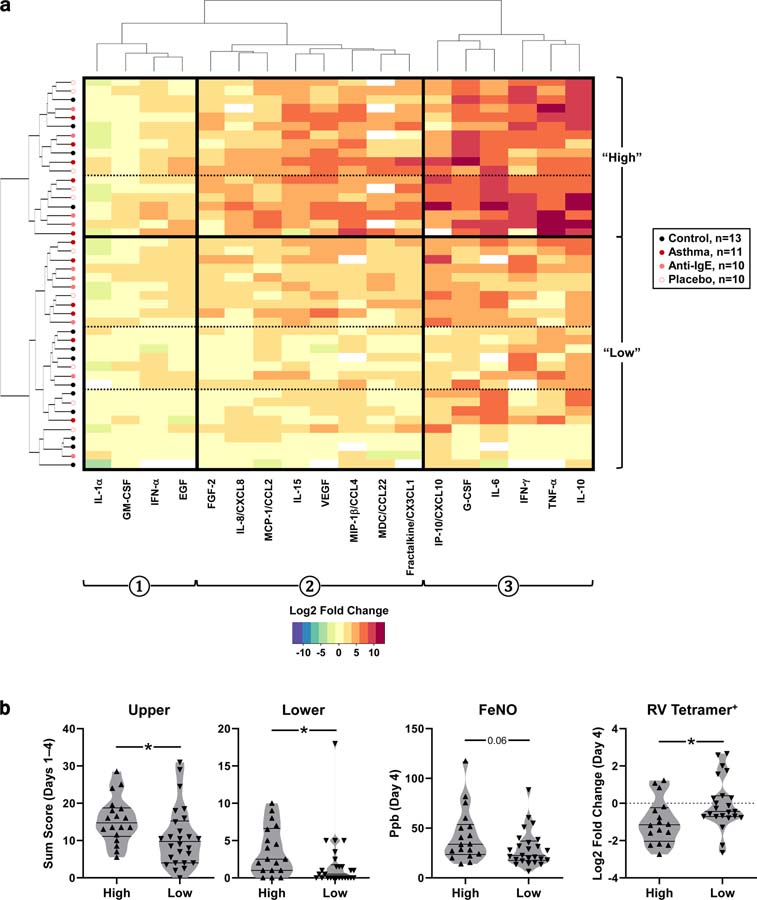
Results: In uninfected asthmatic subjects, higher numbers of circulating virus-specific PD-1+ TH1 cells, but not allergen-specific TH2 cells, were linked to worse lung function. Rhinovirus infection induced an amplified antiviral TH1 response in asthmatic subjects versus controls, with synchronized allergen-specific TH2 expansion, and production of type 1 and 2 cytokines in the nose. In contrast, TH2 responses were absent in infected asthmatic subjects who had normal lung function, and in those receiving anti-IgE. Across all subjects, early induction of a minimal set of nasal cytokines that discriminated high responders (G-CSF, IFN-γ, TNF-α) correlated with both egress of circulating virus-specific TH1 cells and worse symptoms.

Conclusions: Rhinovirus induces robust TH1 responses in allergic asthmatic subjects that may promote disease, even after the infection resolves.

Keywords: IFN; Rhinovirus; T cells; T(H)1; T(H)2; anti-IgE; asthma; cytokines; tetramers.


Conflict of interest statement

Conflict of Interest: The authors declare no conflicts of interest

Figures

Figure 1.
Figure 1.. Activated PD-1+ RV-specific T cells are linked to asthma in the absence of infection.
(a) Representative plot of antigen-specific cells in an uninfected asthmatic. (b) Comparison of RV-specific and allergen-specific T-cell numbers in uninfected asthmatics and controls (geometric mean [GM] ± 95% CI, Mann-Whitney). (c) Comparison of FEV1/FVC between groups at the time of subject screening (GM ± 95% CI, Mann-Whitney). Shaded region denotes decreased lung function. (d) Spearman correlation between antigen-specific T cell-numbers and FEV1/FVC. Dashed regression lines and values in parentheses depict asthmatics only. (e) Numbers of antigen-specific T cells in asthmatics, classified by lung function (GM ± 95% CI, Kruskal-Wallis). #Compared with healthy controls in panel b. (f) Representative histograms of PD-1 expression on antigen-specific T cells, with FMO controls (grey). Values denote geometric mean fluorescence intensity (MFI). (g) Percentage of PD-1+ antigen-specific T cells, by lung function. Samples with low cell counts were excluded from analyses (mean ± 95% CI, Kruskal-Wallis). (h) Expression of IL-7Rα on PD-1high (≥50% positive) and PD-1low (<50% positive) RV-specific T cells in asthmatics (mean ± 95% CI, Mann-Whitney). Panels e, g, & h: Light purple symbols indicate asthmatics with worse lung function. *p≤0.05, **p≤0.01, ***p≤0.001 (#p≤0.05, ###p≤0.001). n=27 for allergen-specific cells.
Figure 2.
Figure 2.. Antigen-specific Th1 and Th2 effectors are armed for airway recruitment in asthmatics.
(a) Representative contour plots of RV-specific T cells overlaid on total CD4+ T cells, analyzed for CCR7 and CD45RO expression. (b & c) Percentage of RV-specific, allergen-specific, and total CD4+ T cells expressing CD45RO (b) or TCM and TEM phenotypes (c). Control, n ≥6; asthma, n ≥22. (Box-and-whiskers, Kruskal-Wallis & Mann-Whitney). (d) Representative plots showing marker expression on antigen-specific and total CD4+ T cells in an asthmatic subject. (e) Comparison of RV- and allergen-specific TCM and TEM surface markers within asthmatic subjects (Box-and-whiskers, Wilcoxon). (f) SPICE plots showing average signatures of RV-specific and allergen-specific TCM and TEM cells in asthmatics and controls. Asterisks denote significant differences for TCM vs TEM subsets within each group. Samples with insufficient numbers of tetramer+ cells were excluded from phenotypic analyses. nd, not determined. *p ≤0.05, **p ≤0.01, ***p ≤0.001.
Figure 3.
Figure 3.. Change in numbers of antigen-specific T cells during RV infection.
(a) RV challenge model. (b) Serum total IgE (left) and FEV1/FVC ratio (right) in asthmatics and controls at the time of subject screening (GM ± 95% CI, Mann-Whitney). Shaded region denotes decreased lung function. (c) Representative flow plots showing tetramer staining for RV-specific and allergen-specific (Der p 1) CD4+ T cells at days 0 and 7 in an asthmatic. (d) Change in antigen-specific T-cell numbers after RV challenge (GM ± 95% CI, generalized estimating equations [GEE]). (e) Fold change in T-cell numbers (Log2-transformed) during RV infection (mean ± SEM, Mann-Whitney). (f) Change in T-cell numbers on day 7. Numbers denote fold change. (g) Change in blood lymphocyte counts during RV infection (mean ± SEM, mixed effects models). T-cell assays: Control, n =12; asthma, n ≥10. Within-group and between-group comparisons for panels d, e, and g are denoted by (*) and (#) respectively: *p ≤0.05, **p ≤0.01, ***p ≤0.001 (#p ≤0.05, ##p ≤0.01, ###p ≤0.001).
Figure 4.
Figure 4.. Phenotypic transitions in antigen-specific T cells in asthmatics during RV infection.
(a) Representative contour plots showing transitions in memory subsets during RV infection. (b) Change in the relative percentages of antigen-specific TN, TCM, and TEM cells compared with day 0 (mean, generalized linear model [GLM]). (c) Change in percentages of antigen-specific T cells expressing PD-1, IL-7Rα, and CCR5 (mean ± SEM, GLM & Kruskal-Wallis). (d) Representative histograms showing change in IL-7Rα expression on antigen-specific T cells (FMO controls shaded in grey). Values denote MFIs. (e) SPICE charts showing signatures of antigen-specific TEM cells. Sample size was determined by numbers of tetramer+ cells sufficient for SPICE analysis. Asthma, n ≥10. *p ≤0.05, **p ≤0.01, ***p ≤0.001.
Figure 5.
Figure 5.. Rhinovirus induces robust type 1 and type 2 responses in the nose of asthmatics.
(a) Levels of Th-associated cytokines in nasal lining fluid (GM ± 95% CI, Mann-Whitney). All groups, n ≥5 for each time point (“dry” samples owing to insufficient secretions were not tested). (b) Levels of T-cell chemoattractants in nasal wash fluid (top, GM, mixed effects models), and Log2 fold change in levels from day 0 (bottom, mean, Mann-Whitney). Asterisks in panel b denote between-group comparisons only. *p ≤0.05, **p ≤0.01, ***p ≤0.001. n =11 and n =10 for MIP-1β.
Figure 6.
Figure 6.. Effect of anti-IgE on the immune response to rhinovirus.
(a) Model of anti-IgE trial with RV challenge. (b) Serum total IgE (left) and FEV1/FVC (right) at the time of subject screening. Shaded areas denote the IgE range suitable for omalizumab, or decreased lung function (GM ± 95% CI, Kruskal-Wallis). (c) Effect of anti-IgE on FcεRIα on basophils and DCs (mean ± SEM, Kruskal-Wallis). (d & e) Transitions in antigen-specific T-cell numbers (d; GM ± 95% CI, mixed-effects models) and their Log2 fold change (e; mean ± SEM, Mann-Whitney). (f) Change in blood lymphocytes counts during infection. (g) Cytokine levels in nasal lining fluid on day 4 (GM ± 95% CI, Kruskal-Wallis). Dry specimens were not tested. Data shown in gray is for asthmatics and controls outside the trial, for comparison purposes. T-cell assays: n ≥8; Cytokine assays: n ≥7. Within-group and between-group comparisons for panels c and d are denoted by (*) and (#), respectively: *p ≤0.05, **p ≤0.01, ***p ≤0.001 (##p ≤0.01).
Figure 7.
Figure 7.. Nasal cytokines, T-cell responses, and respiratory disease are connected.
(a) Spearman r (left) and p values (right) for correlations between peak levels of 18 cytokines in nasal washes (median: days 3–4) and antigen-specific T-cell responses (numbers and fold change), upper respiratory (URTS) and lower respiratory (LRTS) symptoms, and lung function. Magenta boxes denote significant correlations. (b) Spearman correlations of G-CSF, IFN-γ, and TNF-α with T-cell and symptom outcomes. (c) Spearman correlation between the numbers of antigen-specific T cells and FEV1/FVC ratio on day 7. Values in parentheses refer to asthmatics only. Shaded region denotes decreased lung function. n ≥38 (Control, n ≥11; asthma, n ≥26). *p ≤0.05.
Figure 8.
Figure 8.. Identification of high responders to RV by hierarchical clustering.
(a) Heat map of the acute fold change (day 4) for 18 cytokines present in nasal washes from 44 subjects. Hierarchical clustering identified distinct cytokine sets (denoted 1, 2, and 3) that were differentially expressed across subject groups (“high” and “low” responding subjects; solid line) and subsets thereof (dashed lines). (b) Respiratory symptoms, exhaled nitric oxide (FeNO; parts-per-billion, ppb), and fold change in RV-specific T cells in high (n =18) versus low (n =26) responders during the acute phase (Mann-Whitney). Fold change values are Log2-transformed. T-cell assays: n =39 (High, n =16; low, n =23).

Comment in

References

    1. Gwaltney JM Jr. Acute community-acquired sinusitis. Clin Infect Dis 1996;23:1209–23. - PMC - PubMed
    1. Heymann PW, Carper HT, Murphy DD, Platts-Mills TAE, Patrie J, McLaughlin AP, et al. Viral infections in relation to age, atopy, and season of admission among children hospitalized for wheezing. J Allergy Clin Immunol 2004;114:239–47. - PMC - PubMed
    1. Rakes GP, Arruda E, Ingram JM, Hoover GE, Zambrano JC, Hayden FG, et al. Rhinovirus and respiratory syncytial virus in wheezing children requiring emergency care IgE and eosinophil analyses. Am J Respir Crit Care Med 1999;159:785–90. - PubMed
    1. Soto-Quiros M, Avila L, Platts-Mills TAE, Hunt JF, Erdman DD, Carper HT, et al. High titers of IgE antibody to dust mite allergen and risk for wheezing among asthmatic children infected with rhinovirus. J Allergy Clin Immunol 2012;129:1499–505. - PMC - PubMed
    1. Dougherty RH, Fahy JV. Acute exacerbations of asthma: Epidemiology, biology and the exacerbation-prone phenotype. Clin Exp Allergy 2009;39:193–202. - PMC - PubMed

Publication types