

Weight Trajectories After Delivery are Associated with Adiposity and Cardiometabolic Markers at 3 Years Postpartum Among Women in Project Viva
- PMID: 32321175
- PMCID: PMC7330455
- DOI: 10.1093/jn/nxaa104
Weight Trajectories After Delivery are Associated with Adiposity and Cardiometabolic Markers at 3 Years Postpartum Among Women in Project Viva
Abstract
Background: Postpartum weight trajectories and its implications on later cardiometabolic health are not entirely understood.
Objectives: Our objectives were: 1) to characterize maternal weight trajectories from 1 to 24 mo postpartum, 2) to determine the association of prepregnancy BMI, gestational weight gain (GWG), and pregnancy behaviors with the trajectories, and 3) to evaluate the association of weight trajectories with BMI, waist circumference (WC), lipid profile, glucose, insulin resistance, blood pressure, and inflammatory markers at 3 y postpartum.
Methods: We studied 1359 mothers from the prospective cohort Project Viva. Using weights at 1, 6, 12, and 24 mo postpartum, we characterized weight trajectories using a latent class growth model. For objectives 2 and 3, we used multinomial logistic regression and multiple linear regression models, respectively.
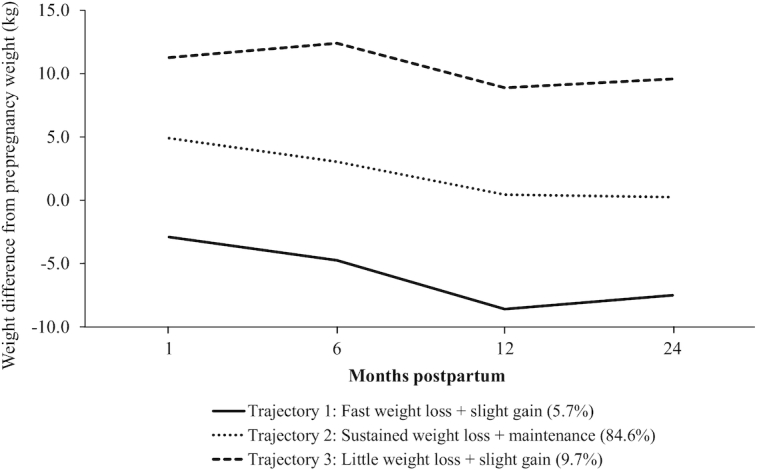
Results: Around 85% of women fell into a trajectory of sustained weight loss (1-12 mo) + maintenance (12-24 mo) (reference), 5.7% followed a trajectory characterized by fast weight loss + slight gain, and 9.7% fell into a trajectory of little weight loss + slight gain. Prepregnancy overweight and obesity increased the odds of falling into the fast weight loss + slight gain trajectory, compared with the reference. Prepregnancy overweight [OR 1.57 (95% CI: 1.01, 2.46)] and a higher total GWG rate [3.69 (2.90, 4.68)] increased the odds of falling into the little weight loss + slight gain trajectory, whereas a higher Prudent dietary pattern score was protective [0.73 (0.54, 0.98)]. Women in this trajectory had higher BMI, WC, weight gain from prepregnancy, low-density lipoprotein cholesterol, and inflammatory markers at 3 y postpartum.
Conclusions: Women following a trajectory of little weight loss + slight gain during the first 2 y postpartum had an adverse cardiometabolic profile 3 y after delivery. Targeting diet and GWG during pregnancy and facilitating postpartum weight loss could improve women's long-term health.
Keywords: Project Viva; adiposity; cardiovascular risk factors; diet; gestational weight gain; postpartum weight change; postpartum weight trajectories; pre-pregnancy BMI.
Copyright © The Author(s) on behalf of the American Society for Nutrition 2020.
Figures


References
-
- Hales CM, Carroll MD, Fryar CD, Ogden CL.. Prevalence of obesity among adults and youth: United States, 2015–2016. NCHS Data Brief. 2017;; 288:1–8. - PubMed
-
- Poston L, Caleyachetty R, Cnattingius S, Corvalan C, Uauy R, Herring S, Gillman MW. Preconceptional and maternal obesity: epidemiology and health consequences. Lancet Diabetes Endocrinol. 2016;4:1025–36. - PubMed
