. 2020 Apr 22;17(1):125.
doi: 10.1186/s12974-020-01740-5.

Suppression of histone deacetylases by SAHA relieves bone cancer pain in rats via inhibiting activation of glial cells in spinal dorsal horn and dorsal root ganglia

Affiliations

Suppression of histone deacetylases by SAHA relieves bone cancer pain in rats via inhibiting activation of glial cells in spinal dorsal horn and dorsal root ganglia

Xiao-Tao He et al. J Neuroinflammation. .

Abstract

Background: Robust activation of glial cells has been reported to occur particularly during the pathogenesis of bone cancer pain (BCP). Researchers from our group and others have shown that histone deacetylases (HDACs) play a significant role in modulating glia-mediated immune responses; however, it still remains unclear whether HDACs are involved in the activation of glial cells during the development of BCP.

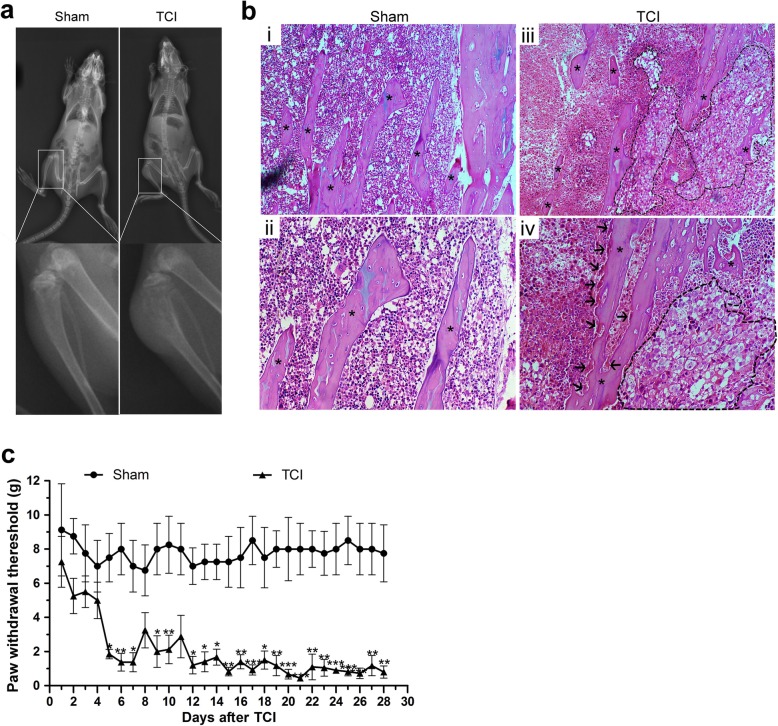
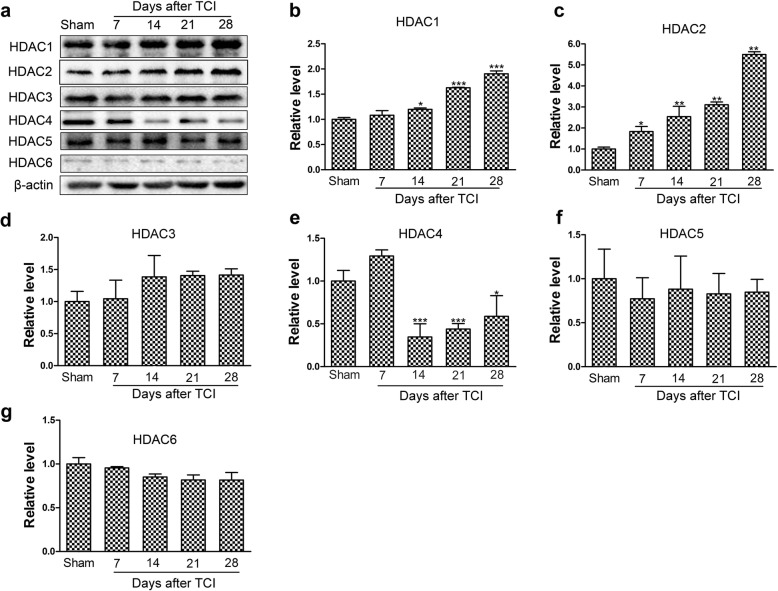
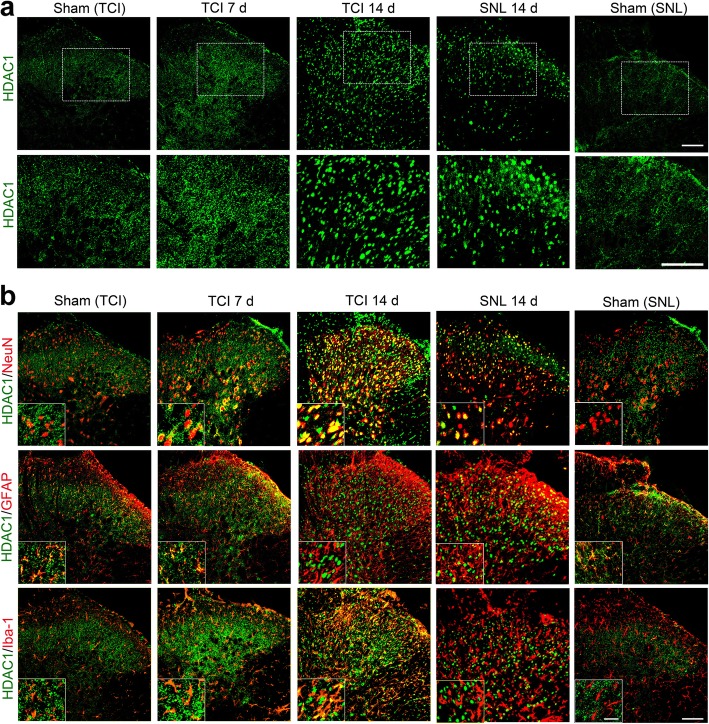
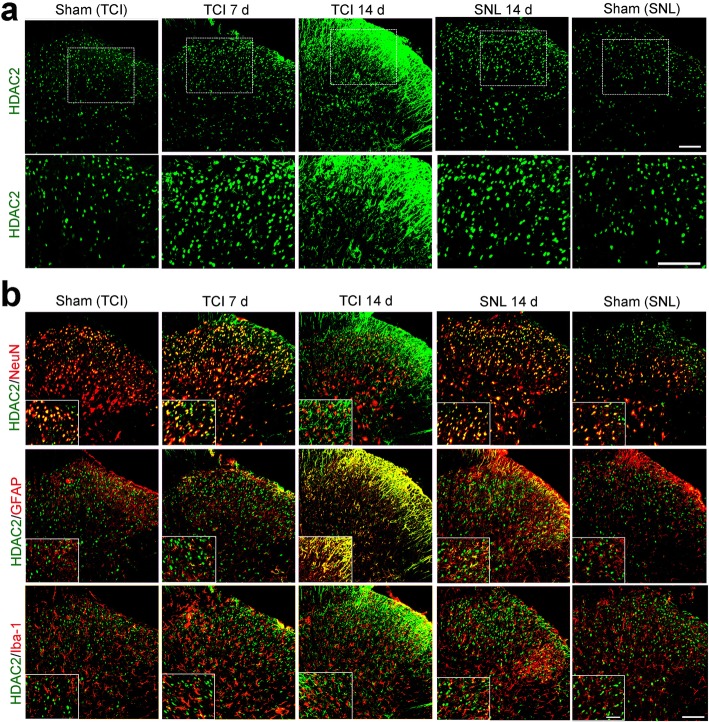
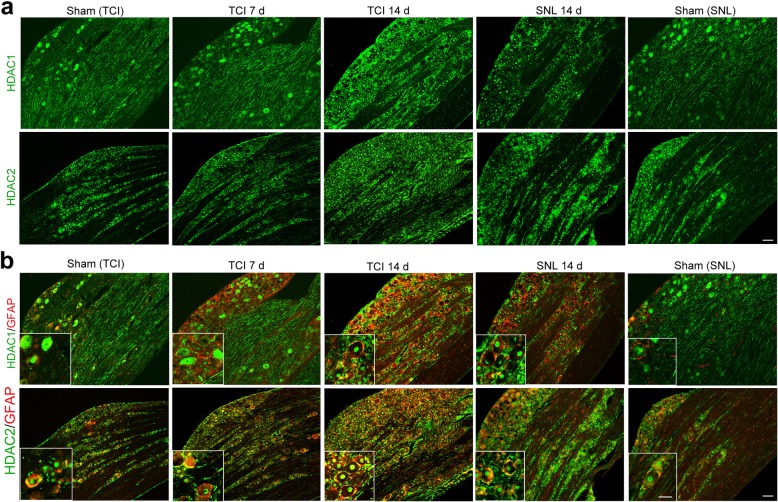
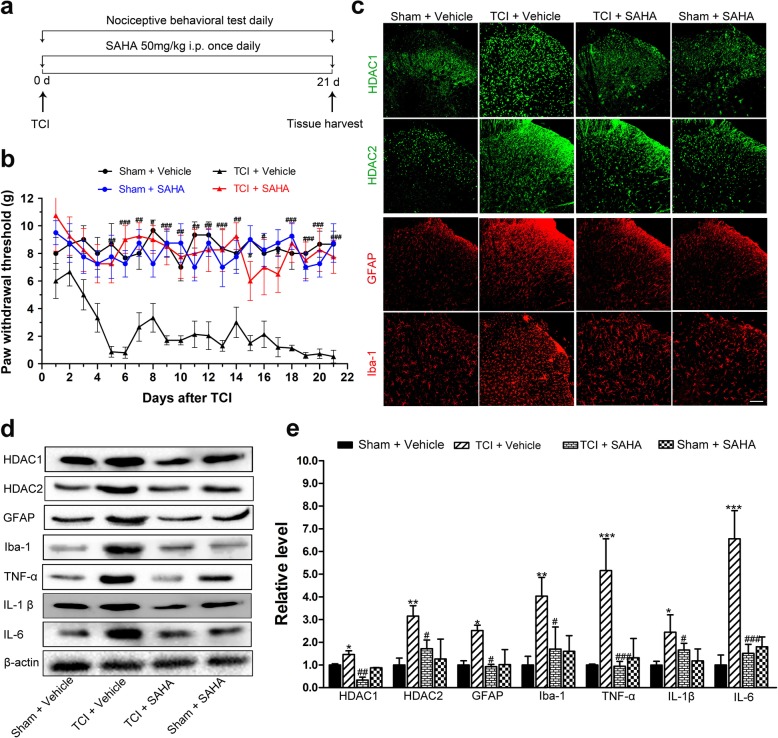
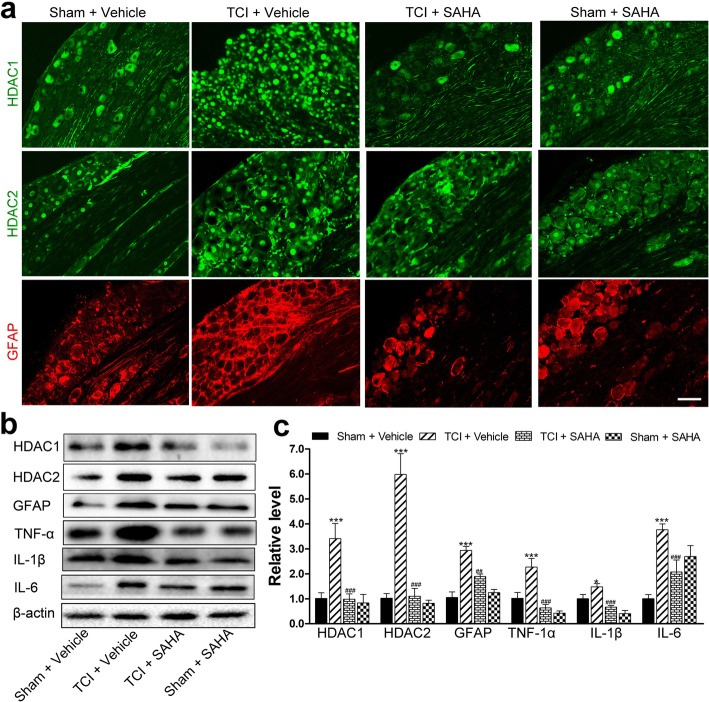
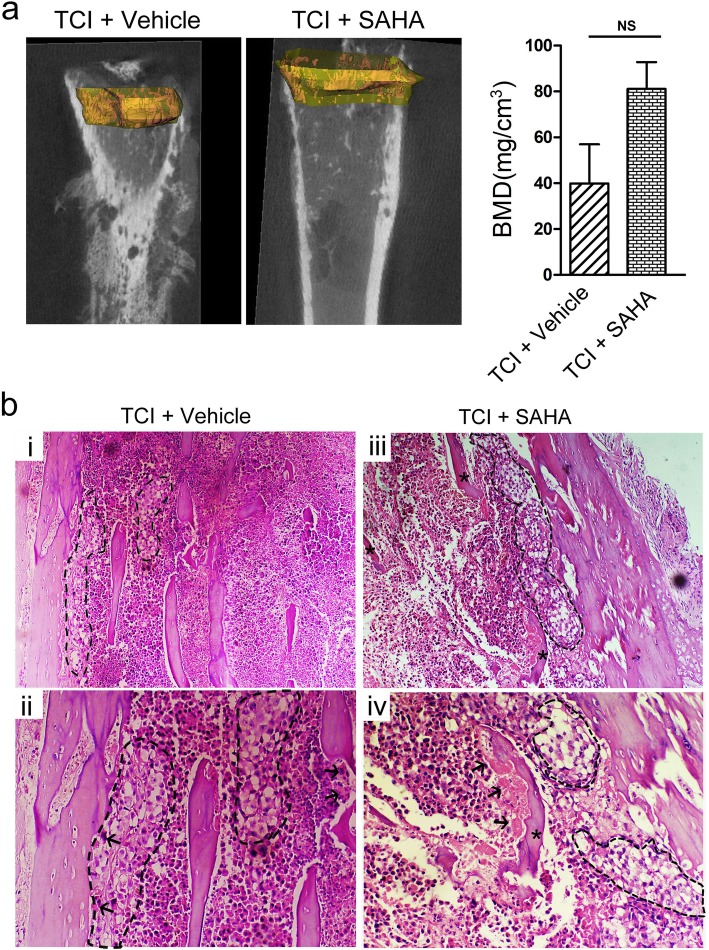
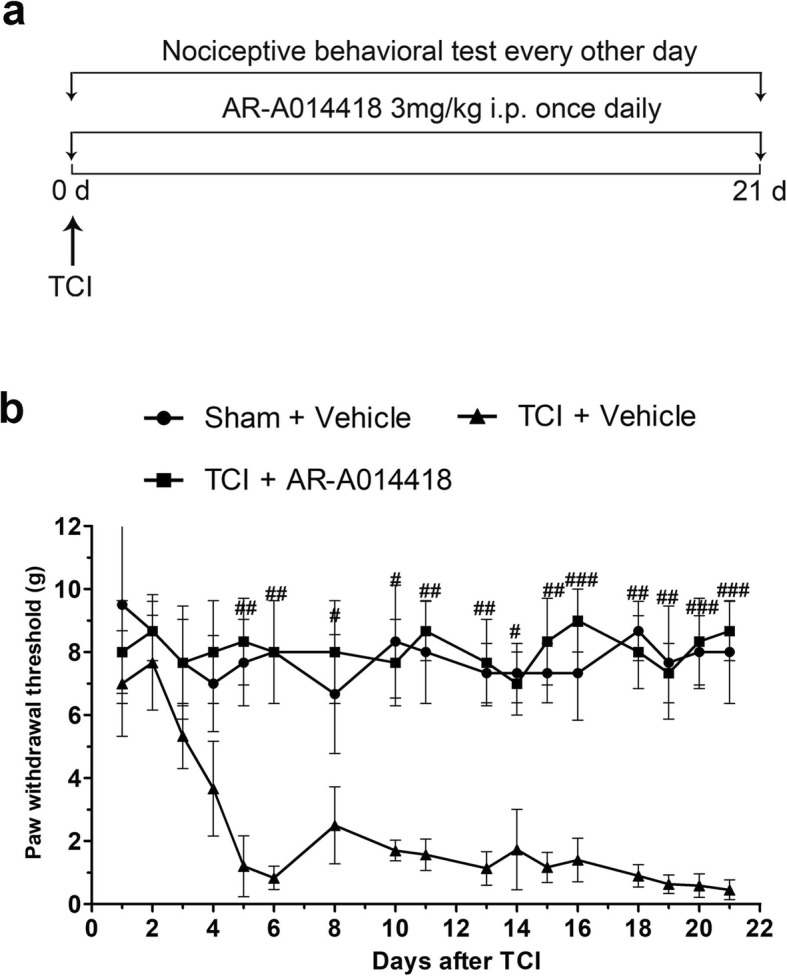
Methods: BCP model was established by intra-tibia tumor cell inoculation (TCI). The expression levels and distribution sites of histone deacetylases (HDACs) in the spinal dorsal horn and dorsal root ganglia were evaluated by Western blot and immunofluorescent staining, respectively. Suberoylanilide hydroxamic acid (SAHA), a clinically used HDAC inhibitor, was then intraperitoneally and intrathecally injected to rescue the increased expression levels of HDAC1 and HDAC2. The analgesic effects of SAHA administration on BCP were then evaluated by measuring the paw withdrawal thresholds (PWTs). The effects of SAHA on activation of glial cells and expression of proinflammatory cytokines (TNF-α, IL-1β, and IL-6) in the spinal dorsal horn and dorsal root ganglia of TCI rats were further evaluated by immunofluorescent staining and Western blot analysis. Subsequently, the effects of SAHA administration on tumor growth and cancer cell-induced bone destruction were analyzed by hematoxylin and eosin (HE) staining and micro-CT scanning.

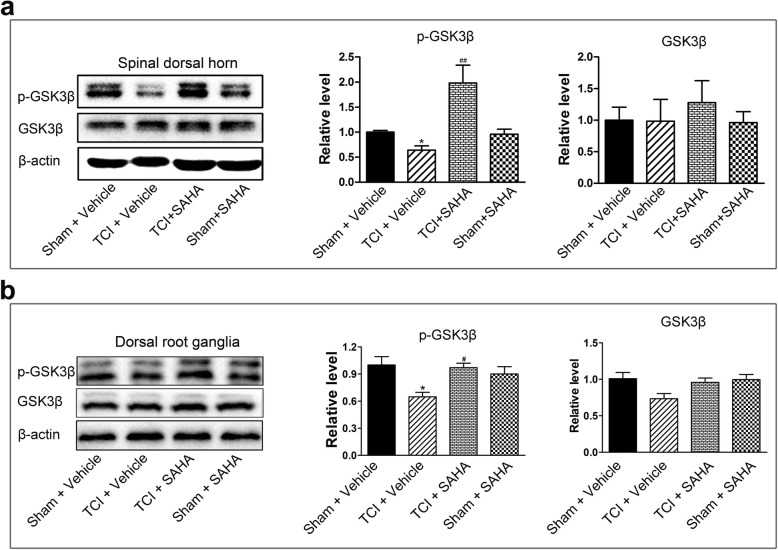
Results: TCI caused rapid and long-lasting increased expression of HDAC1/HDAC2 in glial cells of the spinal dorsal horn and dorsal root ganglia. Inhibiting HDACs by SAHA not only reversed TCI-induced upregulation of HDACs but also inhibited the activation of glial cells in the spinal dorsal horn and dorsal root ganglia, and relieved TCI-induced mechanical allodynia. Further, we found that SAHA administration could not prevent cancer infiltration or bone destruction in the tibia, which indicated that the analgesic effects of SAHA were not due to its anti-tumor effects. Moreover, we found that SAHA administration could inhibit GSK3β activity in the spinal dorsal horn and dorsal root ganglia, which might contributed to the relief of BCP.

Conclusion: Our findings suggest that HDAC1 and HDAC2 are involved in the glia-mediated neuroinflammation in the spinal dorsal horn and dorsal root ganglia underlying the pathogenesis of BCP, which indicated that inhibiting HDACs by SAHA might be a potential strategy for pain relief of BCP.

Keywords: Bone cancer pain; Glial cells; HDACs; Neuroinflammation; Spinal dorsal horn.


Conflict of interest statement

The authors declare that they have no competing interests.

Figures

Fig. 1
Fig. 1
TCI-induced bone destruction and mechanical allodynia. a Radiographs of the tibia bone in the Sham and TCI rats on POD 21. b HE staining of the trabecular bone in the Sham and the TCI group on POD 21. b (i, ii) Representative images of HE staining showed regular arrangement of trabecular bone (asterisks) in tibial marrow cavity of the Sham group. b (iii, iv) Representative images of HE staining showed cancer cells (within the dotted lines) and osteoclastic resorption pits (arrows) on trabecular surface in tibial marrow cavity of the TCI group on POD 21. Original magnification: 100 (top row), 200 (bottom row). c TCI-induced prominent mechanical allodynia from POD 5 to POD 28 (n = 8). Data are expressed as the mean ± SEM. *p < 0.05, **p < 0.01, ***p < 0.001 versus the Sham group
Fig. 2
Fig. 2
TCI-induced time-dependent changes of HDAC1~HDAC6 expression in the spinal dorsal horn at various time points (Sham, POD 7, POD 14, POD 21 and POD 28). Representative bands (a) and quantitative analysis of HDAC1~HDAC6 (bg) in the spinal dorsal horn at various time points following TCI (n = 4). Analysis was based on the mean gray values and normalized to β-actin. Data are expressed as the mean ± SEM. *p < 0.05, **p < 0.01, ***p < 0.001 versus the Sham group
Fig. 3
Fig. 3
TCI-induced upregulation of HDAC1 in the spinal dorsal horn following TCI or SNL. a Immunofluorescent staining of HDAC1 in the spinal dorsal horn at various time points (Sham, POD 7 and POD 14 for TCI; Sham and POD 14 for SNL). Scale bar = 100 μm. b Double immunofluorescent staining showing the co-localization of HDAC1 (green) with neurons (NeuN, red), astrocytes (GFAP, red), and microglia (Iba-1, red) at various time points (Sham, POD 7 and POD 14 for TCI; Sham and POD 14 for SNL). Scale bar = 100 μm (outside); 50 μm (inside)
Fig. 4
Fig. 4
TCI-induced upregulation of HDAC2 in the spinal dorsal horn following TCI or SNL. a Immunofluorescent staining of HDAC2 in the spinal dorsal horn at various time points (Sham, POD 7 and POD 14 for TCI; Sham and POD 14 for SNL). Scale bar = 100 μm. b Double immunofluorescent staining showing the co-localization of HDAC2 (green) with neurons (NeuN, red), astrocytes (GFAP, red), and microglia (Iba-1, red) at various time points (Sham, POD 7 and POD 14 for TCI; Sham and POD 14 for SNL). Scale bar = 100 μm (outside); 50 μm (inside)
Fig. 5
Fig. 5
TCI-induced upregulation of HDAC1 and HDAC2 in the dorsal root ganglia following TCI or SNL. a Immunofluorescent staining of HDAC1 and HDAC2 in the dorsal root ganglia at various time points (Sham, POD 7 and POD 14 for TCI; Sham and POD 14 for SNL). Scale bar = 100 μm. b Double immunofluorescent staining showing the co-localization of HDAC1/HDAC2 (green) and satellite glial cells (GFAP, red) at various time points (Sham, POD 7, and POD 14 for TCI; Sham and POD 14 for SNL). Scale bar = 100 μm (outside); 50 μm (inside)
Fig. 6
Fig. 6
The effects of SAHA on TCI-induced mechanical allodynia and neuroinflammation in the spinal dorsal horn. a Experimental paradigms. b The effect of i.p. administration of SAHA on mechanical allodynia of TCI rats (n = 8). c Immunofluorescent staining of HDAC1 (green), HDAC2 (green), GFAP (red), and Iba-1 (red) in the spinal dorsal horn of the Sham + vehicle, the TCI + vehicle, the TCI + SAHA, and the Sham + SAHA group on POD 21. Scale bar = 100 μm. Representative bands (d) and quantitative analysis of HDAC1, HDAC2, GFAP, Iba-1, TNF-α, IL-1β, and IL-6 (e) in the spinal dorsal horn of Sham + vehicle, the TCI + vehicle, the TCI + SAHA, and the Sham + SAHA group. (n = 4). Analysis was based on the mean gray values and normalized to β-actin. Data are expressed as mean ± SEM. *p < 0.05, **p < 0.01 ***p < 0.001 versus the Sham + vehicle group, and #p < 0.05, ##p < 0.01, ###p < 0.001 versus the TCI + vehicle group
Fig. 7
Fig. 7
The effects of SAHA on TCI-induced neuroinflammation in the dorsal root ganglia. a Immunofluorescent staining of HDAC1 (green), HDAC2 (green), and GFAP (red) in the dorsal root ganglia of the Sham + vehicle, the TCI + vehicle, the TCI + SAHA, and the Sham + SAHA group on POD 21. Scale bar = 100 μm. Representative bands (b) and quantitative analysis of HDAC1, HDAC2, GFAP, TNF-α, IL-1β and IL-6 (c) in the dorsal root ganglia of Sham + vehicle, the TCI + vehicle, the TCI + SAHA and the Sham + SAHA group (n = 4). Analysis was based on the mean gray values and normalized to β-actin. Data are expressed as mean ± SEM. *p < 0.05 and ***p < 0.001 versus the Sham + vehicle group, and  ##p < 0.01, ###p < 0.001 versus the TCI + vehicle group
Fig. 8
Fig. 8
The effect of SAHA administration on bone destruction following TCI. a 2D representative MicroCT images of trabecular bone microarchitecture. b Quantitative analysis of the BMD in tibia of the TCI + vehicle and the TCI + SAHA group (n = 4). Data are expressed as the mean ± SEM. Representative images of HE staining showing cancer cell infiltration (cells within the dotted lines) and bone resorption pits (arrows) on trabecular surface in tibial marrow cavity of the TCI + vehicle (b (i, ii)) and TCI + SAHA (b (ii, iii)) group. Original magnification: 100 (upper row), 200 (bottom row)
Fig. 9
Fig. 9
The inhibitory effects of SAHA on GSK3β activities in the spinal dorsal horn and dorsal root ganglia on POD 21. a Representative bands and quantitative analysis of p-GSK3β and GSK3β in the spinal dorsal horn of the Sham + vehicle, the TCI + vehicle, the TCI + SAHA and the Sham + SAHA group (n = 4). Analysis was based on the mean gray values and normalized to β-actin. b Representative bands and quantitative analysis of p-GSK3β and GSK3β in the dorsal root ganglia of the Sham + vehicle, the TCI + vehicle, the TCI + SAHA and the Sham + SAHA group (n = 4). Analysis was based on the mean gray values and normalized to β-actin. Data are expressed as the mean ± SEM. *p < 0.05 versus the Sham + vehicle group and #p < 0.05, ##p < 0.01 versus the TCI + vehicle group
Fig. 10
Fig. 10
The anelgesic effects of AR-A014418 on TCI-induced mechanical allodynia. a Experimental paradigms. b The effect of i.p. administration of AR-A014418 on mechanical allodynia of TCI rats (n = 8). Data are expressed as mean ± SEM. #p < 0.05, ##p < 0.01, ###p < 0.001 versus the TCI + vehicle group

References

    1. Bray F, Jemal A, Grey N, Ferlay J, Forman D. Global cancer transitions according to the human development index (2008-2030): a population-based study. Lancet Oncol. 2012;13(8):790–801. doi: 10.1016/S1470-2045(12)70211-5. - DOI - PubMed
    1. Grond S, Zech D, Diefenbach C, Radbruch L, Lehmann KA. Assessment of cancer pain: a prospective evaluation in 2266 cancer patients referred to a pain service. Pain. 1996;64(1):107–114. doi: 10.1016/0304-3959(95)00076-3. - DOI - PubMed
    1. King T, Vardanyan A, Majuta L, Melemedjian O, Nagle R, et al. Morphine treatment accelerates sarcoma-induced bone pain, bone loss, and spontaneous fracture in a murine model of bone cancer. Pain. 2007;132(1–2):154–168. doi: 10.1016/j.pain.2007.06.026. - DOI - PMC - PubMed
    1. Xu WS, Parmigiani RB, Marks PA. Histone deacetylase inhibitors: molecular mechanisms of action. Oncogene. 2007;26(37):5541–5552. doi: 10.1038/sj.onc.1210620. - DOI - PubMed
    1. Gui CY, Ngo L, Xu WS, Richon VM, Marks PA. Histone deacetylase (HDAC) inhibitor activation of p21WAF1 involves changes in promoter-associated proteins, including HDAC1. Proc Natl Acad Sci U S A. 2004;101(5):1241–1246. doi: 10.1073/pnas.0307708100. - DOI - PMC - PubMed

LinkOut - more resources