. 2020 May 29;295(22):7653-7668.
doi: 10.1074/jbc.RA120.013251. Epub 2020 Apr 22.

The receptor tyrosine kinase EPHB6 regulates catecholamine exocytosis in adrenal gland chromaffin cells

Affiliations

The receptor tyrosine kinase EPHB6 regulates catecholamine exocytosis in adrenal gland chromaffin cells

Wei Shi et al. J Biol Chem. .

Abstract

The erythropoietin-producing human hepatocellular receptor EPH receptor B6 (EPHB6) is a receptor tyrosine kinase that has been shown previously to control catecholamine synthesis in the adrenal gland chromaffin cells (AGCCs) in a testosterone-dependent fashion. EPHB6 also has a role in regulating blood pressure, but several facets of this regulation remain unclear. Using amperometry recordings, we now found that catecholamine secretion by AGCCs is compromised in the absence of EPHB6. AGCCs from male knockout (KO) mice displayed reduced cortical F-actin disassembly, accompanied by decreased catecholamine secretion through exocytosis. This phenotype was not observed in AGCCs from female KO mice, suggesting that testosterone, but not estrogen, contributes to this phenotype. Of note, reverse signaling from EPHB6 to ephrin B1 (EFNB1) and a 7-amino acid-long segment in the EFNB1 intracellular tail were essential for the regulation of catecholamine secretion. Further downstream, the Ras homolog family member A (RHOA) and FYN proto-oncogene Src family tyrosine kinase (FYN)-proto-oncogene c-ABL-microtubule-associated monooxygenase calponin and LIM domain containing 1 (MICAL-1) pathways mediated the signaling from EFNB1 to the defective F-actin disassembly. We discuss the implications of EPHB6's effect on catecholamine exocytosis and secretion for blood pressure regulation.

Keywords: EPHB6; F-actin; actin; adrenal; adrenal gland chromaffin cell; catecholamine; exocytosis; receptor tyrosine kinase.


Conflict of interest statement

Conflict of interest—The authors declare that they have no conflicts of interest with the contents of this article.

Figures
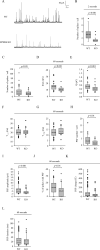
Figure 1.
Figure 1.
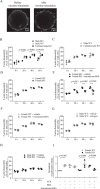
Reduced CAT release from KO AGCCs from KO and WT male mice according to amperometry recording. AGCCs were isolated from three KO and three WT male mice, and their nicotine-stimulated CAT release was registered by amperometry. Typical traces of amperometry are shown in A. Box bar graphs (B–L) show the medium (solid horizontal line in the box), mean (dashed horizontal line in the box), the 75th percentile (upper part of the box), 25th percentile (lower part of the box), 95th percentile (upper whisker), 5th percentile (lower whisker), and outliners (dots beyond the 95th and 5th percentiles) of each parameter. The Mann-Whitney Rank Sum tests were conducted for statistical analysis due to failed normality tests of the data. Significant p values are shown. The number of spikes per cell observed in the 2- (B) or 60-s (C) period after nicotine stimulation, the spike peak height (Imax) (D), the charge of the spikes (Q) (E), the half-time to reach the spike peak (T½) (F), the time to reach the peak (Tpeak)(G), the number of PSF observed per cell (H), the PSF amplitude (I), the percentage of spikes with PSF (J), the PSF charge (fC) (K), and the PSF duration (L) are illustrated. For B–G, 89 WT cells and 35 KO cells were analyzed; for H and J, 60 WT cells and 30 KO cells; I and K, 212 PSF of WT cells, and 52 PSF of KO cells. The values in B, C, and H were averaged per cell for the duration indicated. The values in the remaining panels were calculated according to all events that occurred in all the cells tested during the 60-s recording period.
Figure 2.
Figure 2.
The effect of sex hormones on cortical F-actin disassembly in AGCCs from Ephb6 KO and WT mice. AGCCs isolated from KO and WT mice were cultured for 24 h and then stimulated with nicotine (50 μm) for 0, 20, 40, or 60 s. The cells were stained with rhodamine-conjugated phalloidin for F-actin and then analyzed according to confocal microscopy. At least 60 AGCCs per adrenal gland per mouse were examined for F-actin disassembly, which was defined as the gaps in the cortical F-actin ring that exceeded more than 5% of the circumference. Three independent experiments, each using one male KO and WT mouse, were performed, and the data of the three experiments were analyzed by a paired two-way test, mean ± S.E. were presented. Significant p values (Student's t test after arcsine transformation) between the WT and KO AGCCs at a given time point are shown. A, representative micrographs of cortical F-actin rings in WT AGCCs before and after 40-s nicotine stimulation. The arrowheads indicate gaps in the cortical F-actin ring. Scale bar = 2 μm. B, male KO AGCCs presented reduced cortical F-actin disassembly, and castration abrogated this phenotype. C, castration did not affect cortical F-actin disassembly in male WT AGCCs. D, AGCCs of female KO and WT mice were similar in cortical F-actin disassembly. E and F, testosterone rapidly lowered cortical F-actin disassembly in female KO (E) but not female WT (F) AGCCs. AGCCs were treated with cell membrane-impermeable BSA-conjugated testosterone (1.1 μg/ml) or vehicle for 15 min at 37 °C before nicotine stimulation. G and H, estrogen did not affect cortical F-actin disassembly in AGCCs from male WT (G) or KO (H) mice. AGCCs were treated with 17β-estradiol (100 pg/ml) or vehicle for 15 min at 37 °C before nicotine stimulation. I, short-term testosterone treatment lowered NE released from female KO but not from WT AGCCs. Cells obtained for female KO and WT AGCCs (10,000 cells per well) were cultured for 16 h and then treated with BSA-conjugated testosterone (1.1 μg/ml) or BSA in Hank's buffer at 37 °C for 15 min, and stimulated with 5 mm ACh for 1 min at room temperature. NE in the supernatants was measured and normalized to baseline NE secretion by female WT AGCCs without testosterone pretreatment or ACh stimulation. Normalized fold-changes (mean ± S.D.) of NE secretion of samples with different treatments are shown. Three independent experiments were conducted. Significant p values (2-way paired Student's t test) are indicated. Additional statistical analysis for the changes between different points in time is presented in Table S1.
Figure 3.
Figure 3.
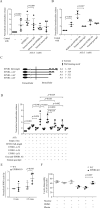
EPHB6 to EFNB1 reverse signaling modulated NE secretion by AGCCs. tsAM5NE chromaffin cells were cultured in wells coated with anti-EPHB6 Ab, recombinant EPHB6-Fc, anti-EFNB1 Ab, anti-EFNB2 Ab, or their isotype control IgGs for 24 h, as indicated. The culture medium was replaced with Hank's buffer, and after 15 min, cells were stimulated with 5 mm ACh. One min later, supernatants were harvested for NE measurements. The baseline NE secretion by tsAM5NE cells cultured in uncoated wells without ACh stimulation was considered as 1-fold. The normalized fold-changes (mean ± S.D.) of the NE secretion of cells with different treatments are shown. Three to five independent experiments were conducted. Significant p values (2-way paired Student's t test) are indicated. A, the ACh-stimulated NE release by tsAM5NE cells was promoted by solid-phase EPHB6-Fc but not by anti-EPHB6 Ab. Data from 5 independent experiments were normalized and presented. B, solid-phase anti-EFNB1 Ab but not anti-EFNB2 Ab augmented ACh-stimulated NE release. The results from 3 independent experiments were normalized and presented. C, the structures of EFNB1 protein and its deletion mutants. D, identification of the critical intracellular sequence of EFNB1 in mediating reverse signaling. tsAM5NE cells were infected with lentiviruses encoding full-length and deletion mutants of EFNB1, as indicated. The infected cells were seeded in wells coated with anti-EFNB1 Ab or normal goat IgG for 24 h and then stimulated with ACh for 1 min. The ACh-stimulated NE release was measured. Data from 4 independent experiments were normalized and presented. E, the activity of RHOA after nicotine stimulation was elevated in adrenal medullae from male KO mice. Adrenal medullae were stimulated with nicotine (20 μm) for 0 and 2.5 min. The activated RHOA level in the adrenal medullae was measured by G-LISA. The RHOA activity of WT medulla at 0 min was considered as one-fold for normalization. The results of four independent experiments were normalized, and the fold-changes (mean ± S.D.) of different samples are presented. F, RHOA inhibitor reverted the low cortical F-actin disassembly in male KO AGCCs to a normal level. AGCCs isolated from male KO or WT mice were cultured for 1 day and then treated with Rhosin (30 μm) or DMSO in Opti-MEMTM Reduced Serum Media for 4 h at 37 °C. Cells were stimulated 40 s with nicotine (50 μm), and their cortical F-actin disassembly was assessed by confocal microscopy. The percentages (mean ± S.D.) of cells with F-actin disassembly from three independent experiments are presented. Significant p value (two-way paired Student's t test after arcsine transformation) is indicated.
Figure 4.
Figure 4.
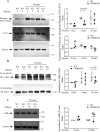
Decreased FYN and c-ABL phosphorylation in male KO adrenal medullae upon nicotine stimulation. Adrenal medullae from male WT and KO mice were stimulated with nicotine (20 μm) for 0 or 10 min at 37 °C. The phosphorylated FYN, total FYN phosphorylated c-ABL, total ABL, and β-actin levels of the medullae lysates were determined by immunoblotting. A, decreased FYN phosphorylation in medullae obtained from EPHB6 mice. Representative immunoblots of phosphorylated FYN (Y420) (upper panel), total FYN (middle panel), and β-actin (bottom panel) were shown. The densitometry signal ratios of phosphor-FYN versus FYN, and the ratio of total FYN versus β-actin of WT medullae at 0 min was used to normalize the data from 3 independent experiments. The normalized fold-changes (mean ± S.D.) were presented. The significant p values are indicated (2-way paired Student's t test). B and C, decreased c-ABL phosphorylation in the KO medullae. Lysate proteins from WT and KO medullae after 0- or 10-min nicotine stimulation were immunoprecipitated with anti-phosphoprotein Ab. The precipitated proteins were immunoblotted with anti-c-ABL or anti-ELK1 Ab. Representative immunoblots on the left show c-ABL and ELK phosphorylation (B) and total c-ABL and β-actin (C). The densitometry signal ratios of phospho-c-ABL versus phospho-ELK, and total c-ABL versus β-actin of WT medullae at 0 min were used to normalize the data from four independent experiments. The normalized fold-changes (mean ± S.D.) were presented on the right. The significant p values are indicated (2-way paired Student's t test).
Figure 5.
Figure 5.
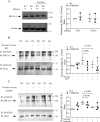
Reduced MICAL-1 phosphorylation in male KO adrenal medullae upon nicotine stimulation. Adrenal medullae from male WT and KO mice were cultured in the absence or presence of FYN inhibitor PP2 (10 μm) or c-ABL inhibitor Imatinib (20 μm), as indicated, at 37 °C for 2 h, and then stimulated with nicotine (20 μm) for 10 min. Their lysates were immunoprecipitated with anti-phosphoprotein Ab 4G10 and blotted with anti-MICAL-1 and ELK1 Abs. The densitometry signal ratios of total MICAL-1 versus β-actin and phospho-MICAL-1 versus phospho-ELK in WT male medullae without nicotine stimulation were used to normalize the data from four independent experiments. Representative immunoblots are shown on the left, and normalized fold-changes (mean ± S.D.) according to densitometry are shown on the right. The significant p values are indicated (2-way paired Student's t test). A, unchanged total MICAL-1 levels in male KO medullae. B, compromised MICAL-1 phosphorylation in KO medullae after nicotine stimulation, or in WT medullae treated with FYN inhibitor. C, decreased MICAL-1 phosphorylation in WT medullae treated with c-ABL inhibitor. The same membranes were sequentially blotted with anti-c-ABL (Fig. 4C), MICAL-1 and β-actin Abs, with a stripping process between these different immunoblottings. The same β-actin immunoblotting was used as loading controls for both Fig. 4C and panel A.
Figure 6.
Figure 6.
FYN and c-ABL inhibitor repressed cortical F-actin disassembly in male WT but not KO AGCCs. AGCCs isolated from male KO or WT mice were cultured for 24 h, and then cultured in the presence of PP2 (10 μm) (A) for 1 h or imatinib (20 μm) (B) for 2 h at 37 °C. The cells were stimulated with nicotine (50 μm) for 40 s, and their cortical F-actin disassembly was determined according to confocal microscopy. The percentages (mean ± S.D.) of cells with F-actin disassembly from three independent experiments are presented. The significant p values are indicated (2-way paired Student's t test).
Figure 7.
Figure 7.
A diagram depicting signaling pathways from EPHB6 to CAT exocytosis in AGCCs. Solid lines represent pathways verified in this study or already established in the literature, whereas faint dotted lines depict speculated pathways. Circles with black fillings are CAT-containing vesicles. ACh activation of Ach receptor/gated ion channels triggers Na+ and Ca2+ influx (74), subsequently amplified by voltage-gated calcium channels (VGCC). The depolarization and the increased Ca2+ concentration causes the opening of the BK, which repolarizes the cells and shuts down VGCC (75, 76). The nongenomic effect of testosterone positively regulates BK opening, whereas EPHB6 to EFNB1 reverse signaling negatively impacts on such an effect of testosterone (24, 77). Increased Ca2+ levels activate CaMKII (78), leading to activation of many downstream signaling events that enhance both CAT biogenesis (79) and exocytosis (this study). The FYN/c-ABL/MICAL-1 pathway that promotes F-actin depolymerization is downstream of and positively regulated by CaMKII (33–35, 80). The RHOA/ROCK/Ezrin pathway, which promotes F-actin stabilization, is also positively regulated by CaMKII (46, 47). Although the two pathways have opposite effects on F-actin disassembly after the Ca2+ influx, under normal circumstances, the balance is in favor of F-actin disassembly. The EPHB6 to EFNB1 reverse signaling by itself has no effect on CAT exocytosis. The effect of the defective reverse signaling on all the downstream events could be due to the initial compromised Ca2+ influx. It is also possible that such reverse signaling might modify signaling events directly. The reverse signaling might have a default direct positive effect on the FYN/c-ABL/MICAL-1/F-actin pathway. It might also have a direct default negative effect on RHOA activation, which promotes F-actin stabilization typically. ROCK/Ezrin (49) and ROCK/LIMK/Cofilin (50) pathways are known to be downstream of RHOA, although the latter is not activated in ACh-stimulated AGCCs (data not shown). F-actin depolymerization is not only essential in moving the slow-release CAT-containing vesicles to the docking position (51) but is also critical for optimal vesicular fusion and sewage of CAT content from the vesicles in the IRV pool during rapid exocytosis. In the absence of EPHB6/EFNB1 reverse signaling, as is the case in EPHB6 KO, the signaling strength of the FYN/c-ABL/MICAL pathway is compromised, whereas the signaling strength of RHOA/ROCK/Ezrin is relatively increased. These changes eventually lead to reduced F-actin disassembly and CAT exocytosis in the male KO AGCCs.

Similar articles

Cited by

References

    1. Eph Nomenclature Committee. (1997) Unified nomenclature for Eph family receptors and their ligands, the ephrins. Cell 90, 403–404 10.1016/S0092-8674(00)80500-0 - DOI - PubMed
    1. Pasquale E. B. (2008) Eph-ephrin bidirectional signaling in physiology and disease. Cell 133, 38–52 10.1016/j.cell.2008.03.011 - DOI - PubMed
    1. Flanagan J. G., and Vanderhaeghen P. (1998) The ephrins and Eph receptors in neural development. Annu. Rev. Neurosci. 21, 309–345 10.1146/annurev.neuro.21.1.309 - DOI - PubMed
    1. Holmberg J., Genander M., Halford M. M., Anneren C., Sondell M., Chumley M. J., Silvany R. E., Henkemeyer M., and Frisén J. (2006) EphB receptors coordinate migration and proliferation in the intestinal stem cell niche. Cell 125, 1151–1163 10.1016/j.cell.2006.04.030 - DOI - PubMed
    1. Zhao C., Irie N., Takada Y., Shimoda K., Miyamoto T., Nishiwaki T., Suda T., and Matsuo K. (2006) Bidirectional ephrinB2-EphB4 signaling controls bone homeostasis. Cell Metab. 4, 111–121 10.1016/j.cmet.2006.05.012 - DOI - PubMed

Publication types

MeSH terms

Grants and funding