. 2020 Aug;18(8):1189-1201.
doi: 10.1158/1541-7786.MCR-19-1144. Epub 2020 Apr 22.

Cyclophilin A Inhibitor Debio-025 Targets Crk, Reduces Metastasis, and Induces Tumor Immunogenicity in Breast Cancer

Affiliations

Cyclophilin A Inhibitor Debio-025 Targets Crk, Reduces Metastasis, and Induces Tumor Immunogenicity in Breast Cancer

Viralkumar Davra et al. Mol Cancer Res. 2020 Aug.

Abstract

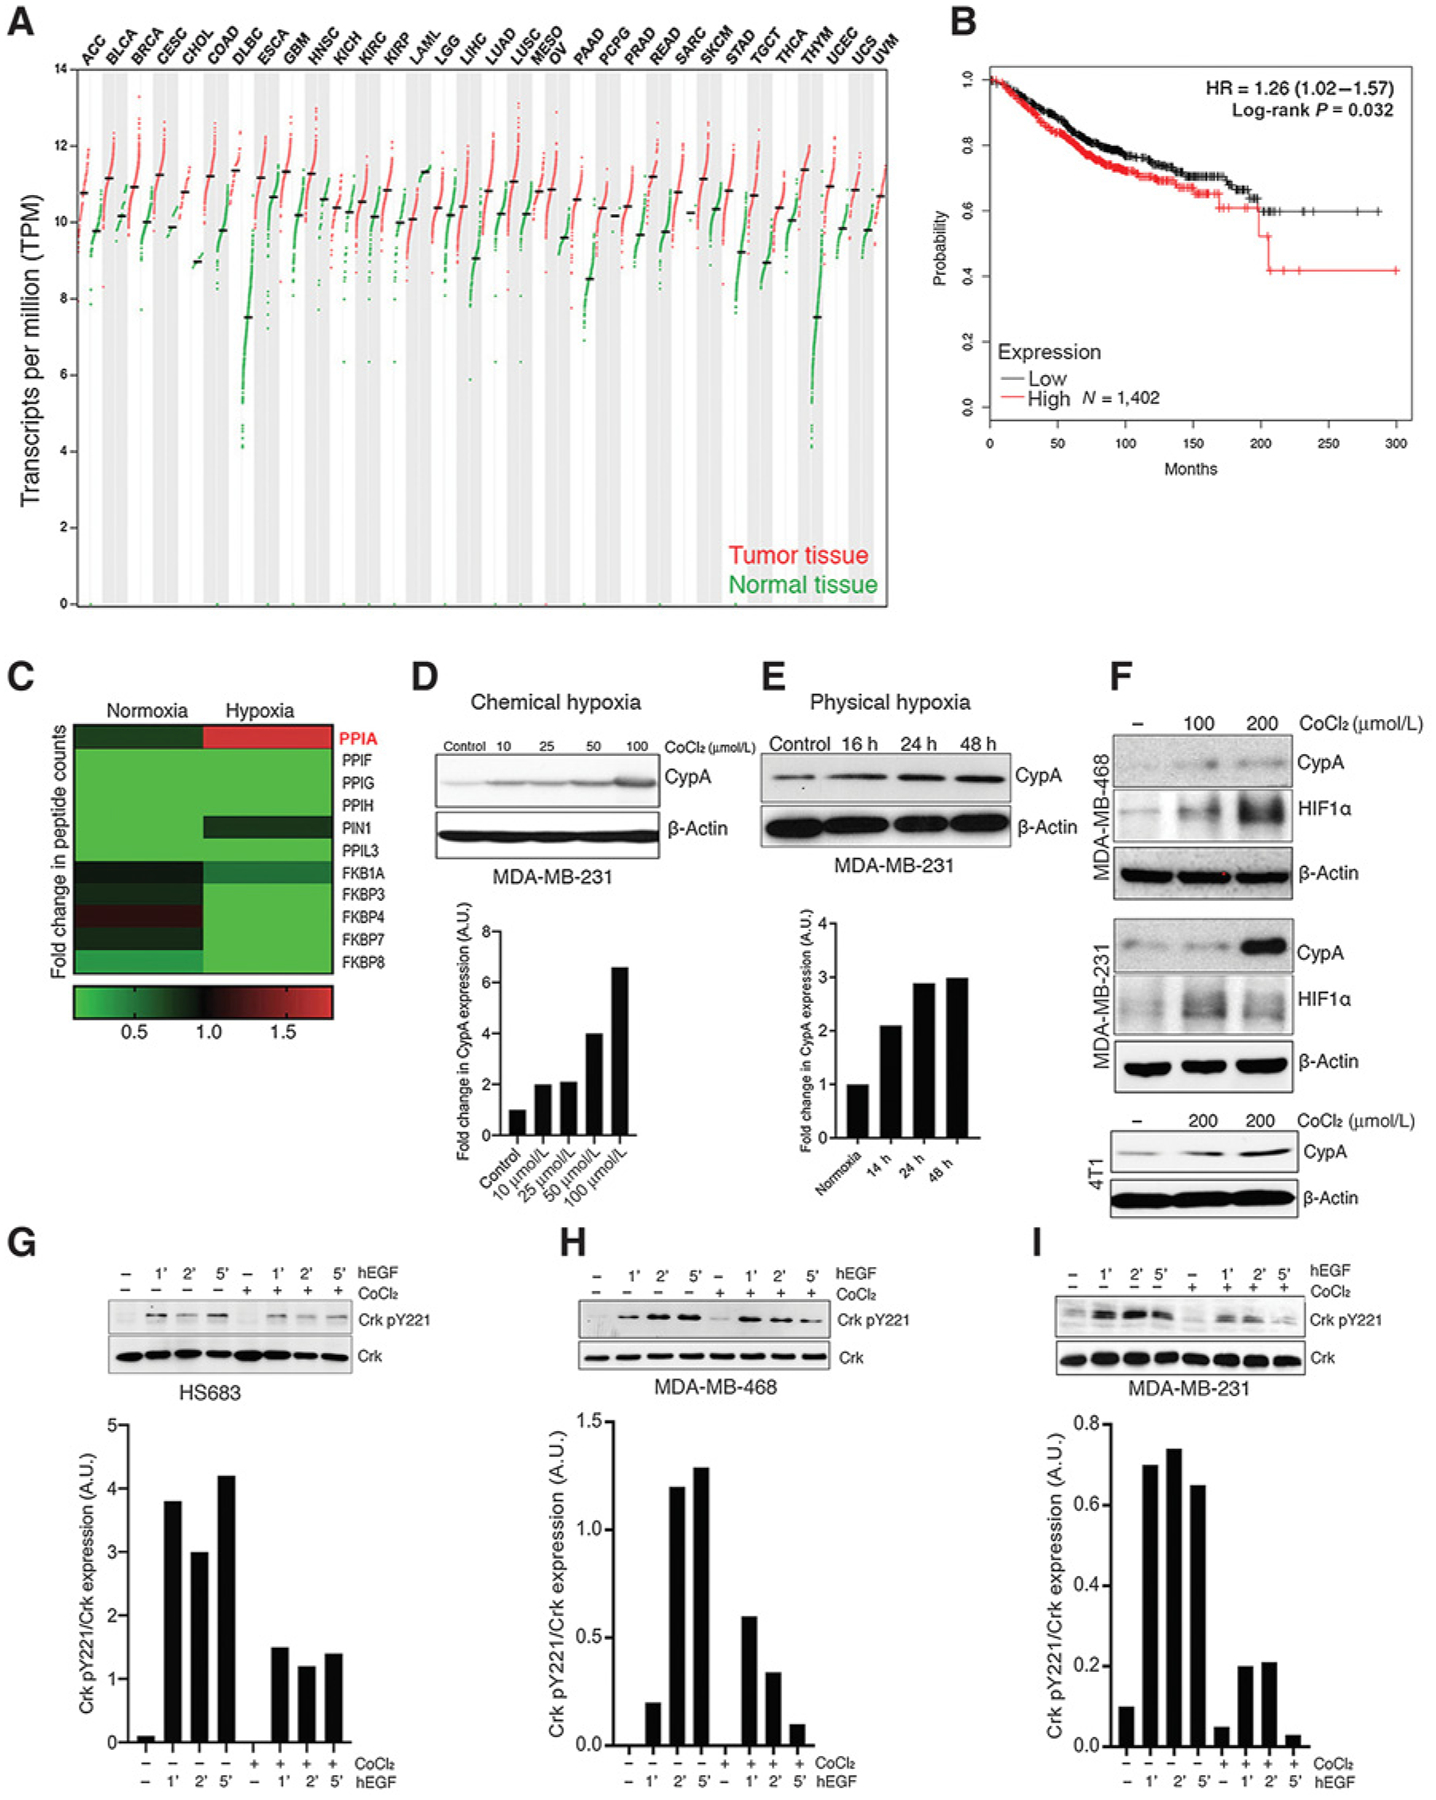
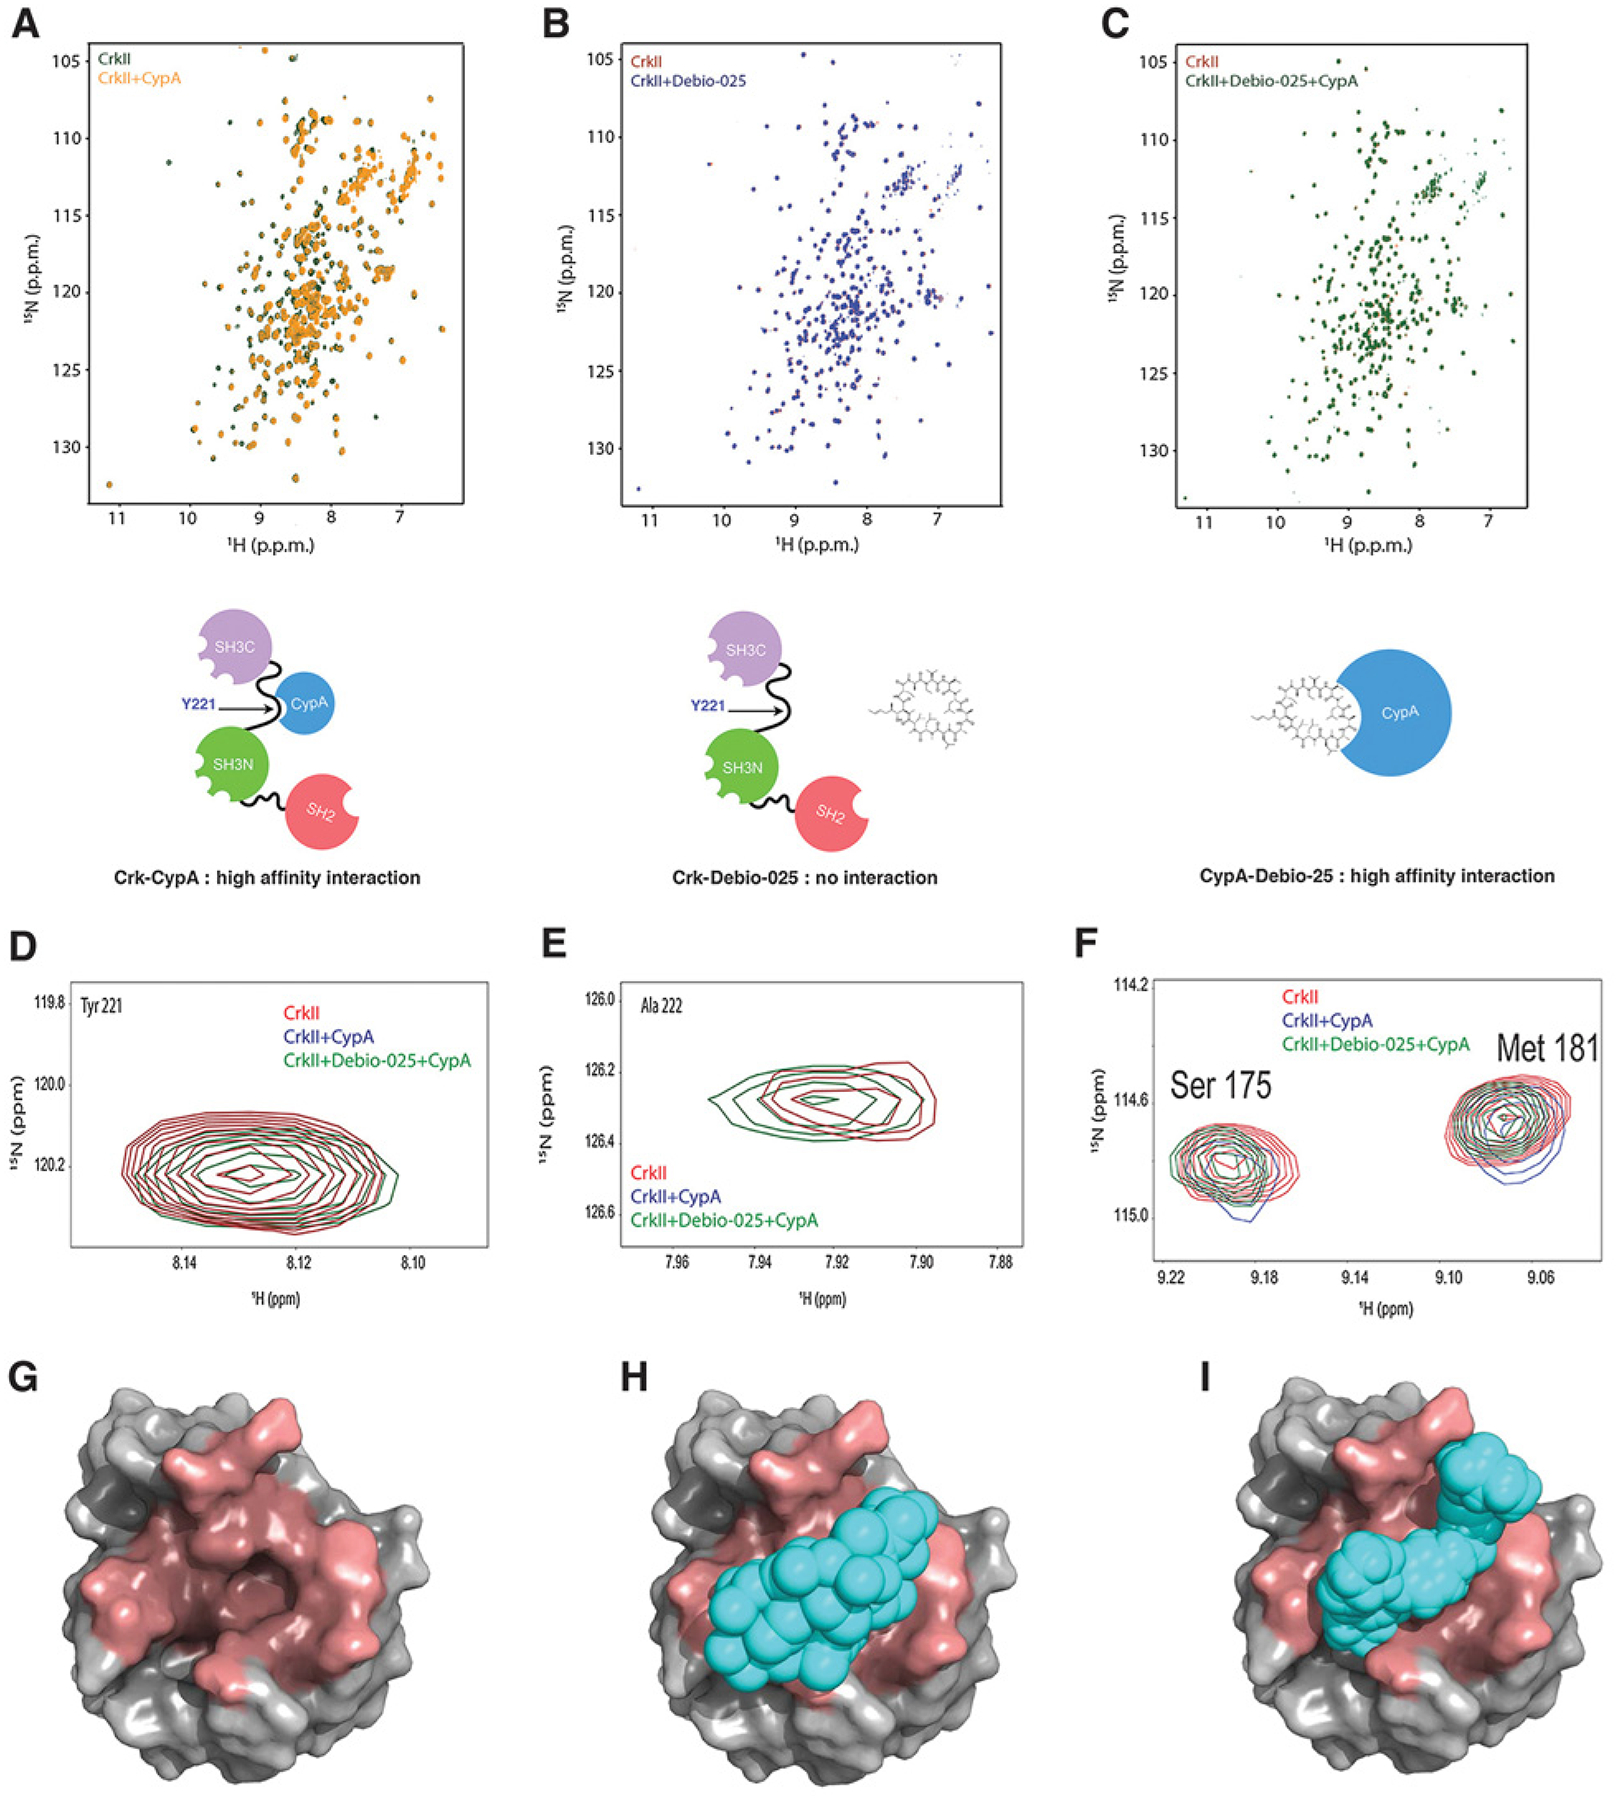
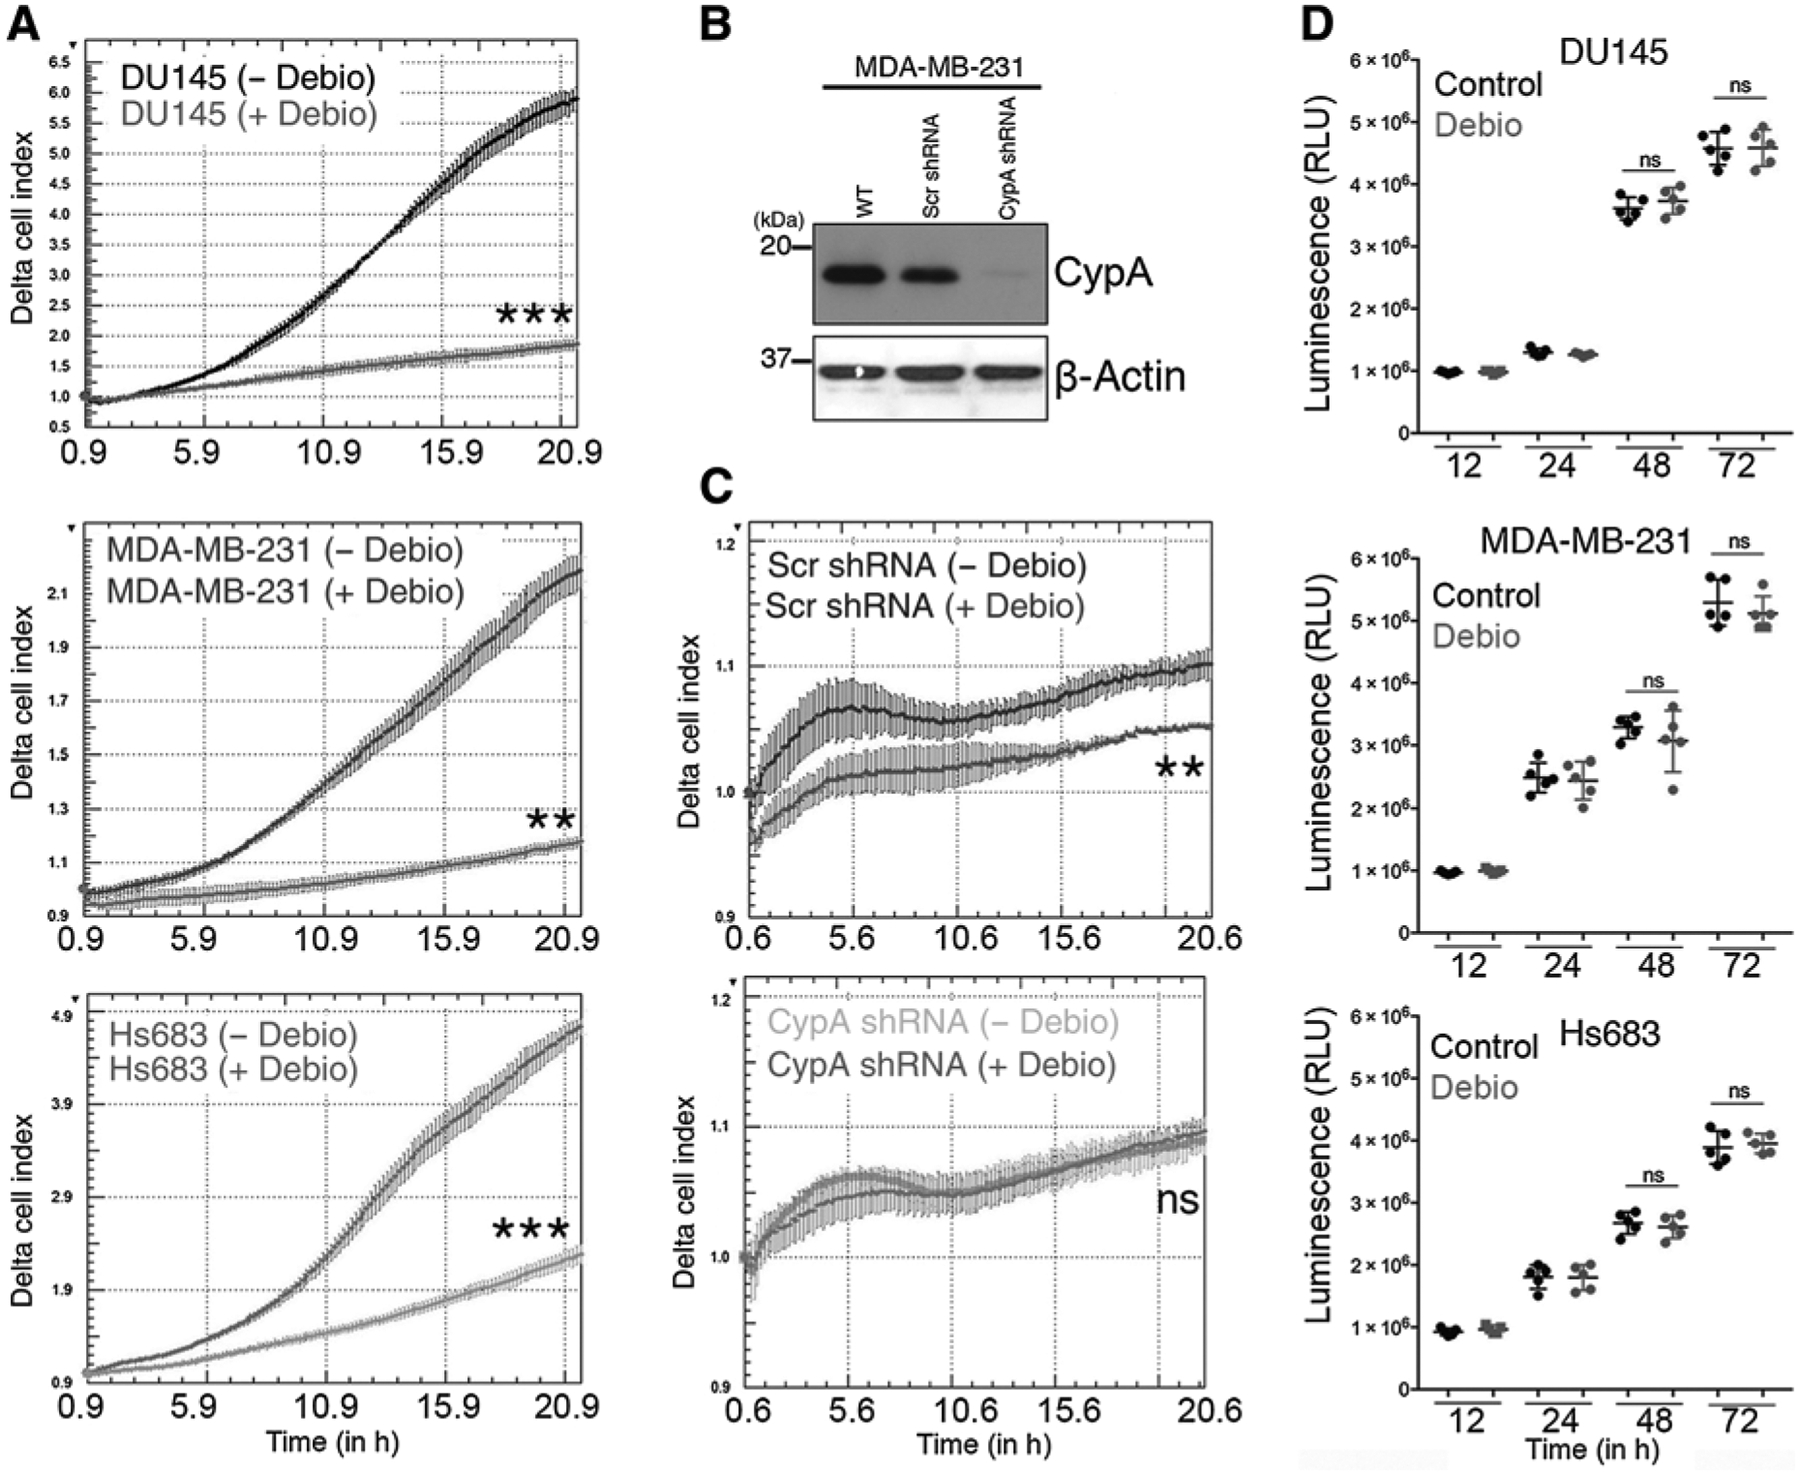
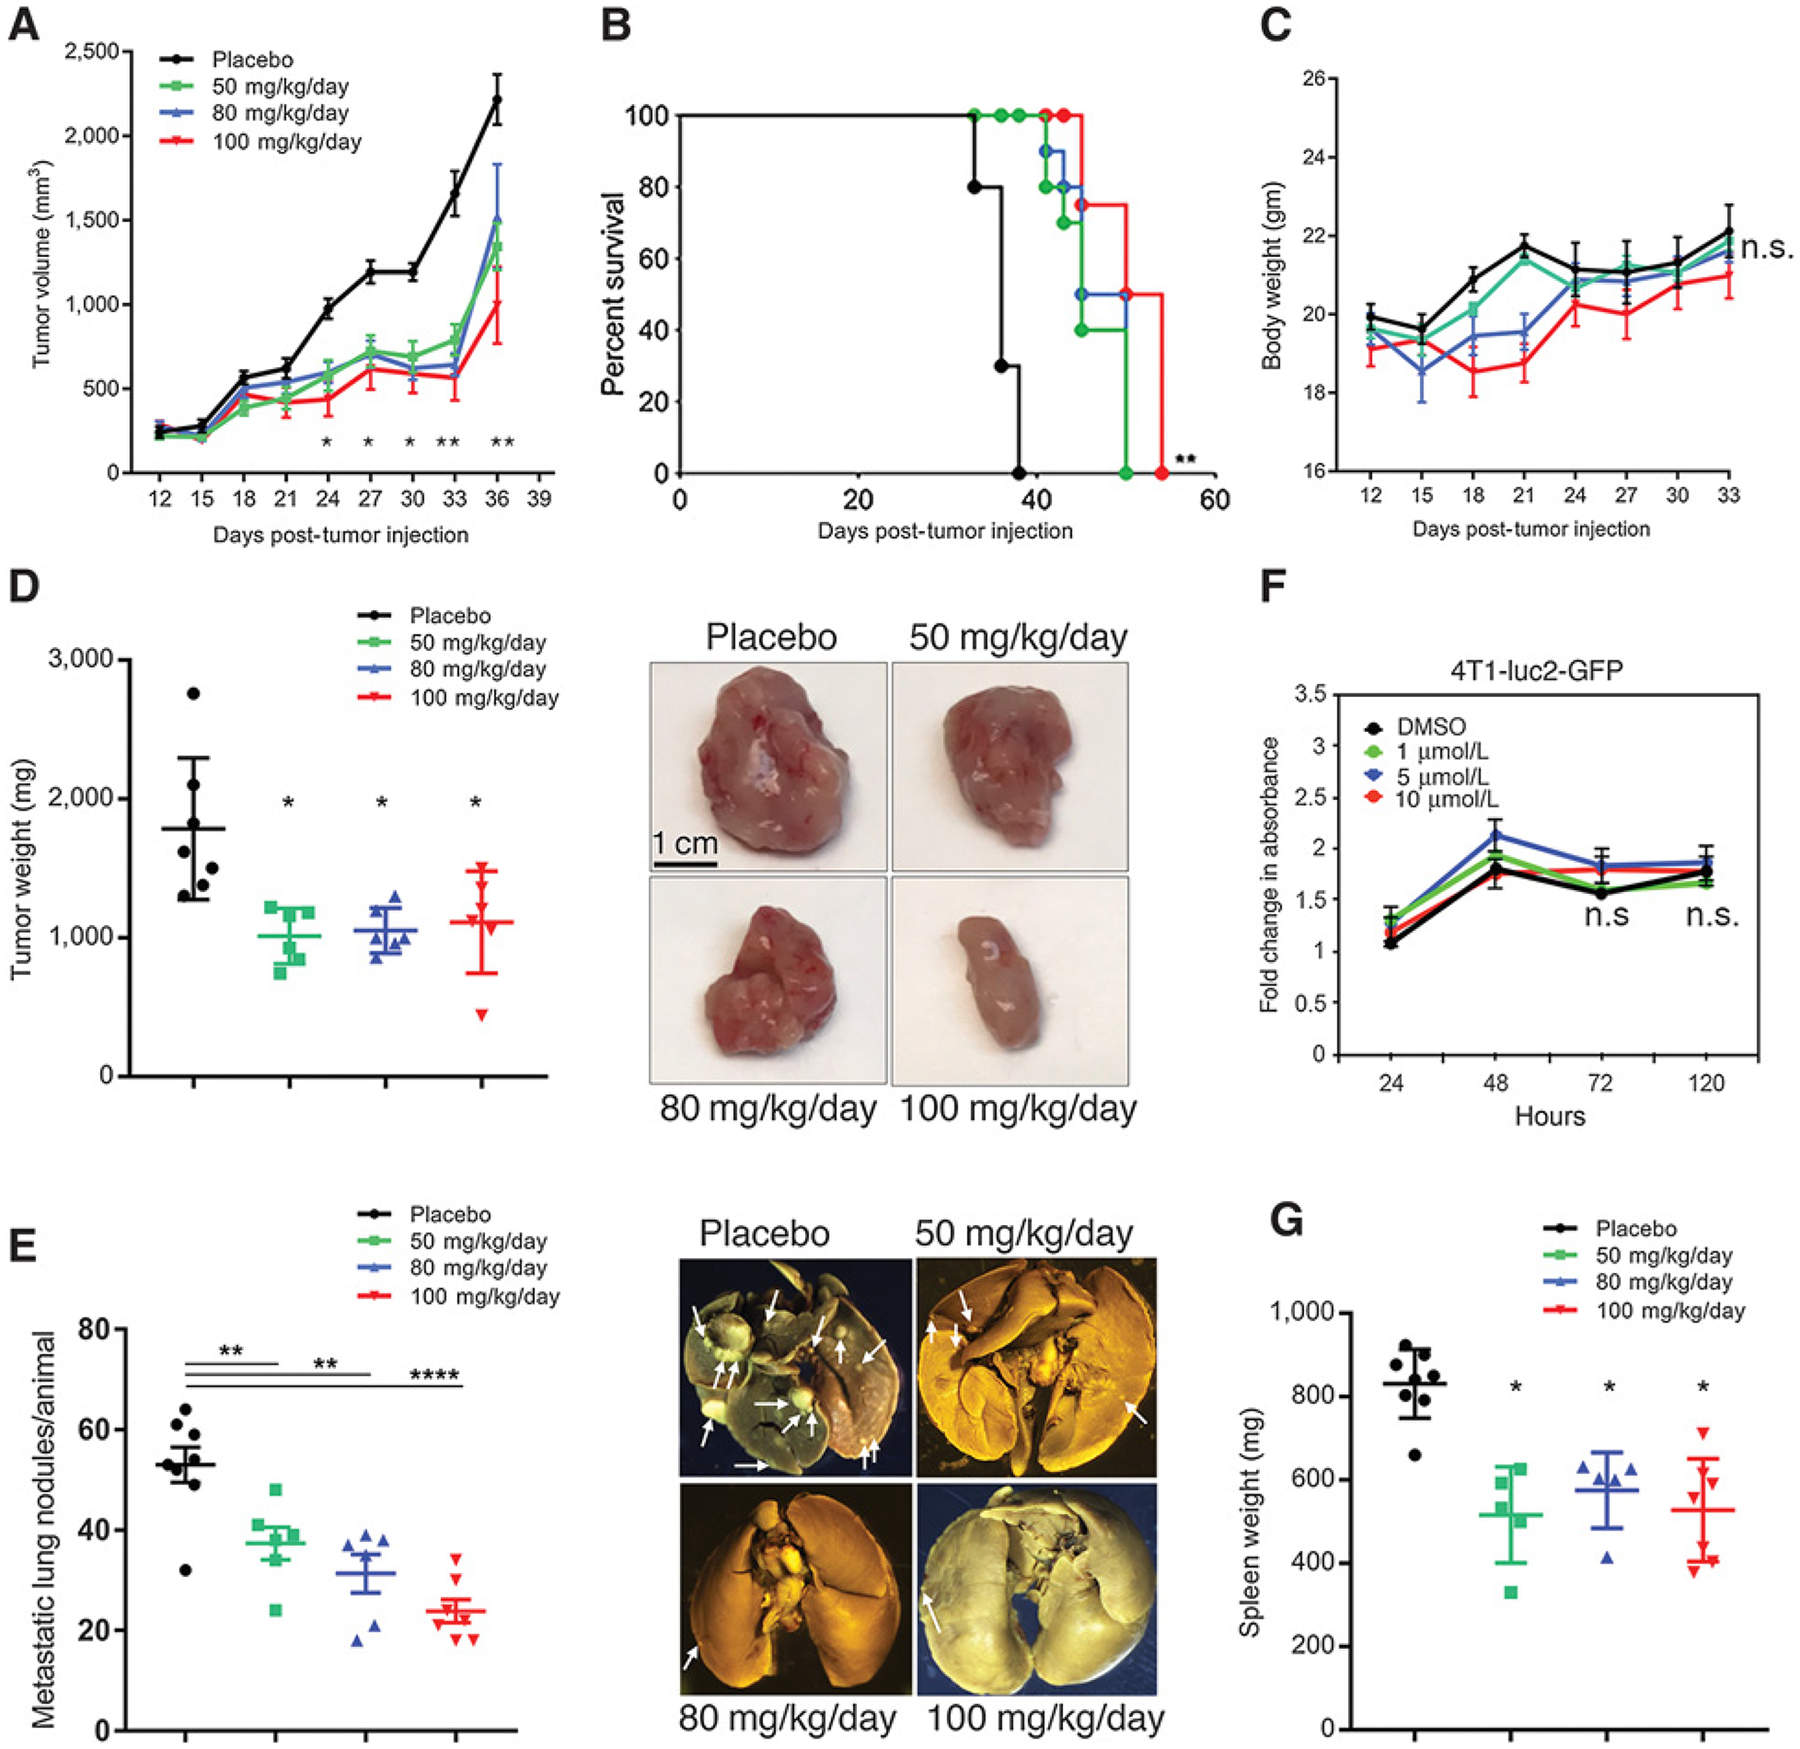
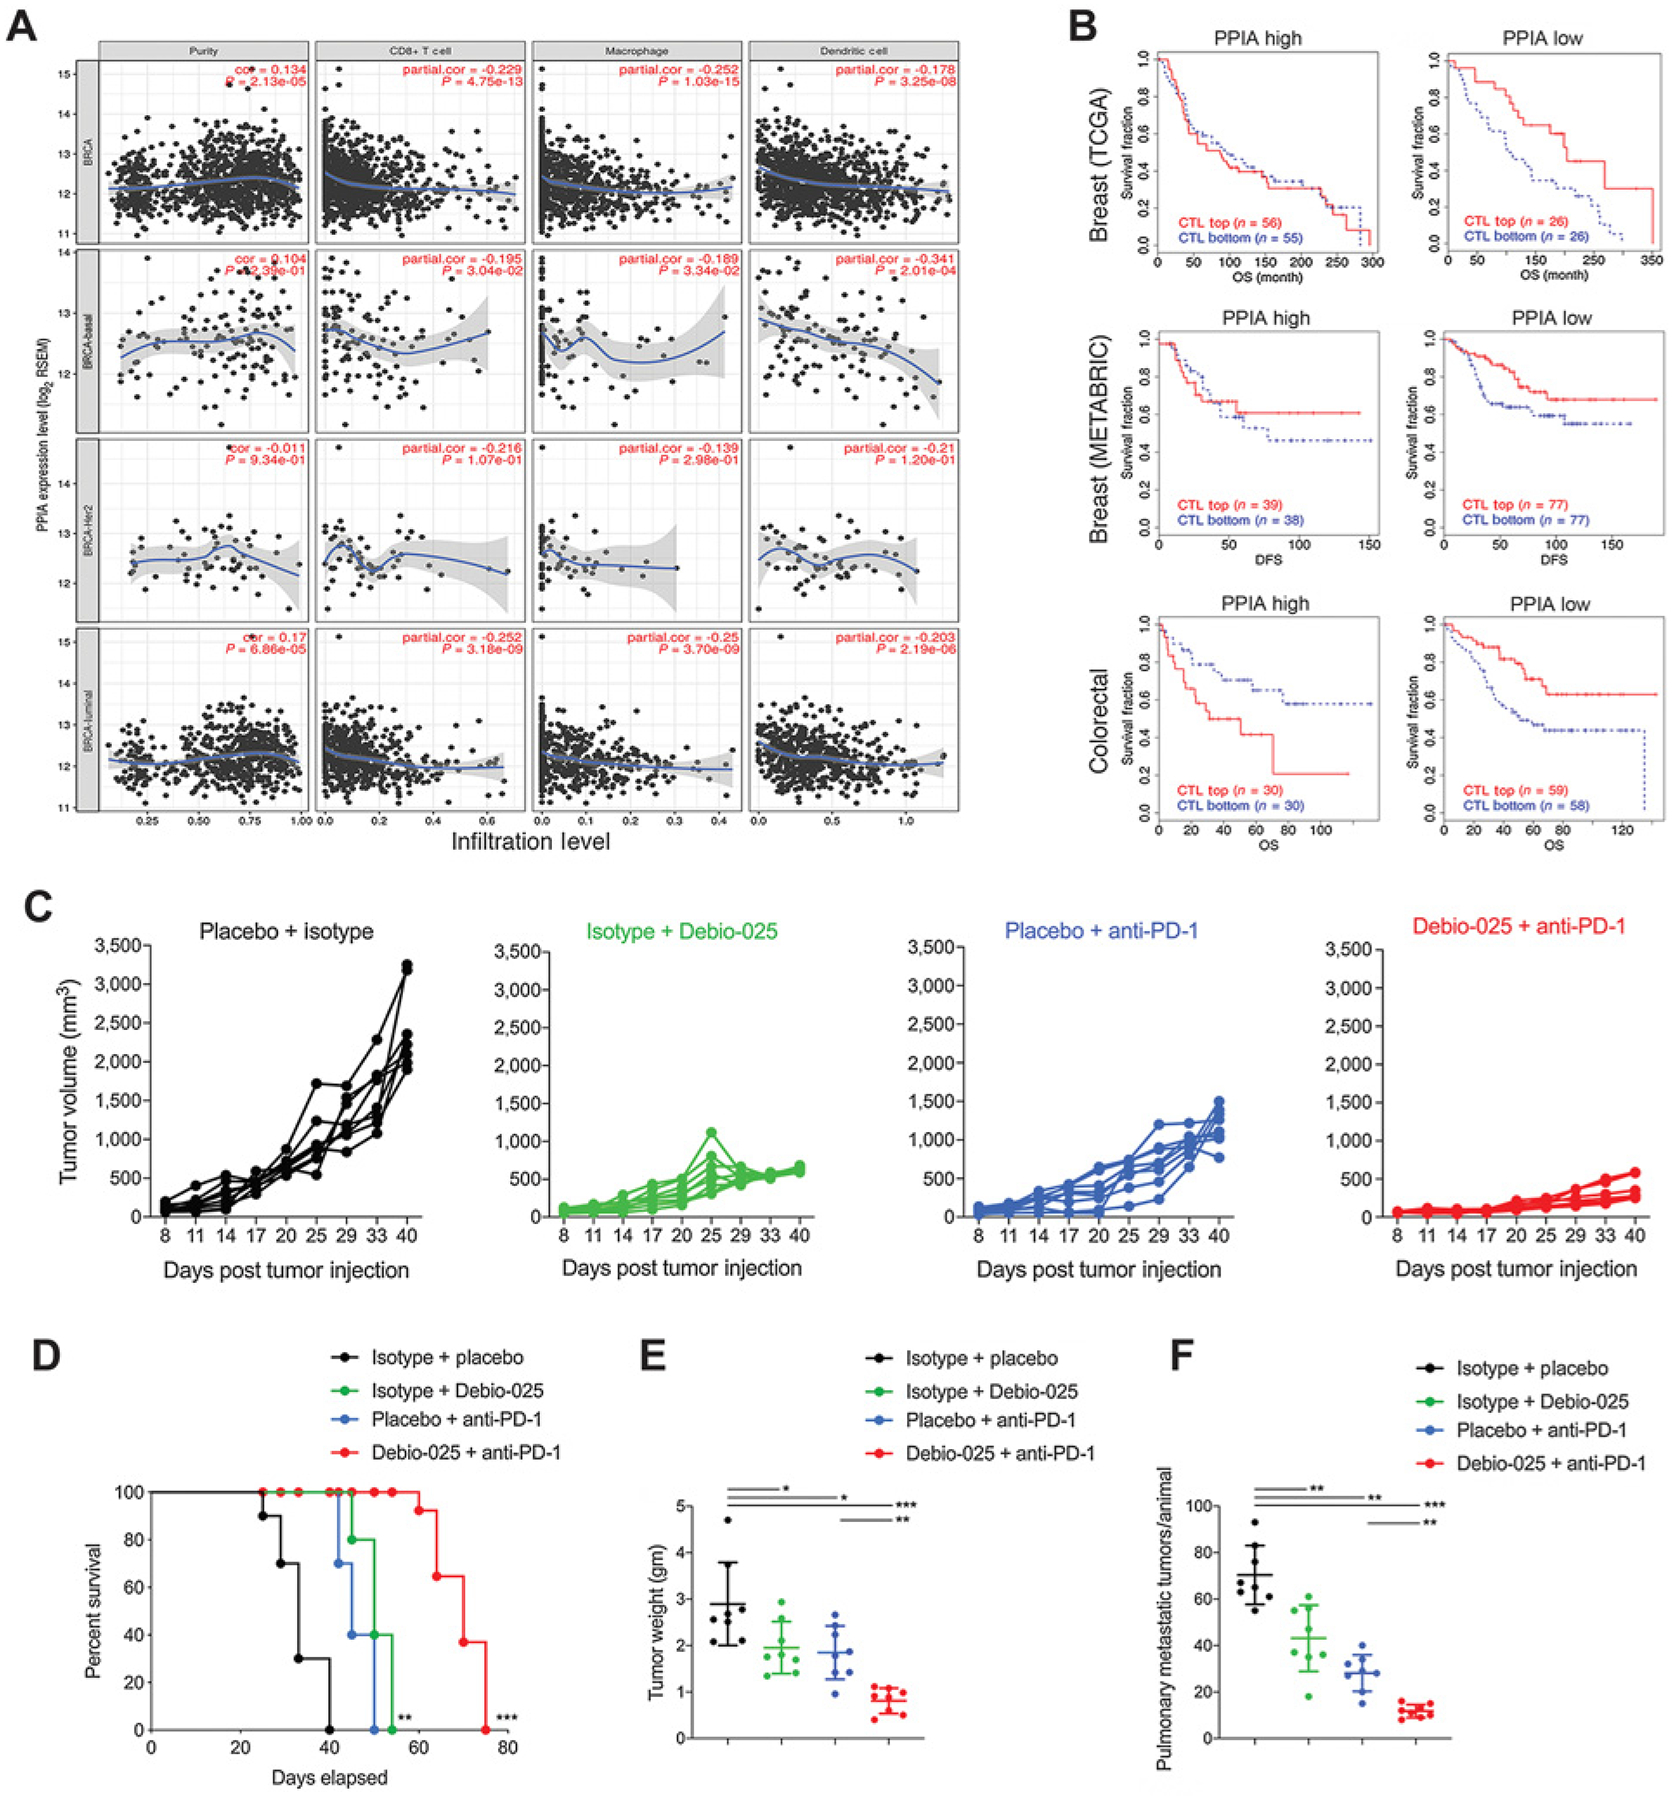
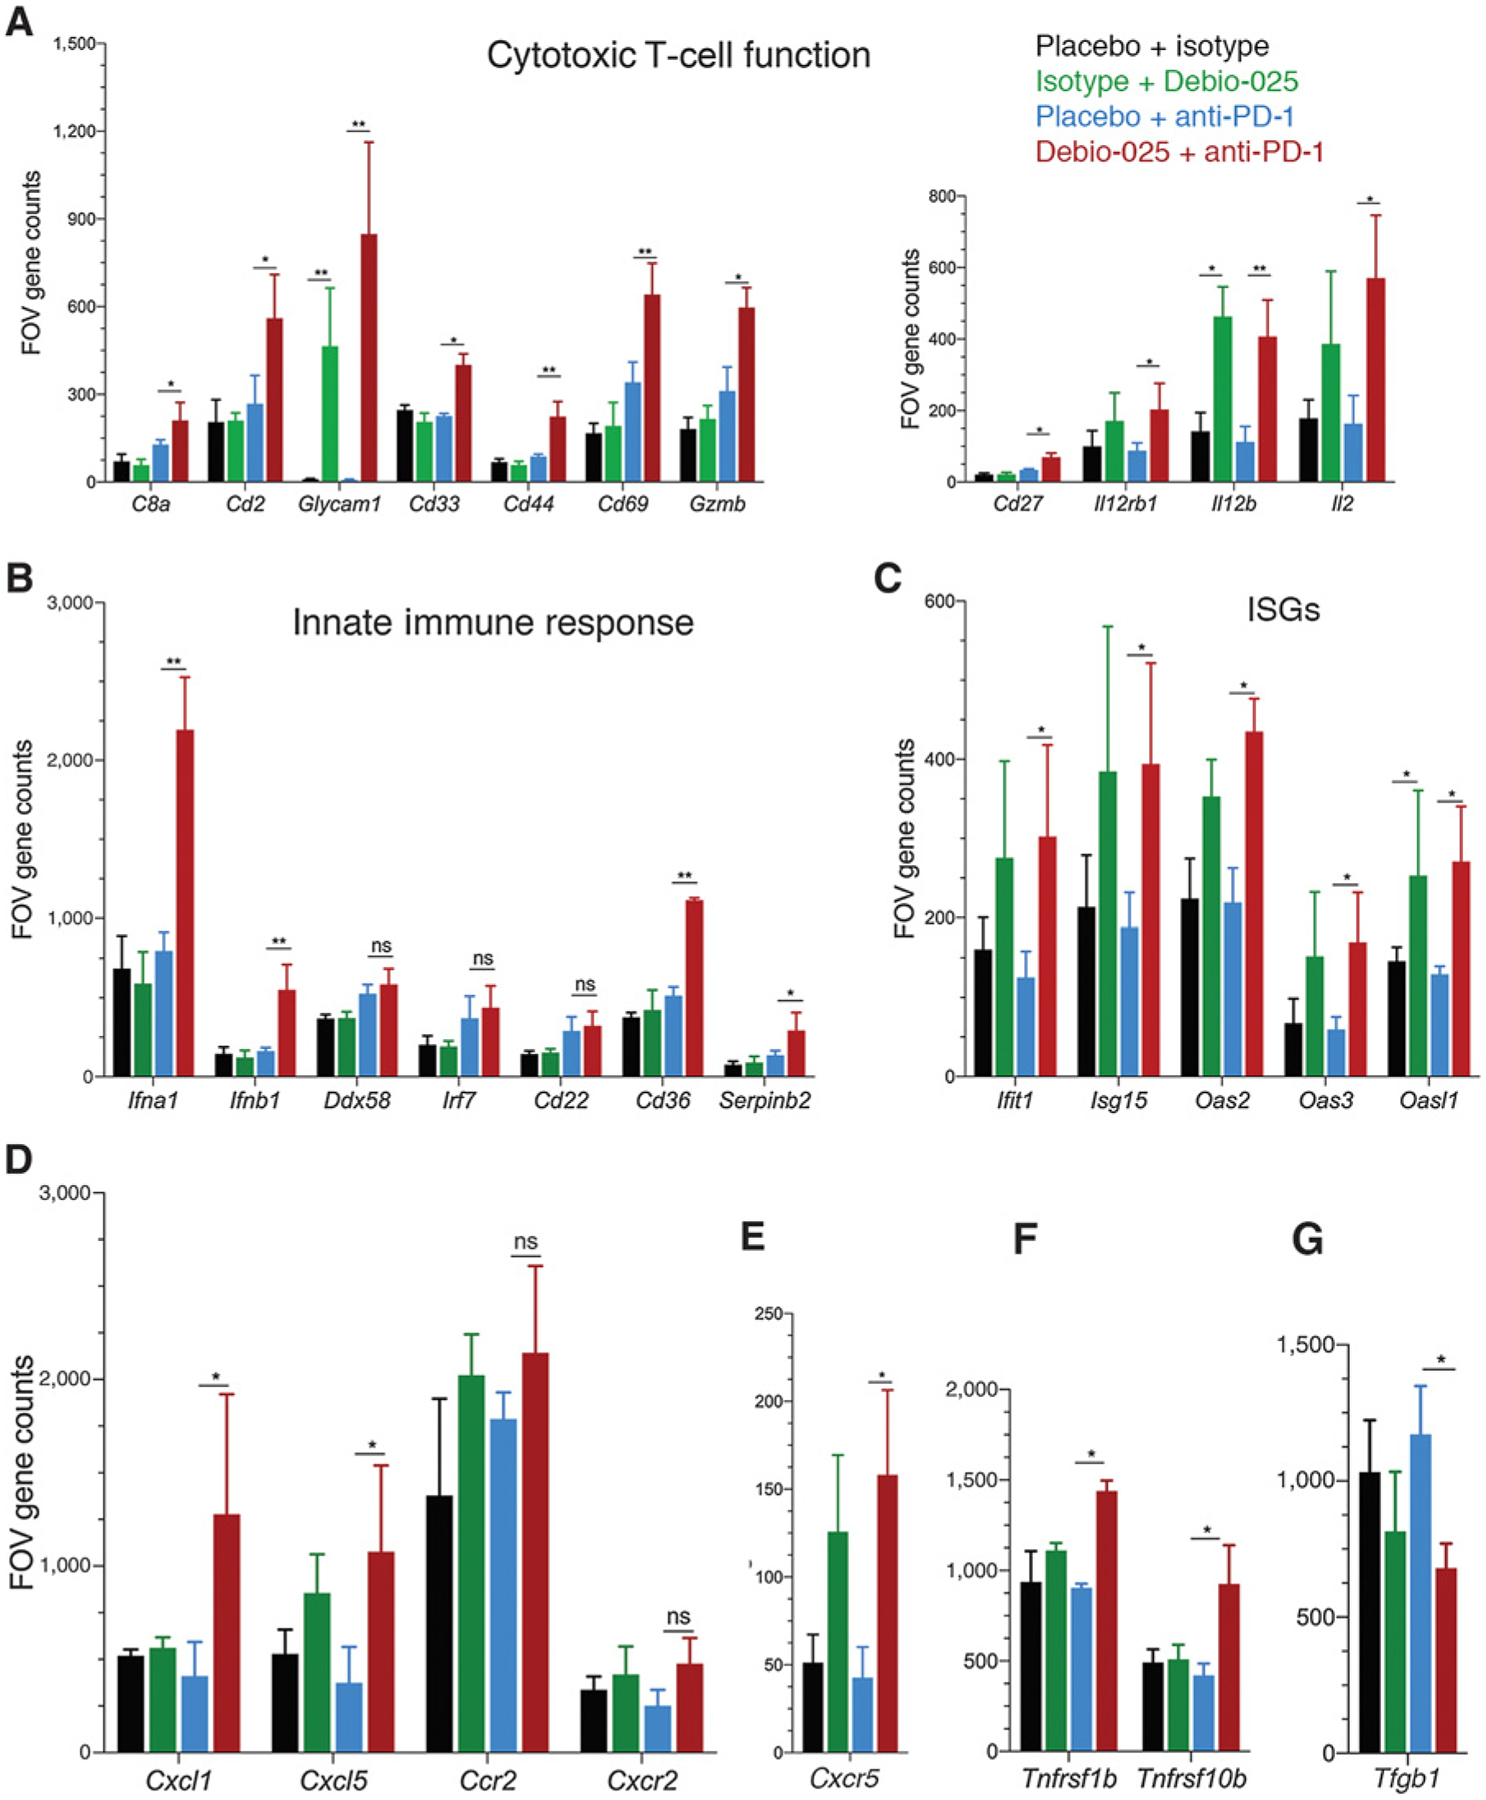
The Crk adaptor protein, a critical modifier of multiple signaling pathways, is overexpressed in many cancers where it contributes to tumor progression and metastasis. Recently, we have shown that Crk interacts with the peptidyl prolyl cis-trans isomerase, Cyclophilin A (CypA; PP1A) via a G219P220Y221 (GPY) motif in the carboxyl-terminal linker region of Crk, thereby delaying pY221 phosphorylation and preventing downregulation of Crk signaling. Here, we investigate the physiologic significance of the CypA/Crk interaction and query whether CypA inhibition affects Crk signaling in vitro and in vivo. We show that CypA, when induced under conditions of hypoxia, regulates Crk pY221 phosphorylation and signaling in cancer cell lines. Using nuclear magnetic resonance spectroscopy, we show that CypA binds to the Crk GPY motif via the catalytic PPII domain of CypA, and small-molecule nonimmunosuppressive inhibitors of CypA (Debio-025) disrupt the CypA-CrkII interaction and restores phosphorylation of Crk Y221. In cultured cell lines, Debio-025 suppresses cell migration, and when administered in vivo in an orthotopic model of triple-negative breast cancer, Debio-025 showed antitumor efficacy either alone or in combination with anti-PD-1 mAb, reducing both tumor volume and metastatic lung dispersion. Furthermore, when analyzed by NanoString immune profiling, treatment of Debio-025 with anti-PD-1 mAb increased both T-cell signaling and innate immune signaling in tumor microenvironment. IMPLICATIONS: These data suggest that pharmacologic inhibition of CypA may provide a promising and unanticipated consequence in cancer biology, in part by targeting the CypA/CrkII axis that regulates cell migration, tumor metastasis, and host antitumor immune evasion.


Conflict of interest statement

Disclosure of Potential Conflicts of Interest

No potential conflicts of interest were disclosed.

Figures

Figure 1.
Figure 1.
Hypoxia induces CypA expression and suppresses EGF-induced Crk Y221 phosphorylation. A, Expression of CypA in human cancers by TCGA RNA-seq data analysis. Log2 (TPM+1) scale of transcript per million of CypA in indicated number of normal and cancerous tissues are shown. B, Distant metastasis–free survival of breast cancer tumor RNA-seq data analyzed by CypA expression [high (red; N = 1035) and low (black; N = 711) expression] and presented in Kaplan–Meier curve. HR and P value calculated using Cox regression analysis are indicated. C, Protein expression of multiple proline-prolyl isomerase upon induction of hypoxia by mass spectrometric analysis. Relative change in peptide counts of each proline-prolyl isomerase in normoxic and hypoxic conditions presented in heatmap. D and E, Western blot analysis of CypA gene expression in MDA-MB-231 by chemical hypoxia (CoCl2 treatment; a) and physical hypoxia (hypoxia chamber; b). F, Western blotting analysis of hypoxia-induced CypA and HIF1α expression in MDA-MB-231, MDA-MB-468, and 4T1 cells. Representative images from Western blot analysis of Crk Y221 phosphorylation upon induction of hypoxia in HS683 (G), MDA-MB-468 (H), and MDA-MB-231 cells (I). Densitometric analysis using ImageJ is shown below each panel. The bar graphs represent mean expression of Y221 phosphorylated versus total Crk in each group from three independent experiments. Cells were pretreated with CoCl2 overnight in serum-starved medium followed by EGF stimulation for indicated time points, lysates were made and probed for Crk Y221 phosphorylation. ACC, adrenocortical carcinoma; BLCA, bladder urothelial carcinoma; BRCA, breast invasive carcinoma; CESC, cervical squamous cell carcinoma and endocervical adenocarcinoma; CHOL, cholangiocarcinoma; COAD, colon adenocarcinoma; DLBC, lymphoid neoplasm diffuse large B-cell lymphoma; ESCA, esophageal carcinoma; HNSC, head and neck squamous cell carcinoma; KICH, kidney chromophobe; KIRC, kidney renal clear cell carcinoma; KIRP, kidney renal papillary cell carcinoma; LAML, acute myeloid leukemia; LGG, brain lower grade glioma; LIHC, liver hepatocellular carcinoma; LUAD, lung adenocarcinoma; LUSC, lung squamous cell carcinoma; MESO, mesothelioma; OV, ovarian serous cystadenocarcinoma; PAAD, pancreatic adenocarcinoma; PCPG, pheochromocytoma and paraganglioma; PRAD, prostate adenocarcinoma; READ, rectum adenocarcinoma; SARC, sarcoma; SKCM, skin cutaneous melanoma; STAD, stomach adenocarcinoma; TGCT, testicular germ cell tumors; THCA, thyroid carcinoma; THYM, thymoma; UCEC, uterine corpus endometrial carcinoma; UCS, uterine carcinosarcoma; and UVM, uveal melanoma.
Figure 2.
Figure 2.
Debio-025 disrupts the Crk–CypA complex formation by a CypA-specific interaction. A, Overlaid 1H-15N Heteronuclear Single Quantum Coherence (HSQC) NMR spectra of labeled CrkII (green) and labeled CrkII titrated with equimolar unlabeled CypA (yellow). B, Overlaid 1H-15N HSQC NMR spectra of labeled CrkII (red) and labeled CrkII titrated with equimolar Debio-025. C, Overlaid 1H-15N NMR spectra of labeled CrkII (red) and labeled CrkII titrated with equimolar unlabeled CypA–Debio-025 complex (green). Schematic models are shown for each condition below. DF, Zoomed view of 1H-15N HSQC NMR spectra of residues of CrkII showing interaction with CypA. GI, Molecular models showing CrkII and Debio-025 occupy the same binding site on CypA. CypA (gray, PDB:ID 5HSV) shown as a surface representation and binding pocket for Debio-025 and CrkII (dark red; G), Debio-025 (cyan) bound to CypA (H), and CrkII peptide (216 - PEPGPYAQP - 224; cyan) bound to CypA (PDB ID: 2ms4; I). CrkII and Debio-025 occupies the same binding site on CypA.
Figure 3.
Figure 3.
Debio-025 treatment inhibits cell migration in a CypA-dependent manner. A, Tumor cell migration in response to Debio-025 treatment. DU145, MDA-MB-231, and Hs683 cells were assessed for tumor cell migration using XCELLigence assay toward serum gradient. B, Western blotting analysis of CypA knockdown using shRNA in MDA-MB-231 cells. C, Determination of effect of scramble (Scr) and CypA knockdown on migration of MDA-MB-231 cells. D, Cell proliferation assays using CellTiter-Glo luminescent cell viability assay on DU145, MDA-MB-231, and Hs683 cells to test the effect of the Debio-025 on cell proliferation of cancer cells. Error bars, SD; all P values are based on one-sided Student t tests. **, P < 0.001; ***, P < 0.001; ns, nonsignificant; WT, wild-type.
Figure 4.
Figure 4.
Debio-025 suppresses primary tumor growth and metastasis in murine breast cancer model. A, Tumor growth of wild-type 4T1 cells in mice administered with 50, 80, or 100 mg/kg/day of Debio-025 or vehicle control. B, Kaplan–Meier curve showing percentage survival of tumor-bearing mice upon Debio-025 treatment. C, Body weight analysis of 4T1 tumor–bearing mice upon administration of vehicle or indicated dosage of Debio-025. D, Tumor weight of 4T1 tumor–bearing mice at the end of 36 days upon indicated Debio-025 treatment. Representative tumors sizes from Debio-025–administered groups or vehicle treatment (n = 8/group) are shown. E, Metastasis of 4T1 tumor–bearing mice at the end of 36 days upon indicated Debio-025 treatment with representative metastatic lung nodules from the four treatment groups. F, Cell growth assay using MTT to estimate change in rate of cell proliferation upon treatment with indicated concentrations of Debio-025 for 4 days. G, Change in spleen weight upon Debio-025 treatment in tumor-bearing mice. *, P < 0.05; **, P < 0.001; ****, P < 0.0001; ns, nonsignificant.
Figure 5.
Figure 5.
CypA expression negatively correlates with cytotoxic immune cell populations and clinical response to checkpoint blockade and targeting CypA provides enhanced therapeutic response with immunotherapy. A, TIMER analysis plots for breast cancer–sequencing data from TCGA plotted and classified for overall breast cancer specimens (BRCA), basal subtype (BRCA-basal), Her2-negative subtype (BRCA-Her2), and luminal subtype (BRCA-luminal). Adjusted for purity of tumor samples sequencing data, correlation plots show CypA expression and extent of infiltration levels of CD8+ T cells, macrophage, and dendritic cells inferred from sequencing data. B, TIDE analysis plots for estimation of CypA as a gene expression biomarker to predict the clinical response to immune checkpoint blockade in CypA-high and -low expressing breast tumors (top, TCGA cohort), (middle, METABRIC cohort), and colorectal tumors (bottom, TCGA cohort). Estimation of efficacy of Debio-025 anti-PD-1 combination therapy in suppressing primary and metastatic 4T1 tumors: Debio-025 and anti-PD-1 or isotypes and vehicle control on 4T1 tumor growth were administered (see Materials and Methods for details) to estimate changes in primary tumor growth (C), survival (D), tumor weight (E), and pulmonary metastasis (F; n = 6–8/group). Error bars, SD; all P values are based on one-sided Student t tests or two-way repeated measure ANOVA. *, P < 0.05; **, P < 0.001; ***, P < 0.001; DFS, disease-free survival; OS, overall survival.
Figure 6.
Figure 6.
Effect of Debio-025 and anti-PD-1 combinatorial therapy on enrichment of antitumoral immune cell response. Gene expression of immune-related genes using NanoString pan-cancer immune profiling panel was performed from tumors harvested at the end of the study from placebo + isotype, placebo + anti-PD-1, isotype + Debio-025, and Debio-025 + anti-PD-1 treatment groups and subjected to NanoString analysis. FOV counts per gene from each sample were calculated from normalized expression presented using nSolver software. A, FOV counts for T-cell markers and cytokines related to T-cell function are shown (CD8a, Cd2, Glycam1, Cd33, Cd44, Cd69, Gzmb, Cd27, Il12rb1, Il12b, and Il2). B, FOV counts from RNA-based NanoString analysis for innate immune response markers are shown for each treatment group (Cd22, Cd36, Ddx58, Ifna1, Ifna4, Ifnb1, and Irf7). C, IFN-stimulated gene (ISG) expressions between different groups are shown (Ift1, Isg15, Oas2, Oas3, and Oasl1). Immuno-attractant chemokines (Cxcl1 and Cxcl5; D) and receptors (Ccr2 and Cxcr2) and Cxcr5 (E), antitumor chemokine receptors (Tnfrsf10b and Tnfrsf1b; F), and TGFβ (G) gene expressions between each group are shown. RNA expression values are presented in FOV counts and graphically represented by GraphPad Prism. Error bars indicate SD. Statistically significant differences are indicated in each case. *, P < 0.05; **, P < 0.01; versus vehicle group (n = 3 per group; Student two-tailed t test; ns, nonsignificant).

Similar articles

Cited by

References

    1. Matsuda M, Mayer BJ, Fukui Y, Hanafusa H. Binding of transforming protein, P47gag-crk, to a broad range of phosphotyrosine-containing proteins. Science 1990;248:1537–9. - PubMed
    1. Mayer BJ, Hamaguchi M, Hanafusa H. A novel viral oncogene with structural similarity to phospholipase C. Nature 1988;332:272–5. - PubMed
    1. Hanafusa H Protein phosphorylation and cell transformation. Zhonghua Min Guo Wei Sheng Wu Ji Mian Yi Xue Za Zhi 1991;24:1–9. - PubMed
    1. Mayer BJ, Hanafusa H. Mutagenic analysis of the v-crk oncogene: requirement for SH2 and SH3 domains and correlation between increased cellular phosphotyrosine and transformation. J Virol 1990;64:3581–9. - PMC - PubMed
    1. Birge RB, Kalodimos C, Inagaki F, Tanaka S. Crk and CrkL adaptor proteins: networks for physiological and pathological signaling. Cell Commun Signal 2009;7:13. - PMC - PubMed

Publication types

MeSH terms