Dopamine D2-Like Receptors Modulate Intrinsic Properties and Synaptic Transmission of Parvalbumin Interneurons in the Mouse Primary Motor Cortex
- PMID: 32321772
- PMCID: PMC7240291
- DOI: 10.1523/ENEURO.0081-20.2020
Dopamine D2-Like Receptors Modulate Intrinsic Properties and Synaptic Transmission of Parvalbumin Interneurons in the Mouse Primary Motor Cortex
Abstract
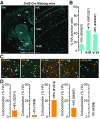
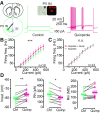
Dopamine (DA) plays a crucial role in the control of motor and higher cognitive functions such as learning, working memory, and decision making. The primary motor cortex (M1), which is essential for motor control and the acquisition of motor skills, receives dopaminergic inputs in its superficial and deep layers from the midbrain. However, the precise action of DA and DA receptor subtypes on the cortical microcircuits of M1 remains poorly understood. The aim of this work was to investigate in mice how DA, through the activation of D2-like receptors (D2Rs), modulates the cellular and synaptic activity of M1 parvalbumin-expressing interneurons (PVINs) which are crucial to regulate the spike output of pyramidal neurons (PNs). By combining immunofluorescence, ex vivo electrophysiology, pharmacology and optogenetics approaches, we show that D2R activation increases neuronal excitability of PVINs and GABAergic synaptic transmission between PVINs and PNs in Layer V of M1. Our data reveal how cortical DA modulates M1 microcircuitry, which could be important in the acquisition of motor skills.
Keywords: D2 receptors; electrophysiology; neuromodulation; parvalbumin interneuron; primary motor cortex.
Copyright © 2020 Cousineau et al.
Figures


Similar articles
-
Loss of Midbrain Dopamine Neurons Does Not Alter GABAergic Inhibition Mediated by Parvalbumin-Expressing Interneurons in Mouse Primary Motor Cortex.eNeuro. 2024 May 9;11(5):ENEURO.0010-24.2024. doi: 10.1523/ENEURO.0010-24.2024. Print 2024 May. eNeuro. 2024. PMID: 38658137 Free PMC article.
-
Age-Dependent Modulation of Layer V Pyramidal Neuron Excitability in the Mouse Primary Motor Cortex by D1 Receptor Agonists and Antagonists.Neuroscience. 2024 Jan 9;536:21-35. doi: 10.1016/j.neuroscience.2023.11.006. Epub 2023 Nov 11. Neuroscience. 2024. PMID: 37952579
-
Dopamine control of pyramidal neuron activity in the primary motor cortex via D2 receptors.Front Neural Circuits. 2014 Feb 28;8:13. doi: 10.3389/fncir.2014.00013. eCollection 2014. Front Neural Circuits. 2014. PMID: 24616667 Free PMC article.
-
Dopaminergic modulation of primary motor cortex: From cellular and synaptic mechanisms underlying motor learning to cognitive symptoms in Parkinson's disease.Neurobiol Dis. 2022 Jun 1;167:105674. doi: 10.1016/j.nbd.2022.105674. Epub 2022 Mar 1. Neurobiol Dis. 2022. PMID: 35245676 Review.
-
Dopaminergic meso-cortical projections to m1: role in motor learning and motor cortex plasticity.Front Neurol. 2013 Oct 7;4:145. doi: 10.3389/fneur.2013.00145. Front Neurol. 2013. PMID: 24109472 Free PMC article. Review.
Cited by
-
Early decreases in cortical mid-gamma peaks coincide with the onset of motor deficits and precede exaggerated beta build-up in rat models for Parkinson's disease.Neurobiol Dis. 2021 Jul;155:105393. doi: 10.1016/j.nbd.2021.105393. Epub 2021 May 15. Neurobiol Dis. 2021. PMID: 34000417 Free PMC article.
-
Electroacupuncture alleviated depression-like behaviors in ventromedial prefrontal cortex of chronic unpredictable mild stress-induced rats: Increasing synaptic transmission and phosphorylating dopamine transporter.CNS Neurosci Ther. 2023 Sep;29(9):2608-2620. doi: 10.1111/cns.14200. Epub 2023 Apr 1. CNS Neurosci Ther. 2023. PMID: 37002793 Free PMC article.
-
Adaptive control of synaptic plasticity integrates micro- and macroscopic network function.Neuropsychopharmacology. 2023 Jan;48(1):121-144. doi: 10.1038/s41386-022-01374-6. Epub 2022 Aug 29. Neuropsychopharmacology. 2023. PMID: 36038780 Free PMC article. Review.
-
Deep Brain Stimulation restores information processing in parkinsonian cortical networks.medRxiv [Preprint]. 2024 Aug 28:2024.08.25.24310748. doi: 10.1101/2024.08.25.24310748. medRxiv. 2024. PMID: 39252923 Free PMC article. Preprint.
-
Motor cortical circuit adaptations in parkinsonism.Neural Regen Res. 2024 Oct 1;19(10):2107-2108. doi: 10.4103/1673-5374.392884. Epub 2024 Jan 8. Neural Regen Res. 2024. PMID: 38488541 Free PMC article. No abstract available.
References
-
- Ascoli GA, Alonso-Nanclares L, Anderson SA, Barrionuevo G, Benavides-Piccione R, Burkhalter A, Buzsáki G, Cauli B, Defelipe J, Fairén A, Feldmeyer D, Fishell G, Fregnac Y, Freund TF, Gardner D, Gardner EP, Goldberg JH, Helmstaedter M, Hestrin S, Karube F, et al. (2008) Petilla terminology: nomenclature of features of GABAergic interneurons of the cerebral cortex. Nat Rev Neurosci 9:557–568. 10.1038/nrn2402 - DOI - PMC - PubMed
Publication types
MeSH terms
Substances
LinkOut - more resources
Full Text Sources
Molecular Biology Databases
