. 2020 Jun 16;94(13):e00165-20.
doi: 10.1128/JVI.00165-20. Print 2020 Jun 16.

Defective Influenza A Virus RNA Products Mediate MAVS-Dependent Upregulation of Human Leukocyte Antigen Class I Proteins

Affiliations

Defective Influenza A Virus RNA Products Mediate MAVS-Dependent Upregulation of Human Leukocyte Antigen Class I Proteins

Mir Munir A Rahim et al. J Virol. .

Abstract

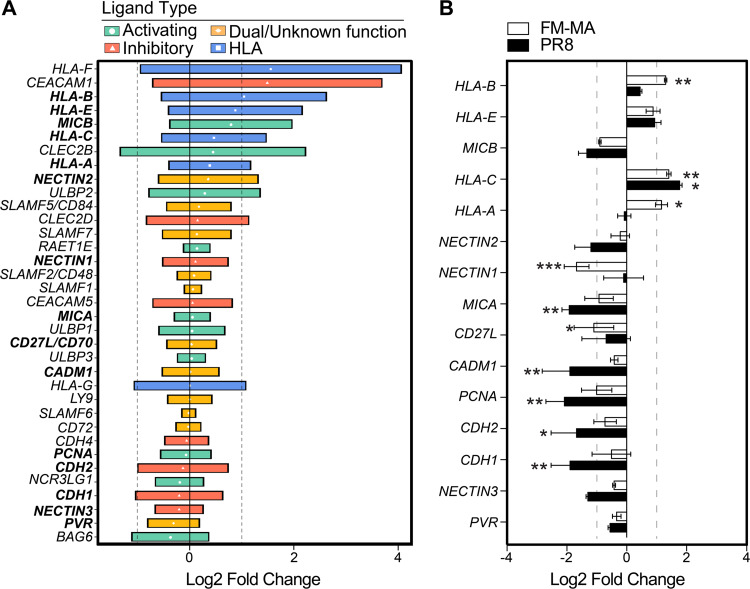
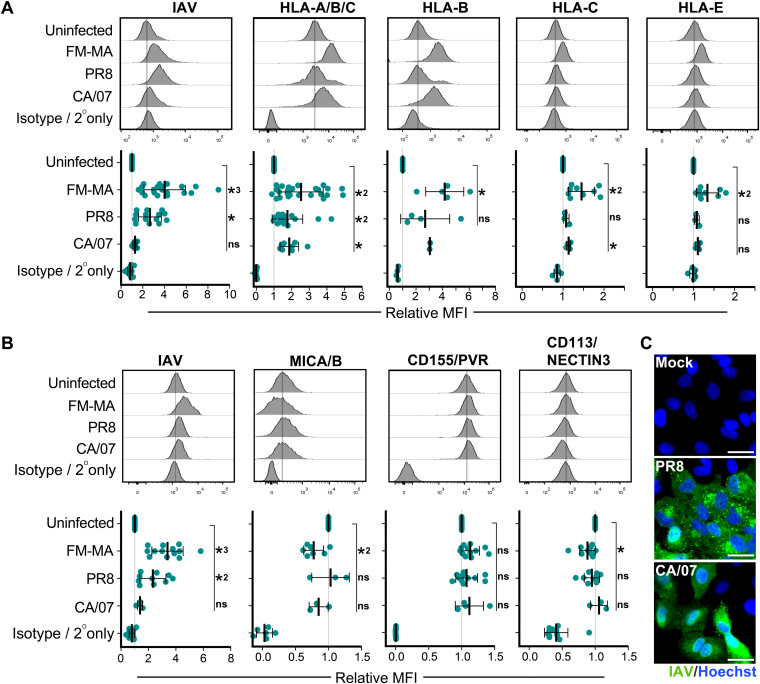
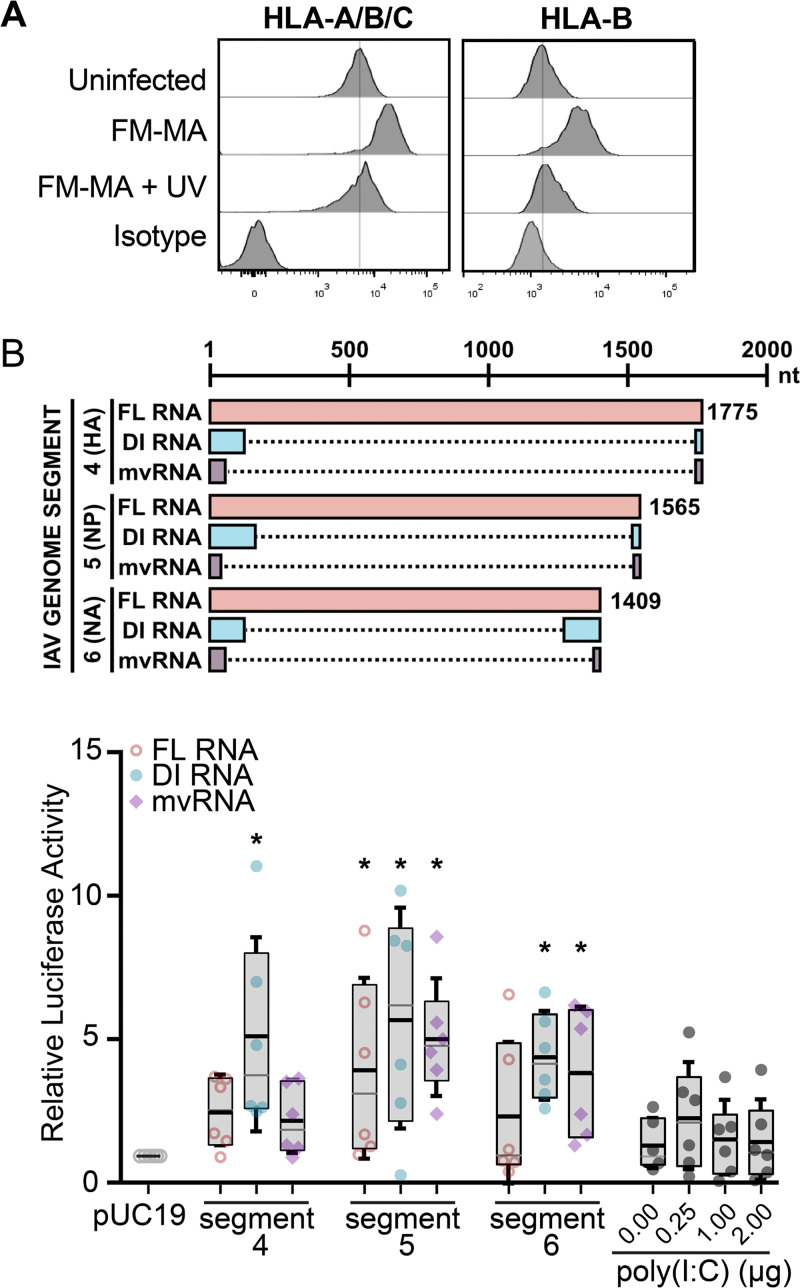
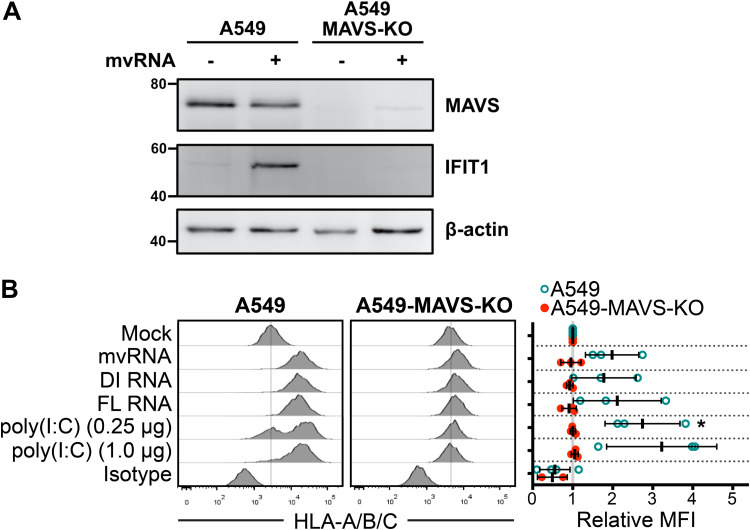
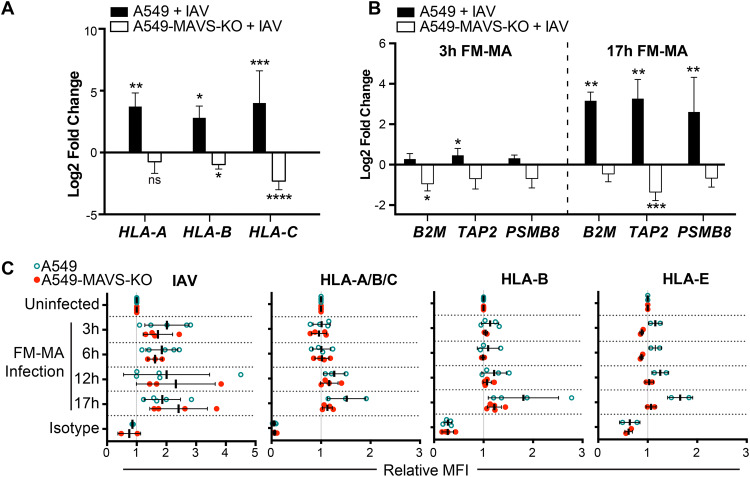
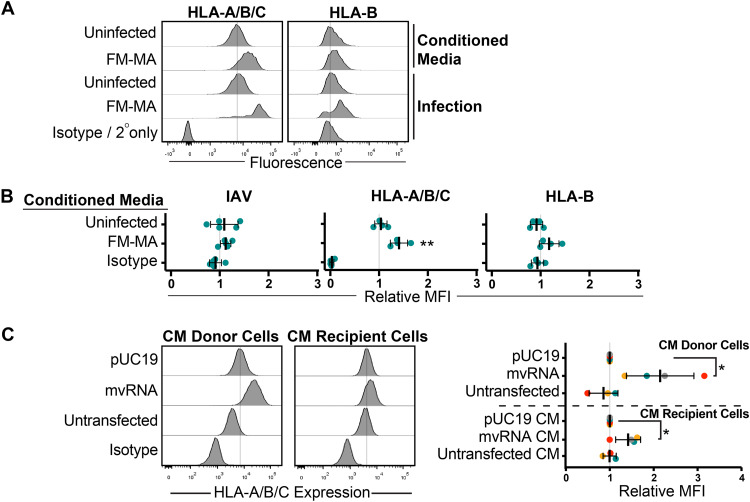
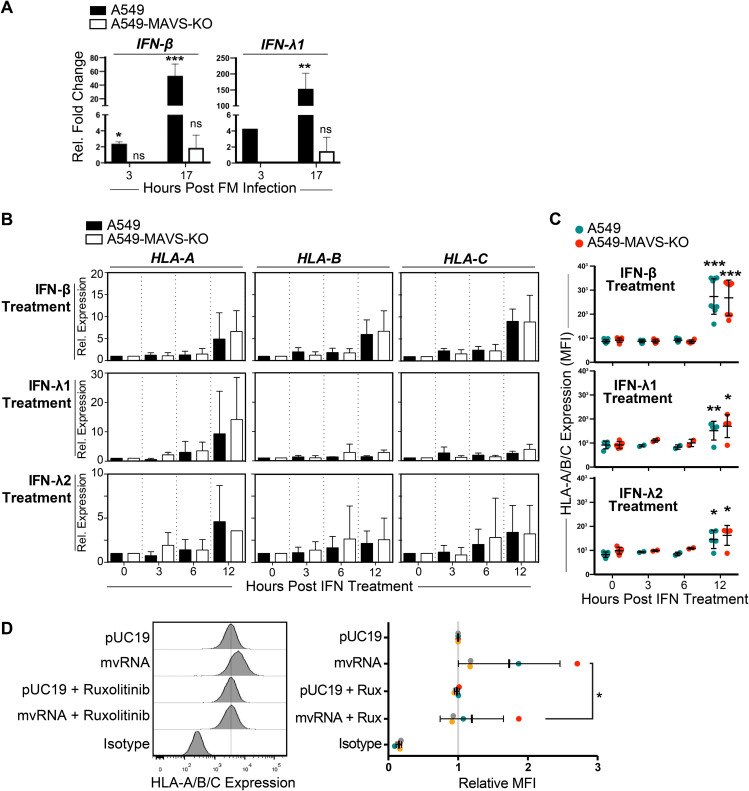
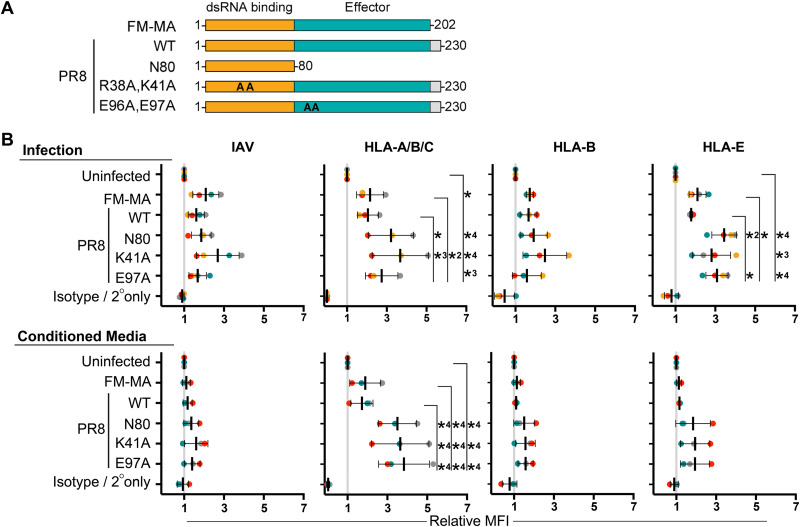
Influenza A virus (IAV) increases the presentation of class I human leukocyte antigen (HLA) proteins that limit antiviral responses mediated by natural killer (NK) cells, but molecular mechanisms for these processes have not yet been fully elucidated. We observed that infection with A/Fort Monmouth/1/1947(H1N1) IAV significantly increased the presentation of HLA-B, -C, and -E on lung epithelial cells. Virus entry was not sufficient to induce HLA upregulation because UV-inactivated virus had no effect. Aberrant internally deleted viral RNAs (vRNAs) known as mini viral RNAs (mvRNAs) and defective interfering RNAs (DI RNAs) expressed from an IAV minireplicon were sufficient for inducing HLA upregulation. These defective RNAs bind to retinoic acid-inducible gene I (RIG-I) and initiate mitochondrial antiviral signaling (MAVS) protein-dependent antiviral interferon (IFN) responses. Indeed, MAVS was required for HLA upregulation in response to IAV infection or ectopic mvRNA/DI RNA expression. The effect was partially due to paracrine signaling, as we observed that IAV infection or mvRNA/DI RNA-expression stimulated production of IFN-β and IFN-λ1 and conditioned media from these cells elicited a modest increase in HLA surface levels in naive epithelial cells. HLA upregulation in response to aberrant viral RNAs could be prevented by the Janus kinase (JAK) inhibitor ruxolitinib. While HLA upregulation would seem to be advantageous to the virus, it is kept in check by the viral nonstructural 1 (NS1) protein; we determined that NS1 limits cell-intrinsic and paracrine mechanisms of HLA upregulation. Taken together, our findings indicate that aberrant IAV RNAs stimulate HLA presentation, which may aid viral evasion of innate immunity.IMPORTANCE Human leukocyte antigens (HLAs) are cell surface proteins that regulate innate and adaptive immune responses to viral infection by engaging with receptors on immune cells. Many viruses have evolved ways to evade host immune responses by modulating HLA expression and/or processing. Here, we provide evidence that aberrant RNA products of influenza virus genome replication can trigger retinoic acid-inducible gene I (RIG-I)/mitochondrial antiviral signaling (MAVS)-dependent remodeling of the cell surface, increasing surface presentation of HLA proteins known to inhibit the activation of an immune cell known as a natural killer (NK) cell. While this HLA upregulation would seem to be advantageous to the virus, it is kept in check by the viral nonstructural 1 (NS1) protein, which limits RIG-I activation and interferon production by the infected cell.

Keywords: DI RNAs; KIR; MAVS; NK cells; RIG-I; class I HLA; class I MHC; influenza A virus; interferon; mvRNAs.


Figures

FIG 1
FIG 1
IAV infection of epithelial cells increases class I HLA gene expression. (A) Expression of NK cell ligands from 18 publicly available gene expression data sets from in vitro IAV infection of A549 cells and primary human lung cells. NK ligands are classified as activating (green), ambiguous function (orange), and inhibitory (red). Class I HLA proteins are indicated in blue. Data are presented as the log2 fold change relative to uninfected controls for each data set; median values with interquartile range (IQR) are shown. Vertical dashed lines indicate 2-fold change thresholds. (B) A549 cells were infected with PR8 or FM-MA or mock-infected for 17 h, and RNA was harvested for RT-qPCR. The relative expression of NK cell ligands was expressed as log2 fold change relative to mock-infected controls. Vertical dashed lines indicate 2-fold change thresholds. N = 3; *, P < 0.05; **, P < 0.01; ***, P < 0.001.
FIG 2
FIG 2
IAV infection alters cell surface expression of ligands for NK cell receptors. A549 cells were infected with FM-MA, PR8, or CA/07 at an MOI of 1. At 17 h, cells were fixed and immunostained to determine cell surface levels of NK cell ligands; cells were subsequently permeabilized for immunostaining of intracellular IAV proteins. (A) Flow cytometry analysis of cells immunostained with a pan-HLA-A/B/C antibody, or antibodies specific for class I HLA proteins HLA-B, HLA-C, or HLA-E or isotype antibody controls. (B) Flow cytometry analysis for cells immunostained with antibodies to detect NK cell-activating ligands MICA/B and CD155/PVR, or inhibitory ligand CD113/NECTIN3, or isotype antibody controls. Representative histograms (top) show results of a single experiment; the vertical lines represent the expression level of the target in uninfected cells. (Bottom) Mean fluorescence intensity (MFI) relative to uninfected cells. Each data point represents an independent experiment. Means ± SD are shown. *, P < 0.05; *2, P < 0.01; *3 P < 0.001. (C) A549 cells were mock infected or infected with PR8 for 16 h or CA/07 for 15 h at an MOI of 1, fixed, permeabilized, and stained with polyclonal antibodies specific for IAV proteins (green). DNA was stained with Hoechst-33342 (blue). Scale bar represents 20 μm.
FIG 3
FIG 3
Defective viral RNAs increase ISRE-dependent luciferase activity in A549 cells. (A) FM-MA inoculum was exposed to UV light prior to infection of A549 cells at MOI of 1. At 17 hpi, cells were fixed and immunostained with a pan-anti-HLA-A/B/C antibody or an anti-HLA-B antibody and processed for flow cytometry. The vertical lines indicate the HLA expression level in uninfected cells. Representative data from one out of two independent experiments is shown. (B) (Top) Cartoon compares RNAs derived from the indicated genome segments and expressed from pPolI-based minireplicon plasmids, including full-length (FL) vRNA, defective interfering (DI) vRNA, or mini-viral RNA (mvRNA); dashed lines mark internal deletions on the DI RNAs and mvRNAs. (Bottom) A549 cells were transfected with IAV minireplicons expressing the indicated FL vRNAs, DI RNAs, or mvRNAs derived from the indicated genome segments. An ISRE-driven firefly luciferase reporter plasmid was cotransfected with minireplicon plasmids to measure IFN signaling, along with a Renilla luciferase plasmid that served as normalization control. Poly(I·C) and an empty pUC19 plasmid served as positive and negative controls, respectively. Firefly luciferase activity was normalized to Renilla luciferase control for each sample, and data were expressed as fold change compared with pUC19 plasmid transfection (n = 6; *, P < 0.05; IQR boxes and SD whiskers are shown).
FIG 4
FIG 4
Defective viral RNAs increase surface HLA presentation in a MAVS-dependent manner. (A) A549 cells or A549-MAVS-KO cells were transfected with IAV minireplicon expressing mvRNA from genome segment 5 or empty pUC19 control for 24 h prior to harvest of protein lysates and immunoblotting with antibodies for the indicated target proteins. (B) A549 cells or A549 MAVS-KO cells were transfected with IAV minireplicon expressing defective vRNAs from genome segment 5 and analyzed by flow cytometry at 48 h posttransfection via surface immunostaining with a pan-anti-HLA-A/B/C antibody (n = 3). Histograms from a representative experiment are shown on the left; the vertical lines indicate the expression level of the target in uninfected cells. On the right, relative MFI values from at least 3 independent experiments are shown. *, P < 0.05.
FIG 5
FIG 5
Class I HLA upregulation in IAV-infected cells is MAVS dependent. A549 cells or A549-MAVS-KO cells were infected with FM-MA at an MOI of 1. RNA was harvested for RT-qPCR at 3 hpi or 17 hpi. (A) Relative fold change in HLA-A, -B, and -C transcript levels in A549 cells or A549-MAVS-KO cells at 17 hpi (n = 3). (B) Relative fold change in B2M, TAP, and PSMB8 transcript levels in A549 and A549 MAVS-KO cells at 3 hpi or 17 hpi (n = 3). (C) Relative MFI of cell surface HLA proteins in FM-MA-infected A549 cells and A549-MAVS-KO cells at indicated times, relative to uninfected controls. *, P < 0.05; **, P < 0.01; ***, P < 0.001.
FIG 6
FIG 6
Defective IAV RNAs elicit cell-intrinsic and paracrine upregulation of class I HLA proteins. (A) A549 cells were treated with conditioned medium containing UV-inactivated culture supernatant from FM-MA-infected cells. Surface HLA levels on recipient cells (17 h posttreatment) and infected donor cells (17 hpi) were determined by flow cytometry. Histograms from a representative experiment are shown. Vertical dashed-lines indicate the expression level in uninfected cells. (B) MFI of cell surface HLA proteins on recipient cells from A relative to cells treated with conditioned media from mock-infected cells. Each data point represents an independent experiment. (C) A549 cells were treated with conditioned medium from cells transfected with IAV minireplicon expressing defective vRNAs from genome segment 5 or from control untransfected cells or pUC19 vector-transfected cells. After 24 h, cells were fixed and immunostained with a pan-anti-HLA-A/B/C antibody (n = 3). Histograms from a representative experiment are shown on the left; vertical lines indicate the expression level of targets in uninfected cells. On the right, relative MFI values from at least 3 independent experiments are shown (*, P < 0.05).
FIG 7
FIG 7
HLA upregulation in response to defective IAV RNAs is dependent on IFN signaling. (A) A549 cells or A549-MAVS-KO cells were infected with FM-MA for 17 h, and relative levels of IFN-β and IFN-λ1 transcripts compared with uninfected controls were analyzed by RT-qPCR (n = 3). (B) A549 cells or A549-MAVS-KO cells were treated with recombinant IFN-β, IFN-λ1, or IFN-λ2, and RNA was harvested over a 12-h time course. The relative expression of HLA-A, -B, and –C transcripts was analyzed by RT-qPCR. (C) The surface expression of HLA-A/B/C was determined by immunostaining and flow cytometry of cells harvested over the time course of IFN treatment described in B (n = 3). (D) Analysis of HLA surface expression on A549 cells transfected with IAV minireplicon expressing defective vRNAs from genome segment 5 or from control pUC19 vector-transfected cells. At 6 h posttransfection, cells were treated with ruxolitinib (Rux) or mock treated. *, P < 0.05; **, P < 0.01; ***, P < 0.001.
FIG 8
FIG 8
NS1 protein limits cell-intrinsic and paracrine upregulation of class I HLA proteins. (A) A cartoon representing wild-type and mutant NS1 proteins used in this study. A carboxy-terminal disordered tail region present in PR8 NS1 and absent in FM-MA NS1 is shown in gray. Positions of alanine substitutions in R38A, K41A and E96A, E97A mutant proteins are indicated as “AA.” Amino-terminal double-stranded RNA (dsRNA) binding domain is in orange; effector domain is in teal. (B) A549 cells were infected with the indicated viruses at an MOI of 1 or mock infected. At 17 hpi, cell supernatants were collected prior to cell fixation and transferred to naive A549 cells for an additional 17 h of incubation prior to fixation. Donor and recipient cells were immunostained with the indicated anti-HLA antibodies to determine cell surface levels of NK cell ligands; cells were subsequently permeabilized for immunostaining of intracellular IAV proteins and analyzed by flow cytometry. (Top) Data from donor-infected or mock-infected cells. (Bottom) Data from cells exposed to conditioned media. Data are presented as MFI relative to uninfected cells or conditioned media treatment from uninfected cells. Each data point represents an independent experiment. Means ± SD are shown. *, P < 0.05; *2, P < 0.01; *3, P < 0.001; *4, P < 0.0001 indicate significance determined by Tukey’s multiple-comparison test.

Similar articles

Cited by

References

    1. Iwasaki A, Pillai PS. 2014. Innate immunity to influenza virus infection. Nat Rev Immunol 14:315–328. doi:10.1038/nri3665. - DOI - PMC - PubMed
    1. Alexopoulou L, Holt AC, Medzhitov R, Flavell RA. 2001. Recognition of double-stranded RNA and activation of NF-kappaB by Toll-like receptor 3. Nature 413:732–738. doi:10.1038/35099560. - DOI - PubMed
    1. Pichlmair A, Schulz O, Tan CP, Näslund TI, Liljeström P, Weber F, Reis e Sousa C. 2006. RIG-I-mediated antiviral responses to single-stranded RNA bearing 5′-phosphates. Science 314:997–1001. doi:10.1126/science.1132998. - DOI - PubMed
    1. Kato H, Takeuchi O, Sato S, Yoneyama M, Yamamoto M, Matsui K, Uematsu S, Jung A, Kawai T, Ishii KJ, Yamaguchi O, Otsu K, Tsujimura T, Koh C-S, Reis e Sousa C, Matsuura Y, Fujita T, Akira S. 2006. Differential roles of MDA5 and RIG-I helicases in the recognition of RNA viruses. Nature 441:101–105. doi:10.1038/nature04734. - DOI - PubMed
    1. Le Goffic R, Pothlichet J, Vitour D, Fujita T, Meurs E, Chignard M, Si-Tahar M. 2007. Cutting Edge: influenza A virus activates TLR3-dependent inflammatory and RIG-I-dependent antiviral responses in human lung epithelial cells. J Immunol 178:3368–3372. doi:10.4049/jimmunol.178.6.3368. - DOI - PubMed

Publication types

MeSH terms