. 2020 Apr 22;5(2):e00932-19.
doi: 10.1128/mSphere.00932-19.

Host Cathelicidin Exacerbates Group B Streptococcus Urinary Tract Infection

Affiliations

Host Cathelicidin Exacerbates Group B Streptococcus Urinary Tract Infection

Kathryn A Patras et al. mSphere. .

Abstract

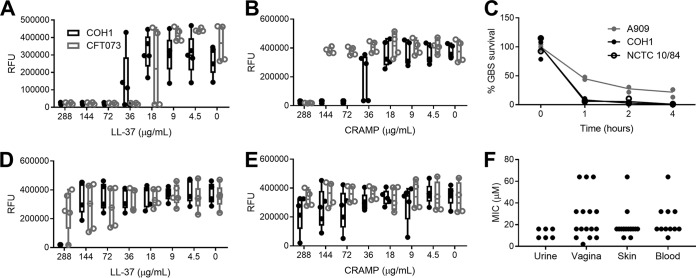
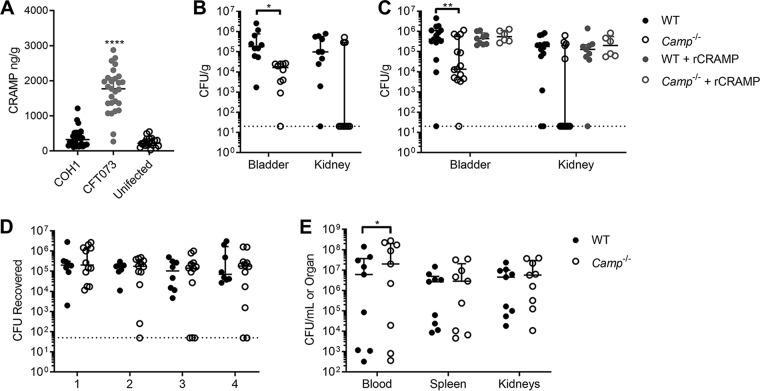
Group B Streptococcus (GBS) causes frequent urinary tract infection (UTI) in susceptible populations, including individuals with type 2 diabetes and pregnant women; however, specific host factors responsible for increased GBS susceptibility in these populations are not well characterized. Here, we investigate cathelicidin, a cationic antimicrobial peptide, known to be critical for defense during UTI with uropathogenic Escherichia coli (UPEC). We observed a loss of antimicrobial activity of human and mouse cathelicidins against GBS and UPEC in synthetic urine and no evidence for increased cathelicidin resistance in GBS urinary isolates. Furthermore, we found that GBS degrades cathelicidin in a protease-dependent manner. Surprisingly, in a UTI model, cathelicidin-deficient (Camp-/-) mice showed decreased GBS burdens and mast cell recruitment in the bladder compared to levels in wild-type (WT) mice. Pharmacologic inhibition of mast cells reduced GBS burdens and histamine release in WT but not Camp-/- mice. Streptozotocin-induced diabetic mice had increased bladder cathelicidin production and mast cell recruitment at 24 h postinfection with GBS compared to levels in nondiabetic controls. We propose that cathelicidin is an important immune regulator but ineffective antimicrobial peptide against GBS in urine. Combined, our findings may in part explain the increased frequency of GBS UTI in diabetic and pregnant individuals.IMPORTANCE Certain populations such as diabetic individuals are at increased risk for developing urinary tract infections (UTI), although the underlying reasons for this susceptibility are not fully known. Additionally, diabetics are more likely to become infected with certain types of bacteria, such as group B Streptococcus (GBS). In this study, we find that an antimicrobial peptide called cathelicidin, which is thought to protect the bladder from infection, is ineffective in controlling GBS and alters the type of immune cells that migrate to the bladder during infection. Using a mouse model of diabetes, we observe that diabetic mice are more susceptible to GBS infection even though they also have more infiltrating immune cells and increased production of cathelicidin. Taken together, our findings identify this antimicrobial peptide as a potential contributor to increased susceptibility of diabetic individuals to GBS UTI.

Keywords: cathelicidin; group B Streptococcus; innate immunity; mast cell; urinary tract infection.


Figures

FIG 1
FIG 1
Susceptibility to cathelicidin is similar between UPEC and GBS clinical isolates. (A and B) MIC assays for COH1 and CFT073 using human LL-37 or murine CRAMP) in RPMI 1640 medium. (C) Killing kinetics of three GBS strains by 36 μg/ml (8 μM) LL-37 in RPMI 1640 medium over time. (D and E) MIC assays for COH1 and CFT073 using human LL-37 or murine CRAMP in synthetic urine. Symbols represent the means of independent experimental replicates (n = 3 to 5/group), with lines indicating means and SEM. (F) MIC values of GBS clinical isolates collected from urine, vagina, skin, or blood. Symbols represent the means of three independent experimental replicates (n = 6 to 16/group). Data were analyzed by Kruskal-Wallis with Dunn’s multiple-comparison test. RFU, relative fluorescence units.
FIG 2
FIG 2
GBS infection limits bladder epithelium cathelicidin production, and GBS proteases degrade cathelicidin. (A and B) Human bladder epithelial cells (HTB-9) were infected with GBS A909, COH1, or NCTC 10/84 or with GBS COH1 and UPEC CFT073, as indicated, for 4 h at an MOI of 10. LL-37 production was measured by ELISA. (C) HTB-9 cells were infected with GBS COH1 for 3 h at an MOI of 10 or 1. LL-37 mRNA transcripts were quantified by qPCR and normalized to the level of the housekeeping gene, GAPDH, using the ΔΔCT method. Symbols represent the means of independent experimental replicates (n = 3 to 6/group), with lines indicating medians and interquartile ranges. (D) GBS strains A909, COH1, and NCTC 10/84 were incubated with 9 μg/ml (2 μM) LL-37 for 4 h with or without addition of protease inhibitors (PI). Samples were spotted onto a nitrocellulose membrane and probed for LL-37. Densitometry was normalized to the signal from the 9-μg/ml LL-37 input. Raw images of dot blots are depicted in Fig. S1 in the supplemental material. (E) Susceptibility of GBS COH1 to 27 μg/ml (6 μM) LL-37 with or without protease inhibitors (PI) was measured over 4 h by serial dilution and plating. Symbols represent the means of three independent experiments, and lines indicate the mean values of experimental replicates. (F) MIC assay of GBS COH1 using human LL-37 in RPMI 1640 medium with (white bars) or without (gray bars) addition of protease inhibitors. Symbols represent the means of independent experimental replicates (n = 5/group), with lines indicating means and SEM. (G) Human bladder epithelial cells (HTB-9) were infected with GBS COH1 and UPEC CFT073 for 4 h at an MOI of 10 with or without addition of protease inhibitors. LL-37 production was measured by ELISA. Symbols represent the means of independent experimental replicates (n = 6 to 8/group), with lines indicating medians and interquartile ranges. Data were analyzed by Friedman’s test with Dunn’s multiple-comparison test (panels A to C), two-way repeated-measures ANOVA with Dunnett’s multiple-comparison test (panel E), or two-way ANOVA with Sidak’s multiple-comparison test (panels D and G). ****, P < 0.0001; **, P < 0.01; *, P < 0.05.
FIG 3
FIG 3
Cathelicidin deficiency reduces GBS burden in the bladder. (A) WT C57BL/6 female mice were transurethrally infected with 2 × 107 CFU of GBS COH1 or UPEC CFT073 or mock infected as a control. Bladders were collected at 24 h postinfection, and cathelicidin levels were quantified by ELISA. (B) WT C57BL/6 and Camp−/− female mice, as indicated, were transurethrally infected with 2 × 107 CFU of GBS COH1. Bladders and kidneys were collected at 24 h postinfection to determine GBS burdens. (C) WT C57BL/6 and Camp−/− mice were infected with GBS COH1 as described for panel B, with the inclusion of recombinant CRAMP treatment (320 μM) transurethrally 1 h prior to infection or mock treatment with PBS as a control. Bladders and kidneys were collected at 24 h postinfection to determine GBS burdens. (D) WT C57BL/6 and Camp−/− female mice were vaginally administered 2 × 107 CFU of GBS COH1. Mice were vaginally swabbed daily, and the levels of GBS CFU recovered from swabs are shown. (E) WT C57BL/6 and Camp−/− male mice were injected i.p. with 2 × 107 CFU of GBS COH1. Blood, spleen, and kidneys were collected at 24 h postinfection to determine GBS burdens. Experiments were conducted at least two times independently, and data were combined. Symbols represent biological replicates (n = 8 to 32/group), with lines indicating medians with interquartile ranges. Dotted lines indicate limits of detection for CFU. Data were analyzed using Kruskal-Wallis with Dunn’s multiple-comparison test (panel A) or two-way repeated measures ANOVA with Sidak’s multiple-comparison test (panels B to E). ****, P < 0.0001; **, P < 0.01; *, P < 0.05.
FIG 4
FIG 4
Cathelicidin deficiency alters bladder immune cell populations in response to GBS. WT C57BL/6 and Camp−/− female mice were transurethrally infected with 2 × 107 CFU of GBS COH1 or mock infected as a control. Bladders were collected at 24 h postinfection and analyzed via flow cytometry The gating strategy of CD45+ lymphocytes is described in Fig. S4 in the supplemental material. (A) Percentage of CD45+ cells staining for given surface markers. (B) Total counts of CD45+ cells from mouse bladders. (C) Total counts of cells from panel B which stained for given surface markers. Bladders were also subjected to histamine (D) and myeloperoxidase (MPO) ELISA (E). Experiments were conducted at least two times independently, and data were combined. Symbols represent biological replicates (n = 4 to 33/group), with lines indicating medians with interquartile ranges. Data were analyzed using two-way repeated-measures ANOVA with Tukey’s multiple-comparison test (panels A and C), Kruskal-Wallis with Dunn’s multiple-comparison test (panel B), and one-way ANOVA with Holm-Sidak’s multiple-comparison test (panels D and E). Significant differences are shown. All other comparisons are not significant (P > 0.05). ***, P < 0.001; **, P < 0.01; *, P < 0.05.
FIG 5
FIG 5
Mast cell inhibitor cromolyn sodium reduces GBS burden in the bladder. WT C57BL/6 and Camp−/− female mice were treated with the mast cell membrane stabilizer cromolyn sodium at 10 mg/kg/dose at 48 h, 24 h, and 1 h prior to transurethral infection with 2 × 107 CFU of GBS COH1. Mock-treated mice were used as controls. Bladder and kidneys were collected at 24 h postinfection to determine bacterial burdens (A). Bladders were also subjected to histamine (B) and myeloperoxidase (MPO) ELISA (C). Experiments were conducted at least two times independently, and data were combined. Symbols represent biological replicates (n = 10 to 18/group), with lines indicating medians with interquartile ranges. Data were analyzed using two-way repeated-measures ANOVA with Tukey’s multiple-comparison test (panel A) and one-way ANOVA with Tukey’s multiple-comparison test (panels B and C). ***, P < 0.001; **, P < 0.01; *, P < 0.05.
FIG 6
FIG 6
Streptozotocin-induced diabetes increases susceptibility to GBS UTI. WT CD1 female mice were treated with 4 doses of 80/mg/kg/dose streptozotocin (STZ) as described in Materials and Methods. Mock-treated mice were used as controls. At 3 weeks following treatment, mice were transurethrally infected with 2× 107 CFU of GBS COH1. (A) Body weights were collected weekly following STZ treatment. (B) Blood glucose at 24 h prior to infection. (C) Urine glucose collected at 24 h postinfection. (D) Urine, bladder, and kidneys were collected at 24 h postinfection to determine bacterial burdens. (E) Bladders collected at 24 h postinfection were analyzed via flow cytometry. The gating strategy is described in Fig. S4 in the supplemental material. (F) Bladder weights of mice at 24 h postinfection. Bladders were subjected to cathelicidin ELISA (G) and histamine ELISA (H). Experiments were conducted at least two times independently, and data were combined. Symbols represent biological replicates (n = 10 to 30/group), with lines indicating medians with interquartile ranges. Dotted lines indicate upper limits of detection for glucose meter (panels B and C) and lower limits of detection for CFU (panel D) or ELISA (panels G and H). Data were analyzed by two-way repeated-measures ANOVA with Sidak’s multiple-comparison test (panels A, D, and E) and a two-tailed Mann-Whitney test (panels B, C, and F to H). ****, P < 0.0001; ***, P < 0.001; **, P < 0.01; *, P < 0.05; n.s., not significant.
FIG 7
FIG 7
Impact of cromolyn sodium treatment and CRAMP deficiency in STZ-induced diabetic mice. WT CD1 female mice were treated with streptozotocin (STZ) and/or cromolyn sodium and infected with 2 × 107 CFU of GBS COH1 as described in Materials and Methods. (A) Bladder and kidneys were collected at 24 h postinfection to determine bacterial burdens. Bladders were subjected to cathelicidin ELISA (B) and histamine ELISA (C). (D) WT C57BL/6 and Camp−/− female mice were treated with STZ and infected with 2 × 107 CFU of GBS COH1 as described in Materials and Methods, with bladders collected 24 h postinfection. Mock-treated animals from the experiments shown in Fig. 3B are shown for comparison. Experiments were conducted one to two times independently, and data were combined where appropriate. Symbols represent biological replicates (n = 8 to 25/group), with lines indicating medians with interquartile ranges. Dotted lines indicate lower limits of detection for CFU (panels A and D) or ELISA (panels B and C). Data were analyzed using two-way repeated-measures ANOVA with Tukey’s multiple-comparison test (panel A) and one-way ANOVA with Tukey’s multiple-comparison test (panels B to D). *, P < 0.05; n.s., not significant.

References

    1. Tandogdu Z, Wagenlehner FM. 2016. Global epidemiology of urinary tract infections. Curr Opin Infect Dis 29:73–79. doi:10.1097/QCO.0000000000000228. - DOI - PubMed
    1. Griebling TL. 2005. Urologic diseases in America project: trends in resource use for urinary tract infections in women. J Urol 173:1281–1287. doi:10.1097/01.ju.0000155596.98780.82. - DOI - PubMed
    1. Nitzan O, Elias M, Chazan B, Saliba W. 2015. Urinary tract infections in patients with type 2 diabetes mellitus: review of prevalence, diagnosis, and management. Diabetes Metab Syndr Obes 8:129–136. doi:10.2147/DMSO.S51792. - DOI - PMC - PubMed
    1. Anderson BL, Simhan HN, Simons KM, Wiesenfeld HC. 2007. Untreated asymptomatic group B streptococcal bacteriuria early in pregnancy and chorioamnionitis at delivery. Am J Obstet Gynecol 196:524.e1–524.e5. doi:10.1016/j.ajog.2007.01.006. - DOI - PubMed
    1. Schneeberger C, Kazemier BM, Geerlings SE. 2014. Asymptomatic bacteriuria and urinary tract infections in special patient groups: women with diabetes mellitus and pregnant women. Curr Opin Infect Dis 27:108–114. doi:10.1097/QCO.0000000000000028. - DOI - PubMed

Publication types

MeSH terms

Substances