. 2020 Apr 28;117(17):9554-9565.
doi: 10.1073/pnas.2000671117. Epub 2020 Apr 22.

The microcircuits of striatum in silico

Affiliations

The microcircuits of striatum in silico

J J Johannes Hjorth et al. Proc Natl Acad Sci U S A. .

Abstract

The basal ganglia play an important role in decision making and selection of action primarily based on input from cortex, thalamus, and the dopamine system. Their main input structure, striatum, is central to this process. It consists of two types of projection neurons, together representing 95% of the neurons, and 5% of interneurons, among which are the cholinergic, fast-spiking, and low threshold-spiking subtypes. The membrane properties, soma-dendritic shape, and intrastriatal and extrastriatal synaptic interactions of these neurons are quite well described in the mouse, and therefore they can be simulated in sufficient detail to capture their intrinsic properties, as well as the connectivity. We focus on simulation at the striatal cellular/microcircuit level, in which the molecular/subcellular and systems levels meet. We present a nearly full-scale model of the mouse striatum using available data on synaptic connectivity, cellular morphology, and electrophysiological properties to create a microcircuit mimicking the real network. A striatal volume is populated with reconstructed neuronal morphologies with appropriate cell densities, and then we connect neurons together based on appositions between neurites as possible synapses and constrain them further with available connectivity data. Moreover, we simulate a subset of the striatum involving 10,000 neurons, with input from cortex, thalamus, and the dopamine system, as a proof of principle. Simulation at this biological scale should serve as an invaluable tool to understand the mode of operation of this complex structure. This platform will be updated with new data and expanded to simulate the entire striatum.

Keywords: basal ganglia; compartmental models; computational analysis; modeling; network.


Conflict of interest statement

The authors declare no competing interest.

Figures

Fig. 1.
Fig. 1.
Organization of the striatal microcircuit and the neuronal subtypes. (A) Dorsal view of the mouse brain showing the basal ganglia subnuclei. The dorsal striatum (dSTR), globus pallidus external and internal segment (GPe and GPi, respectively), subthalamic nucleus (STN), substantia nigra pars reticulata and pars compacta (SNr and SNc, respectively) are shown in relative sizes. The color coding is as indicated. (B1) The principal cells of the striatum are the striatal projection neurons (SPNs). They account for about 95% of all striatal neurons and form two approximately equal pools of cells that differ by their projection targets and belong to the direct and indirect pathways, dSPN and iSPN, respectively. (B2) The interneurons include cholinergic and GABAergic interneurons (INs) (6). By unbiased counts available for the mouse of the total number of neostriatal neurons, the parvalbumin-expressing fast-spiking (FS) cells make up 1.3%, NPY/SOM+ low-threshold spiking (LTS) interneurons 0.8%, calretinin-positive cells (CR) around 0.5% in rodents, tyrosine hydroxylase-positive interneurons (THINs) 0.3%, NPY/SOM neurogliaform (NGF) cells 0.2% and cholinergic interneurons (ChINs) 1.1%. (C) Schematic connectivity within dSTR involving dSPN, iSPN, FS, LTS, and ChIN. Connection probabilities within and between neuronal subtypes are shown by respective arrows; numbers in red correspond to connection probabilities for a somatic pair at a distance of 50 μm, while numbers in blue correspond to 100 μm.
Fig. 2.
Fig. 2.
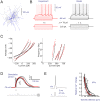
The direct pathway striatal projection neuron (dSPN) expressing dopamine D1 receptors. (A) Neurolucida reconstruction of a single dSPN with dendrites (blue) and axon collaterals (gray). Black dot marks the soma. (B) Sub- and suprathreshold responses to current injections for a model neuron (black) and the corresponding experimental data (red). An example model fit to experimental data, with the current protocol used; holding current 203 pA to keep the baseline membrane potential around −86 mV. (C) Population behavior for models and experiment: voltage–current and frequency–current relations shown for four dSPNs optimized to corresponding data. (D) Somatic potential response to spatiotemporal clustered synaptic input, demonstrating the model’s ability to trigger NMDA-dependent plateau potentials. The dots in the middle give the mean midpoint (half duration, half amplitude) of the plateaus triggered at a somatic distance of 90 to 120 μm. Experimental data (red) digitized from ref. . (E) Normalized change in calcium concentration in response to a backpropagating action potential (triggered with a short duration 2-ms high amplitude 2.5-nA current injection). Experimental data are extracted from ref. . Model data are in black, experimental data in red.
Fig. 3.
Fig. 3.
Model of fast-spiking (FS) interneuron fitted to the recordings from the dorsolateral striatum. (A) Neurolucida reconstruction of a single FS (number of reconstructions, n = 4) with dendrites (blue) and axon collaterals (gray). Black dot marks the soma. (B) Somatic response to square-pulse current injections for the duration of 1 s with increment of 40 pA in a recorded cell (red) and corresponding model (black). Holding current of 229 pA provides the baseline voltage around −87 mV. (C) Fit of the models to the recorded parvalbumin-positive cells (n = 4), subthreshold voltage–current relation (Left), and suprathreshold frequency–current response (Right). Model data are in black, experimental data in red.
Fig. 4.
Fig. 4.
Low-threshold spiking (LTS) interneuron. (A) Neurolucida reconstruction of a single LTS with dendrites (blue), axon collaterals (red) and soma (black). (Scale bar, 100 μm.) (B and D) Response to somatic hyperpolarizing and depolarizing current injections in a recorded cell (red) and corresponding model neuron (black). (C) Set of nine experiments performed on the same cell (red dots) emphasize the high membrane potential variability in response to similar current amplitude (the difference in the current injection is in the order of a few hundredths of picoampères). Model data are in black, experimental data in red.
Fig. 5.
Fig. 5.
Cholinergic interneuron (ChIN) model. (A) Neurolucida reconstruction of a cholinergic interneuron with dendrites (blue), axon collaterals (red), and soma (black). (Scale bar, 100 μm.) (B) Intravenous protocol in experiment (red) and model (black). (C) Hyperpolarizing current injection to illustrate the rebound behavior in the model. (D) Responses to suprathreshold current injection in the model (black) and the experiment (red). (E) Injected depolarizing current of 100 pA for 300 ms during activity, to illustrate the pause response in the ChIN model.
Fig. 6.
Fig. 6.
Dopamine modulation of simulated striatal cells. (A) Representative traces of simulated cells (dSPNs, iSPNs, FS, LTS, and ChINs) are shown under control conditions (black) and during simulated bath application of dopamine (gray traces). The response to a depolarizing current pulse is shown for each cell type before and after dopamine. For ChINs, the time to spike following a burst-pause protocol is used to quantify the modulation and for LTS dopamine-induced depolarization from −60 mV is used. For the other cell types, spike counts following a step depolarizing current is used (four protocols per model and four models per cell type). For LTS, dopamine is present only during a certain time period (see bar), whereas for all other simulations, dopamine is present throughout the simulation. (B) Population data for each type of neuron shown together with comparisons against experimental data for control conditions and with dopamine (42, 110). Insets show relative activity.
Fig. 7.
Fig. 7.
Synapse placement using touch detection algorithm. (A) Striatal three-dimensional (3D) mesh in gray, the touch detection is parallelized, and each process handles a subset of the space, here shown as a cube (hypervoxel, see Materials and Methods). (B) The somas of all of the neurons within the hypervoxel, ∼2,174 neurons. (C) Axonal and dendritic arborization of the 2,174 neurons. (D) Touch detection of two neurons using 3-μm voxel resolution. Synapses are shown in red.
Fig. 8.
Fig. 8.
Statistics of connections projecting to dSPN in the striatal microcircuitry. Connections shown for (i) dSPN–dSPN, (ii) iSPN–dSPN, (iii) FS–dSPN, (iv) LTS–dSPN, and (v) ChIN–dSPN. (A) Pairwise connection probability for the different neuron types projecting to dSPN. Black curve corresponds to the simulated network and gray region shows the Wilson score (111) for the model. Red line shows experimental data with error bars showing the Wilson score, and the line length indicates spread of lateral distance between connected neuron pairs. Experimental measurements were made for neuron pairs within 50-μm distance (A, iiii) in ref. , 100-μm distance (A, iiii) in ref. , 250-μm distance (A, iii and iv) in ref. , and 250-μm distance (A, v) in ref. . (B) Distribution of number of synapses between individual connected neuron pairs. The pairs are indicated above each graph in i–v. (C) Distribution of number of connected neurons for each type of presynaptic neuron. The connectivity between presynaptic to postsynaptic neuron is indicated above each graph in iv. Here we show statistics for neurons in the center of the volume to avoid edge effects. Note that the bimodal distribution seen here is a consequence of only using a limited number of morphologies for dSPN and iSPN. Preliminary modeling shows that adding a larger number of reconstructions creates a unimodal distribution; however, currently we only have optimized models for the morphology of four dSPNs. Future versions will include more reconstructions. (C, i and ii) The black line shows the distribution obtained for a larger set of reconstructions (n = 100,000) using a jitter to promote morphological variability (see also SI Appendix, Fig. S4). (D, iiii) Response in a dSPN when a presynaptic (i) dSPN, (ii) iSPN, and (iii) FS is activated. Blue dots mark peaks of postsynaptic potentials. (Insets) Mean and SD for model peaks (blue) and experimental data (red) from Planert et al. (43). (i and ii) With a chloride reversal potential of −40 mV and (iii) from Straub et al. (90) with a chloride reversal of 0 mV. (iv) Response in dSPN when LTS neurons are activated. Model peaks are marked with a blue dot, experimental peaks (90) marked with red dots (Inset). (v) Cumulative distribution of synapses on the dendrites as a function of the distance from the soma. Connection statistics for other neuron pairs are shown in SI Appendix.
Fig. 9.
Fig. 9.
Fitting SPN synaptic dynamics. The Tsodyks–Markram model was fitted using a single compartment. (A) Example response traces of optogenetic activation of cortical and thalamic input (100). Black trace is model; red trace is experimental data. Protocol includes eight pulses at 20 Hz followed by a recovery pulse. (Scale bars, 1 mV and 100 ms.) (B) Synaptic connections between dSPN and dSPN, iSPN and FS. Black line is model; orange line is surrogate data (Materials and Methods). See SI Appendix, Figs. S8 and S9 for additional examples on intrastriatal and extrastriatal synaptic inputs.
Fig. 10.
Fig. 10.
Network simulation of 10,000 neurons. (A) The activity of the network is shown in the form of a raster plot (Bottom) and spike histogram (Top). (B) Example traces of each cell type in the network are shown. The network is driven with cortical and thalamic input and modulated by dopamine, as indicated at the Top of the figure and the shaded areas (in A and B, respectively). The three inputs represent 1) baseline activation of cortical and thalamic input (thal+crtx baseline), 2) a cortical command signal (crtx cmd), during which the cortical activation is increased (given to all cells except the ChINs), and 3) a dopaminergic modulation signal that acts on conductances in accordance with Fig. 6, SI Appendix, Tables S7–S10, and Lindroos et al. (106).

Similar articles

Cited by

References

    1. Graybiel A. M., The basal ganglia: Learning new tricks and loving it. Curr. Opin. Neurobiol. 15, 638–644 (2005). - PubMed
    1. Graybiel A. M., Habits, rituals, and the evaluative brain. Annu. Rev. Neurosci. 31, 359–387 (2008). - PubMed
    1. Klaus A., Alves da Silva J., Costa R. M., What, if, and when to move: Basal ganglia circuits and self-paced action initiation. Annu. Rev. Neurosci. 42, 459–483 (2019). - PubMed
    1. Arber S., Costa R. M., Connecting neuronal circuits for movement. Science 360, 1403–1404 (2018). - PubMed
    1. Oorschot D. E., Total number of neurons in the neostriatal, pallidal, subthalamic, and substantia nigral nuclei of the rat basal ganglia: A stereological study using the cavalieri and optical disector methods. J. Comp. Neurol. 366, 580–599 (1996). - PubMed

Publication types

LinkOut - more resources