. 2020 May 5;117(18):10067-10078.
doi: 10.1073/pnas.1916641117. Epub 2020 Apr 22.

Single-cell O2 exchange imaging shows that cytoplasmic diffusion is a dominant barrier to efficient gas transport in red blood cells

Affiliations

Single-cell O2 exchange imaging shows that cytoplasmic diffusion is a dominant barrier to efficient gas transport in red blood cells

Sarah L Richardson et al. Proc Natl Acad Sci U S A. .

Abstract

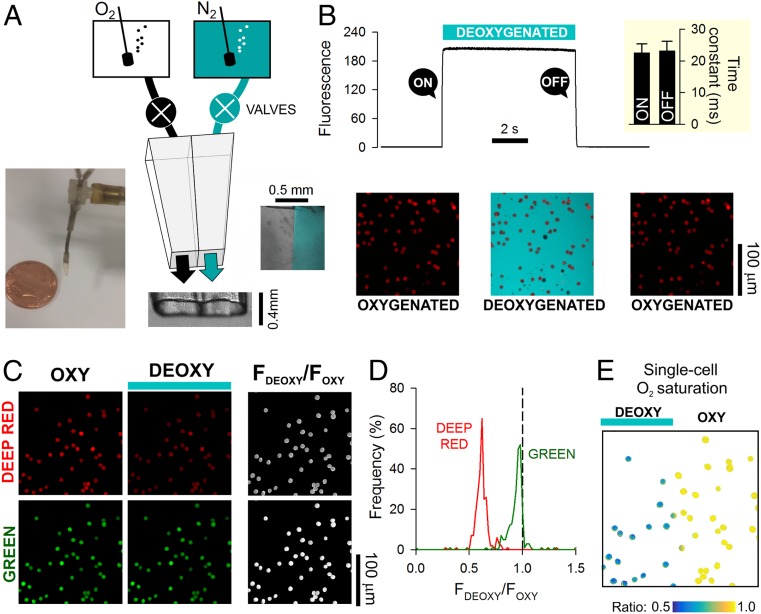
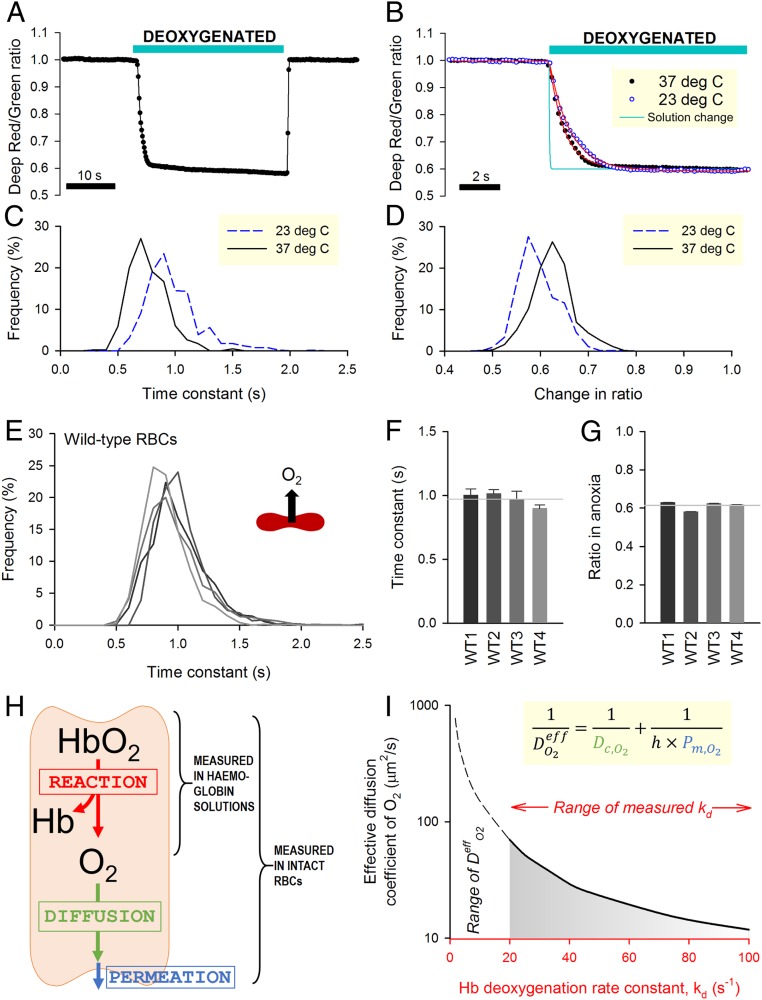
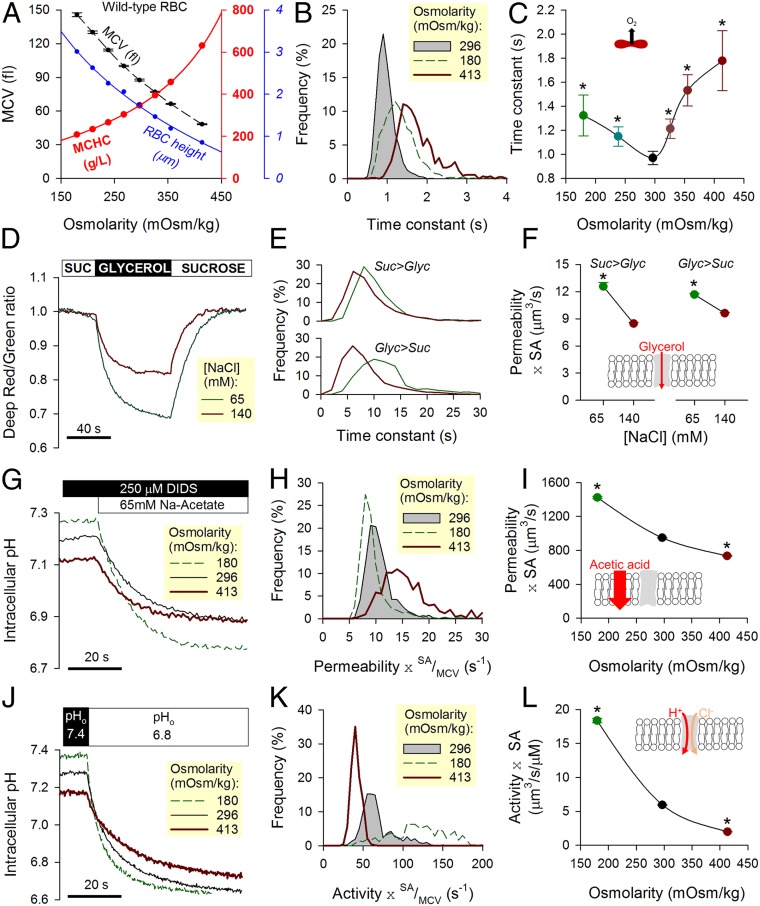
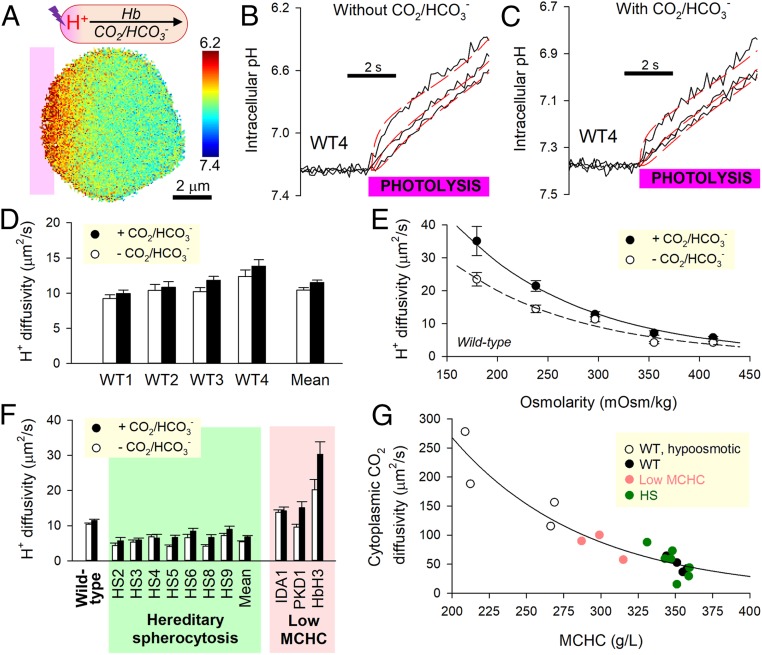
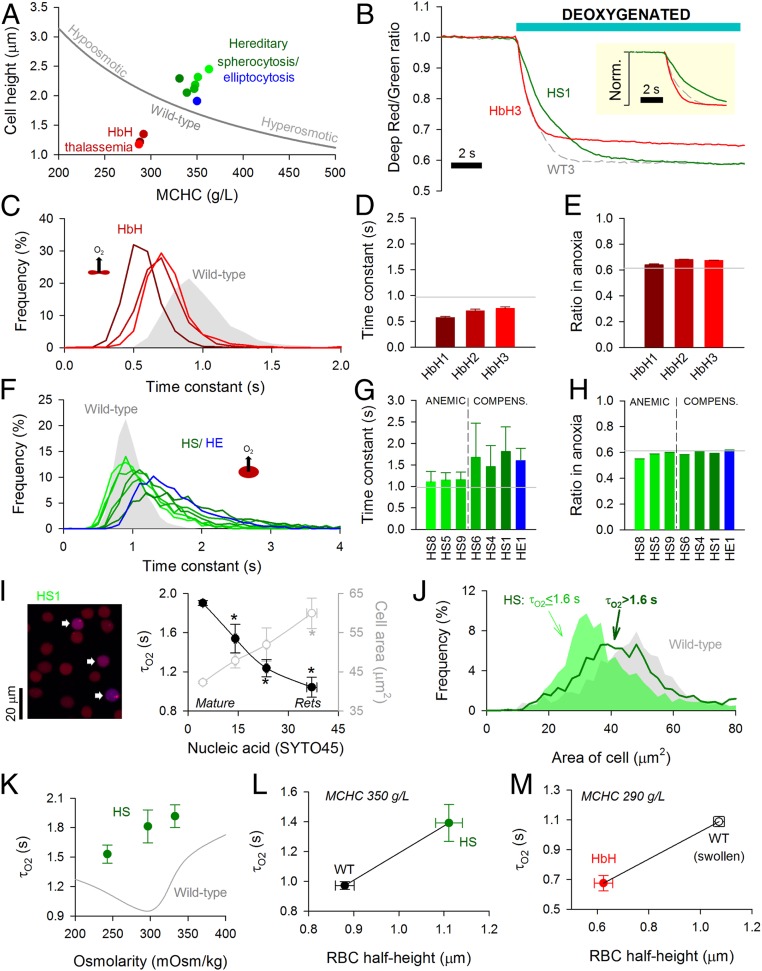
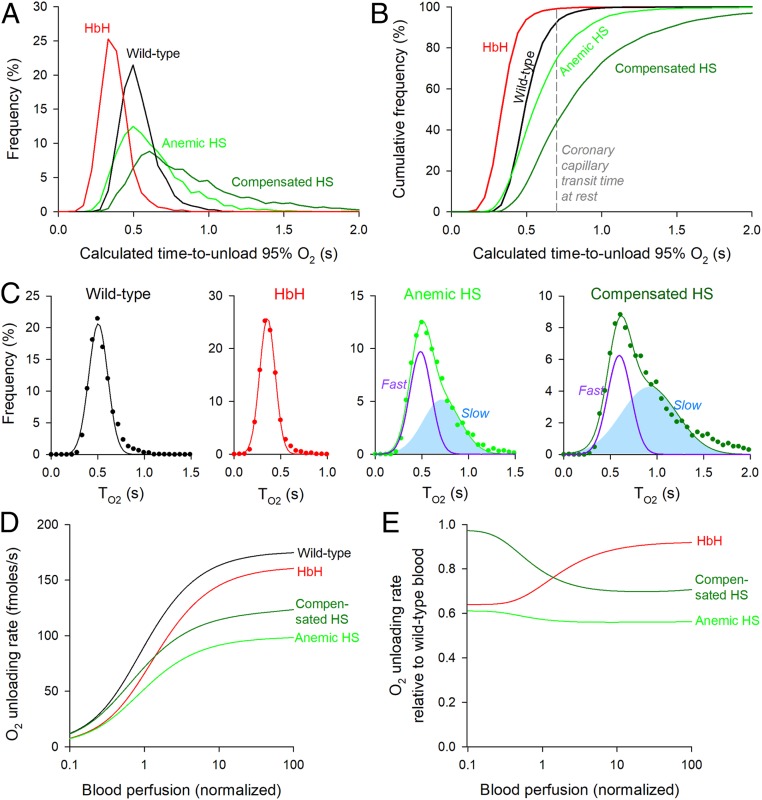
Disorders of oxygen transport are commonly attributed to inadequate carrying capacity (anemia) but may also relate to inefficient gas exchange by red blood cells (RBCs), a process that is poorly characterized yet assumed to be rapid. Without direct measurements of gas exchange at the single-cell level, the barriers to O2 transport and their relationship with hematological disorders remain ill defined. We developed a method to track the flow of O2 in individual RBCs by combining ultrarapid solution switching (to manipulate gas tension) with single-cell O2 saturation fluorescence microscopy. O2 unloading from RBCs was considerably slower than previously estimated in acellular hemoglobin solutions, indicating the presence of diffusional barriers in intact cells. Rate-limiting diffusion across cytoplasm was demonstrated by osmotically induced changes to hemoglobin concentration (i.e., diffusive tortuosity) and cell size (i.e., diffusion pathlength) and by comparing wild-type cells with hemoglobin H (HbH) thalassemia (shorter pathlength and reduced tortuosity) and hereditary spherocytosis (HS; expanded pathlength). Analysis of the distribution of O2 unloading rates in HS RBCs identified a subpopulation of spherocytes with greatly impaired gas exchange. Tortuosity imposed by hemoglobin was verified by demonstrating restricted diffusivity of CO2, an acidic gas, from the dissipative spread of photolytically uncaged H+ ions across cytoplasm. Our findings indicate that cytoplasmic diffusion, determined by pathlength and tortuosity, is a major barrier to efficient gas handling by RBCs. Consequently, changes in RBC shape and hemoglobin concentration, which are common manifestations of hematological disorders, can have hitherto unrecognized and clinically significant implications on gas exchange.

Keywords: diffusion; erythrocyte; fluorescence; gas channels; oxygen.


Conflict of interest statement

The authors declare no competing interest.

Figures

Fig. 1.
Fig. 1.
Measuring O2 exchange in RBCs using single-cell O2-saturating imaging. (A) Schematic of a dual microperfusion device loaded with oxygenated and deoxygenated solutions. Inset shows both microstreams released in parallel, one of which was labeled with 30 µM fluorescein. When flows are calibrated and balanced, microstreams become clearly separated. (B) Ultrarapid switching between the microstreams. Hypoxic microstream was labeled with 30 µM fluorescein. Rate of solution switching can be estimated from the fluorescence signal surrounding RBCs (wild type) loaded with CellTracker Deep-Red. Switching between solutions can be achieved with a time constant of 23 ms (Inset; n = 5). (C) Wild-type RBCs loaded with a mixture of Deep-Red and Green, showing fluorescence in oxygenated and deoxygenated microstreams. For these experiments, neither solution was fluorescently labeled. Grayscale ratio maps (Right) were calculated from these fluorescence maps (Left and Center). (D) On deoxygenation, Deep-Red fluorescence is reduced, whereas Green remains constant (wild-type RBCs; n = 356 cells). (E) Illustration of the method’s ability to resolve differences in O2 saturation. The field of view was split into oxygenated and deoxygenated halves by releasing both microstreams in parallel; only cells in the deoxygenated compartment showed a decrease in Deep-Red/Green ratio.
Fig. 2.
Fig. 2.
Measuring O2 exchange with single-cell resolution in wild-type (WT) RBCs. (A) Time course of O2 saturation during a 30-s exposure to deoxygenated solution (averaged for 10 cells within a single field of view). (B) Detail of unloading kinetics superimposed on the time course of solution exchange (Fig. 1B). Red lines are best-fit monoexponential curves. (C) Frequency histogram of the time constant of O2 unloading (τO2) and (D) overall change of fluorescence ratio measured at either 23 °C or 37 °C. (E) Histogram of τO2 in WT RBCs from four donors (WT1 to WT4) determined at 23 °C. (F) Mean ± variance for τO2 and (G) overall fluorescence ratio response (n = 702, 738, 1,489, 751). Gray lines show means for WT1 to WT4. (H) Schematic of the diffusion–reaction system that describes O2 unloading from RBCs. (I) Graphical solution to the diffusion–reaction equation shows the combinations of effective O2 diffusivity (DeffO2) and Hb–O2 dissociation rate constant (kd) that fit τO2 data for WT RBCs (0.971 s). Inset shows the equation that defines DeffO2 in terms of membrane permeation (Pm,O2), mean diffusion distance (h), and cytoplasmic diffusivity (Dc,O2). Simulation for WT RBC: h = 0.885 µm (half-thickness of RBC). Considering the experimentally derived range of kd (20 to 100 s−1), DeffO2 is <70 µm2/s.
Fig. 3.
Fig. 3.
Effect of osmotic manipulations on transport properties in wild-type (WT) RBCs. (A) Changes in osmolarity brought about by adding or removing superfusate NaCl affect MCV, MCHC, and cell height (ratio of MCV to cell area). Mean ± SEM. (B) Both hypo- and hyperosmotic conditions slow the process of O2 unloading, which is quantified in terms of time constant τO2. (C) Biphasic relationship between osmolarity and τO2, with a nadir at physiological osmolarity. Mean ± variance (n = 3,688, 1,002, 3,680, 1,609, 895, and 841 from WT3 and WT4). (D) Deep-Red/Green ratio response to reversible cell swelling triggered by aquaporin-mediated glycerol influx under constant tonicity (100 mM glycerol replacing 100 mM sucrose). Experiments were performed under hypo- (+65 mM NaCl) and hypertonic (+140 mM NaCl) conditions. (E) Time constant of fluorescence ratio changes in response to glycerol influx (Upper) and efflux (Lower). (F) Glycerol permeability increases under hypotonic conditions. Mean ± SEM (n = 511 and 1,030 from WT3 and WT4). Equilibrium MCVs were 79 fL in 140 mM NaCl + 100 mM sucrose, 86 fL in 140 mM NaCl + 100 mM glycerol, 123 fL in 65 mM NaCl + 100 mM sucrose, and 148 fL in 65 mM NaCl + 100 mM glycerol. (G) pHi imaged in cSNARF1-loaded RBCs during a protocol that measures permeability to acetic acid. Cells were rapidly exposed to Na-acetate (65 mM) in the presence of DIDS (250 µM) to block AE1 activity. The rate of pHi change is a readout of acetic acid entry, which was measured over a range of osmolarity. (H) Hypo- and hyperosmotic conditions modestly affect membrane permeability to acetic acid. (I) A decrease in osmolarity modestly increases the product of acetic acid permeability and SA. Mean ± SEM (n = 930, 1,658, 1,500 from WT3 and WT4). (J) pHi imaged in cSNARF1-loaded RBCs during a protocol that measures AE1 activity. Extracellular pH was rapidly dropped from 7.4 to 6.8, and the rate of pHi change provides a readout of Cl/OH exchange, which was probed over a range of osmolarity. (K) Hypo- and hyperosmotic conditions affect AE1 activity. (L) A decrease in osmolarity increases the product of AE1 activity coefficient and SA. Mean ± SEM (n = 426, 730, 662 from WT3 and WT4). *Significant difference to physiological osmolarity.
Fig. 4.
Fig. 4.
Measuring CO2 diffusivity in RBC cytoplasm. (A) Photolytic uncaging of H+ ions from NVA at one end of a wild-type (WT) RBC produces an acidic microdomain that dissipates diffusively across cytoplasm, facilitated by Hb and (if added) CO2/HCO3 buffer. (B) Measurements in the absence of CO2/HCO3; time course of pHi (black trace) in 10 equally spaced ROIs across the width of a WT RBC. Traces for ROIs 1, 4, and 7 are shown for clarity. Best fit (red) to diffusion model for deriving H+ diffusivity, DHapp. (C) Protocol performed under superfusion with CO2/HCO3. (D) Summary data from four WT samples (n = 226 WT cells). (E) Relationship between osmolarity (varied by adding or removing NaCl) and DHapp in WT RBCs (n = 30 to 50 per bar). (F) Summary data from HS blood and three samples of reduced MCHC: iron deficiency (IDA1), puryvate kinase deficiency (PKD1), and HbH thalassemia (HbH3). Mean ± SEM (n = 20 to 35). (G) Relationship between MCHC and cytoplasmic CO2 diffusivity calculated from DHapp measured in the presence and absence of CO2/HCO3.
Fig. 5.
Fig. 5.
Disorders of RBC shape, size, and Hb affect O2 unloading. (A) Relationship between MCHC and cell height (thickness) for wild-type (WT) RBCs under various conditions of osmolarity (gray line) compared with data for HbH thalassemia (red), HS (green), and HE (blue). (B) Exemplar time course of O2 unloading in HbH, HS, and WT RBCs. (Inset) Traces normalized. (C) Frequency distribution of O2 unloading time constant (τO2) for HbH blood. (D) Mean ± variance for τO2 and (E) overall fluorescence ratio response in HbH RBCs (n = 968, 654, 1,152). Gray lines show mean for WT1 to WT4. (F) Frequency distribution of τO2 for HS and HE blood. (G) Mean ± variance for τO2 and (H) overall fluorescence ratio response (n = 834 to 1,811) for samples obtained from anemic and compensated HS patients and the compensated HE patient. Gray lines show mean for WT1 to WT4. (I) Blood from patient HS1. Cells were loaded with Deep-Red and Green (to measure O2 saturation) and SYTO45 (to stain nucleic acids). Overlay of Deep-Red and SYTO45 fluorescence (excited at 633 and 458 nm, respectively). Cells with high SYTO45 fluorescence and O2-sensitive Deep-Red/Green ratio are identified as reticulocytes (arrows). Measurements of τO2 and cell area (in the horizontal plane) related to SYTO45 fluorescence. Mean ± SEM (n = 1,656, 52, 23, 12). Reticulocytes (Rets) manifest the fastest O2 unloading rates. * denotes significant difference to cells with lowest SYTO45 signal (P < 0.05). (J) Distribution of cell area measured in the horizontal plane for HS RBCs from all six patients studied gated by τO2. (K) Relationship between osmolarity and τO2 for HS blood. Mean ± variance (n = 1,811, 1,267, 980). (L) Relationship between cell half-height and τO2 for WT and HS matched for comparable MCHC. (M) Relationship between cell half-height and τO2 for HbH and WT RBCs that have been hypoosmotically swollen to match the hypochromia in HbH (NaCl reduced by 25 mM).
Fig. 6.
Fig. 6.
Physiological consequences of slow gas diffusion in RBC cytoplasm. (A) Frequency histogram of the time to unload 95% O2 (T95) from wild-type, HS, and HbH RBCs after correcting for temperature and CO2. (B) Cumulative frequency distribution. The dashed line denotes typical coronary capillary transit time. (C) Analysis of the frequency distribution with mixed Gaussian modeling for wild-type, HbH, anemic, and compensated HS RBCs. Note that, for HS blood, the best fit required two Gaussian curves (fast and slow subpopulations). (D) Mathematical simulation of the rate of O2 unloading from wild-type, HbH, and HS blood over a range of perfusion rates. (E) O2 unloading from HbH and HS blood relative to wild-type blood.

Similar articles

Cited by

References

    1. Wagner P. D., Diffusion and chemical reaction in pulmonary gas exchange. Physiol. Rev. 57, 257–312 (1977). - PubMed
    1. Boron W. F., Endeward V., Gros G., Musa-Aziz R., Pohl P., Intrinsic CO2 permeability of cell membranes and potential biological relevance of CO2 channels. ChemPhysChem 12, 1017–1019 (2011). - PubMed
    1. Chakraborty S., Balakotaiah V., Bidani A., Diffusing capacity reexamined: Relative roles of diffusion and chemical reaction in red cell uptake of O2, CO, CO2, and NO. J. Appl. Physiol. 97, 2284–2302 (2004). - PubMed
    1. Geers C., Gros G., Carbon dioxide transport and carbonic anhydrase in blood and muscle. Physiol. Rev. 80, 681–715 (2000). - PubMed
    1. Gros G., Moll W., The diffusion of carbon dioxide in erythrocytes and hemoglobin solutions. Pflugers Arch. 324, 249–266 (1971). - PubMed

Publication types