. 2020 May 5;117(18):9896-9905.
doi: 10.1073/pnas.1919702117. Epub 2020 Apr 22.

Matrix mechanotransduction mediated by thrombospondin-1/integrin/YAP in the vascular remodeling

Affiliations

Matrix mechanotransduction mediated by thrombospondin-1/integrin/YAP in the vascular remodeling

Yoshito Yamashiro et al. Proc Natl Acad Sci U S A. .

Abstract

The extracellular matrix (ECM) initiates mechanical cues that activate intracellular signaling through matrix-cell interactions. In blood vessels, additional mechanical cues derived from the pulsatile blood flow and pressure play a pivotal role in homeostasis and disease development. Currently, the nature of the cues from the ECM and their interaction with the mechanical microenvironment in large blood vessels to maintain the integrity of the vessel wall are not fully understood. Here, we identified the matricellular protein thrombospondin-1 (Thbs1) as an extracellular mediator of matrix mechanotransduction that acts via integrin αvβ1 to establish focal adhesions and promotes nuclear shuttling of Yes-associated protein (YAP) in response to high strain of cyclic stretch. Thbs1-mediated YAP activation depends on the small GTPase Rap2 and Hippo pathway and is not influenced by alteration of actin fibers. Deletion of Thbs1 in mice inhibited Thbs1/integrin β1/YAP signaling, leading to maladaptive remodeling of the aorta in response to pressure overload and inhibition of neointima formation upon carotid artery ligation, exerting context-dependent effects on the vessel wall. We thus propose a mechanism of matrix mechanotransduction centered on Thbs1, connecting mechanical stimuli to YAP signaling during vascular remodeling in vivo.

Keywords: YAP; extracellular matrix (ECM); mechanotransduction; thrombospondin-1; vessel remodeling.


Conflict of interest statement

The authors declare no competing interest.

Figures

Fig. 1.
Fig. 1.
Comprehensive secretome analysis of smooth muscle cells under cyclic stretch. (A) Volcano plots of protein secretion between the two conditions: 1) stretch vs. static, 2) stretch vs. stretch+BFA, and 3) stretch+BFA vs. static. BFA (1 μM) was used to inhibit secretion. The P values in the unpaired Student’s t test were calculated and plotted against the fold change for all identified proteins. Each dot represents mean values (n = 3). (B) Heat map of secreted proteins induced by cyclic stretch. A list of all of the proteins is provided in SI Appendix, Fig. S2. (C) Functional enrichment analysis of 87 proteins, the negative log10 of the P value. The top enriched GO terms associated with molecular function (orange), biological process (green), and reactome pathway analysis (blue) are shown. (D) Biological network using IPA. Diagrams show the direct (solid lines) and indirect (dashed lines) interactions among proteins reported in blood vessel development (Top) and ECM and cell adhesion (Bottom). (E) Western blot for Thbs1 from CM of rat vascular SMCs in static and stretch (1 Hz, 20% strain, 20 h) with or without BFA (n = 3). The entire image of silver staining is provided in SI Appendix, Fig. S1A.
Fig. 2.
Fig. 2.
Thbs1 localizes to FAs and binds integrin αvβ1 under cyclic stretch. (A) Cyclic stretch alters localization of Thbs1 (n = 5). Representative immunostaining with phalloidin (red), Thbs1 (green), and DAPI (blue). (B) Representative image of immunostaining showing Thbs1 colocalization with p-paxillin under cyclic stretch (n = 5). Immunostained with p-paxillin (red), Thbs1 (green), and DAPI (blue). (C) Immunostaining showing Thbs1 localization at FAs in confluent conditions (n = 3). Immunostained with p-paxillin (red), Thbs1 (green), phalloidin (gray), and DAPI (blue). (D) Cartoon shows various binding domains of Thbs1 and its receptors. (E) Representative immunostaining of Thbs1 showing colocalization with integrins αv and β1 (white arrows) but not with integrin β3, CD47, or CD36 under cyclic stretch (n = 5). Immunostained for indicated antibodies (red), Thbs1 (green), and DAPI (blue). (F) Quantification of colocalization of Thbs1 with molecules shown in E using Imaris colocalization software. Bars are mean ± SEM. ***P < 0.001, two-way ANOVA. NS: not significant. (G) Immunoprecipitation (IP) with anti-Thbs1 or control immunoglobulin G (IgG) followed by Western blotting for integrins αv and β1 (n = 2). Coomassie Brilliant Blue (CBB) shows the heavy chain of IgG in IP lysates. IB: immunoblot. (H) PLA shows the clusters of Thbs1/integrin αv or Thbs1/integrin β1 (red dots; white arrowheads). Bottom shows highly magnified images of the white dashed box in Top. DAPI (blue) and phalloidin (green) are shown. In all experiments, rat vascular SMCs were subjected to cyclic stretch (1.0 Hz, 20% strain for 20 h in A, C, and E or 8 h in G and H). In A, C, E, and H, 80 to 100 cells were evaluated in each immunostaining. Two-way arrows indicate stretch directions. (Scale bars, 50 μm.)
Fig. 3.
Fig. 3.
Deletion of Thbs1 affects maturation of focal adhesion and cell stiffness. (A) Wild-type cells with or without 1 μM of BFA or Thbs1KO cells were subjected to cyclic stretch (1.0 Hz, 20% strain, 8 h). Two-way arrows indicate the stretch direction. (Scale bars, 50 μm.) Phalloidin (red) is also shown. (B and C) The orientation of each cell was analyzed by measuring the orientation angle (θ) of the long axis (yellow bars in A) of the ellipse relative to the stretch axis (n = 3). (D) Thbs1KO cells show reduced FA formation. Immunostaining with p-paxillin (red), integrin αv (red), integrin β1 (red), Thbs1 (green), and DAPI (blue) (n = 3). Phalloidin (red) is also shown. White arrows indicate colocalization with Thbs1. Two-way arrows indicate stretch direction. (Scale bars, 50 μm.) (E) Representative immunostaining of CTRL or Thbs1KO cells with vinculin (red) in static or stretch condition. GFP-GRP1-PH (green) and DAPI (blue) are also shown. White arrows show vinculin deposition onto the tip of actin fibers (n = 3). Two-way arrows indicate stretch direction. (Scale bars, 50 μm.) (F) Immunostaining of CTRL or Thbs1KO cells with vinculin (green) and phalloidin (red). Rat vascular SMCs were subjected to cyclic stretch (1.0Hz, 20% strain for 8 h). Two-way arrows indicate stretch direction. (Scale bars, 25 μm.) Arrow heads (purple) show vinculin deposition onto the tip of actin fibers. (G) Young’s modulus of actin fibers in CTRL (n = 129) or Thbs1KO (n = 86) cells measured using atomic force microscopy. Representative topographic images and stiffness maps are shown. (H) Cell height and Young’s modulus are shown. Bars are means ± SEM. ***P < 0.001, unpaired t test. NS: not significant.
Fig. 4.
Fig. 4.
Thbs1 mediates nuclear shuttling of YAP via integrin αvβ1 in a Rap2-dependent manner. (A) Representative immunostaining of CTRL or Thbs1KO cells in the static or stretch condition with YAP (green). Phalloidin (red) and DAPI (blue) are also shown. Two-way arrows indicate stretch direction. (Scale bars, 50 μm.) Quantification of YAP localization is shown on the Right. In each experiment 150 to 200 cells were evaluated (n = 3). YAP localization in the nucleus (green) or cytoplasm (red) is shown. (B) Thbs1KO cells treated with (+) or without (−) recombinant human THBS1 (rhTHBS1; 1 μg/mL) following 24 h of serum starvation, then subjected to uniaxial cyclic stretch (20% strain; 1 Hz) for 8 h. Representative immunostaining with YAP (green) and DAPI (blue). (Scale bars, 50 μm.) Quantification of YAP localization is shown on the Right. In each experiment 80 to 120 cells were evaluated (n = 3). (C) Western blot shows Thbs1, p-YAP, and p-LATS levels in CTRL and Thbs1KO cells in the static or stretch condition (n = 3). Quantification graphs are shown on the Right. Bars are means ± SEM. **P < 0.01, ***P < 0.001, one-way ANOVA. (D) Pull down of GTP-bound Rap2 from CTRL and Thbs1KO cells in static and stretch conditions using Ral-GDS-RBD agarose beads (n = 2). (E) Overexpression of Myc-Rap2A(WT), constitutively active Myc-Rap2A(G12V), or dominant-negative Myc-Rap2A(S17N) in CTRL and Thbs1KO cells in the static or stretch condition (n = 3). Representative immunostaining with Myc (red), YAP (green), and DAPI (blue). Two-way arrows indicate stretch direction. (Scale bars, 50 μm.) Quantification of YAP localization is shown on the Right. In each experiment 50 to 100 cells were evaluated (n = 3). YAP localization in the nucleus (green) or cytoplasm (red) is shown. (F) Scramble or targeted siRNA-treated rat vascular SMCs were subjected to cyclic stretch (n = 3). Representative immunostaining with YAP (green), phalloidin (red), and DAPI (blue). Two-way arrows indicate stretch direction. (Scale bars, 50 μm.) Quantification of YAP localization is shown on the Right. In each experiment 150 to 200 cells were evaluated (n = 3). qPCR data for confirming the knockdown of Itgαv, Itgβ1, and Itgβ3 are provided in SI Appendix, Fig. S10.
Fig. 5.
Fig. 5.
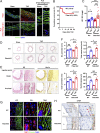
Thbs1 deficiency in mice results in aortic dissection under pressure overload. (A) Immunostaining of Thbs1 (red) in sham or TAC-operated aortas in WT mice (Top). PLA showing the interaction between Thbs1 and integrin β1 (red dots in Bottom). Right shows highly magnified images of white dashed boxes in Bottom. Arrowheads (white) show PLA cluster. DAPI (blue) and autofluorescence of elastin (green) are also shown. n = 3. (Scale bars, 50 μm.) (B) Kaplan-Meier survival curve for WT (n = 13) and Thbs1KO (n = 22) mice after TAC. *P = 0.043, long-rank test. (C) HW/BW in sham or TAC-operated mice. Bars are mean ± SEM. *P < 0.05, ***P < 0.001, quantification by the Kruskal–Wallis test with Dunn multiple comparisons is shown. The number of animals is indicated in each bar. (D) Hematoxylin and eosin staining of the ascending aortas for histological comparison between sham and TAC-operated aortas. (Scale bars, 100 μm.) (E) Aortic dissection was observed in Thbs1KO ascending aorta proximal to the constriction. (Scale bars, 100 μm.) (F) Morphometric analysis showing the IEL perimeter, outer perimeter, total vessel area, and wall thickness. Bars are mean ± SEM. *P < 0.05, ***P < 0.001, one-way ANOVA. NS: not significant. The number of animals is indicated in each bar. (G) Immunostaining of TAC-operated aortas with YAP (red) in WT and Thbs1KO mice. On the Right, highly magnified images of the white dashed boxes in the adventitial (Adv.) and medial (Med.) layers in the Left are shown. DAPI (blue) and autofluorescence of elastin (green) are also shown. n = 3. (Scale bars, 50 μm.) (H) Representative images of immunohistochemistry for CTGF in TAC-operated aortas of WT and Thbs1KO mice (n = 3 per genotype). The outer elastic lamella as a border between the medial layer and adventitia is shown by the green dashed line. Arrowheads (red) indicate CTGF-positive cells in the medial layer. (Scale bars, 100 μm.)
Fig. 6.
Fig. 6.
Thbs1 regulates YAP expression during neointima formation upon carotid artery ligation. (A) Diagram of LCA ligation. (B) Immunostaining of cross sections of ligated arteries with YAP (red) and Thbs1 (white) at 1 wk (n = 5), 2 wk (n = 5), and 3 wk (n = 4) after ligation in WT mice. DAPI (blue) and autofluorescence of elastin (green) are also shown. Quantification of colocalization with YAP and DAPI using Imaris colocalization software is indicated in yellow (number of nuclear YAP/total number of nuclei). (Scale bars, 50 μm.) (C) Quantification of colocalization between YAP and DAPI in B and E using Imaris colocalization software. Bars are mean ± SEM. **P < 0.01, ***P < 0.001, one-way ANOVA. (D) PLA showing cluster of Thbs1/integrin β1 (red dots, yellow arrowheads) at 3 wk after ligation in RCA and LCA. DAPI (blue) and autofluorescence of elastin (green) are also shown. (Scale bars, 50 μm.) n = 3. (E) Cross sections of ligated arteries at 3 wk postinjury in WT (n = 4), siThbs1-treated WT mice (n = 4), and Thbs1KO (n = 5) mice. Immunostaining with YAP (red), Thbs1 (white). DAPI (blue), and autofluorescence of elastin (green). Note neointima formation in WT arteries. Yellow arrowheads show nuclear localization of YAP. (Scale bars, 50 μm.)
Fig. 7.
Fig. 7.
A model illustrating the Thbs1/integrin/YAP signaling pathway in remodeling of vessel walls. Cyclic stretch induces secretion of Thbs1, which binds to integrin αvβ1 and aids in the maturation of the FA–actin complex, thereby mediating nuclear shuttling of YAP via inactivation of Rap2 and the Hippo pathway. In vivo, Thbs1/integrins/YAP signaling may lead to maturation of FA after TAC-induced pressure overload to protect the aortic wall. In contrast, Thbs1/integrins/YAP signaling leads to neointima (NI) formation upon flow cessation by carotid artery ligation. EL: elastic lamella.

Similar articles

Cited by

References

    1. Humphrey J. D., Dufresne E. R., Schwartz M. A., Mechanotransduction and extracellular matrix homeostasis. Nat. Rev. Mol. Cell Biol. 15, 802–812 (2014). - PMC - PubMed
    1. Engler A. J., Sen S., Sweeney H. L., Discher D. E., Matrix elasticity directs stem cell lineage specification. Cell 126, 677–689 (2006). - PubMed
    1. Klein E. A., et al. , Cell-cycle control by physiological matrix elasticity and in vivo tissue stiffening. Curr. Biol. 19, 1511–1518 (2009). - PMC - PubMed
    1. Sun Z., Guo S. S., Fässler R., Integrin-mediated mechanotransduction. J. Cell Biol. 215, 445–456 (2016). - PMC - PubMed
    1. Dupont S., et al. , Role of YAP/TAZ in mechanotransduction. Nature 474, 179–183 (2011). - PubMed

Publication types

MeSH terms