. 2020 Jun 24;82(6):745-753.
doi: 10.1292/jvms.20-0092. Epub 2020 Apr 22.

Expressions of vascular endothelial growth factor receptors, Flk1 and Flt1, in rat skin mast cells during development

Affiliations

Expressions of vascular endothelial growth factor receptors, Flk1 and Flt1, in rat skin mast cells during development

Miki Koh et al. J Vet Med Sci. .

Abstract

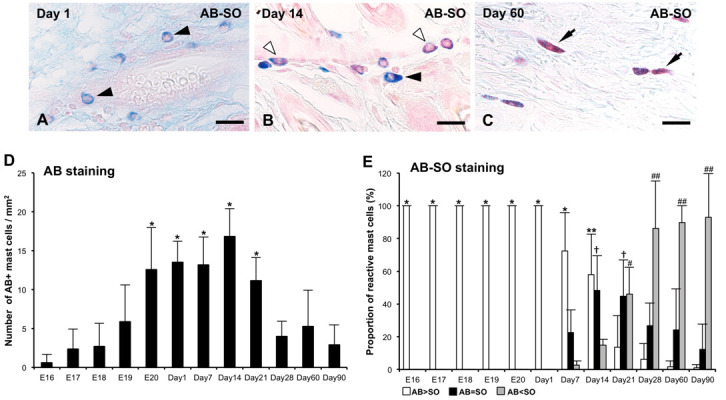
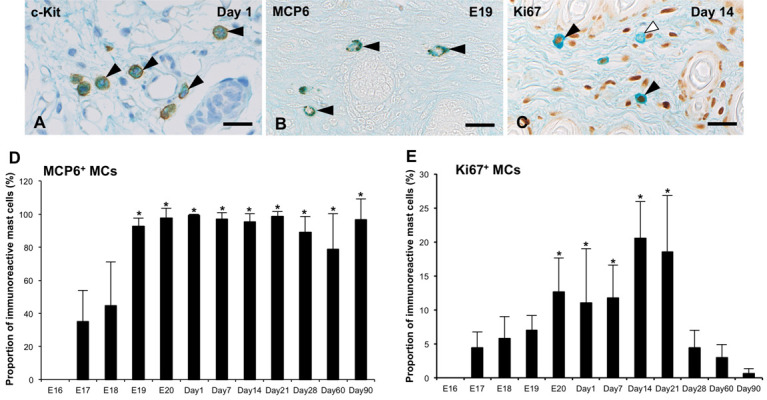
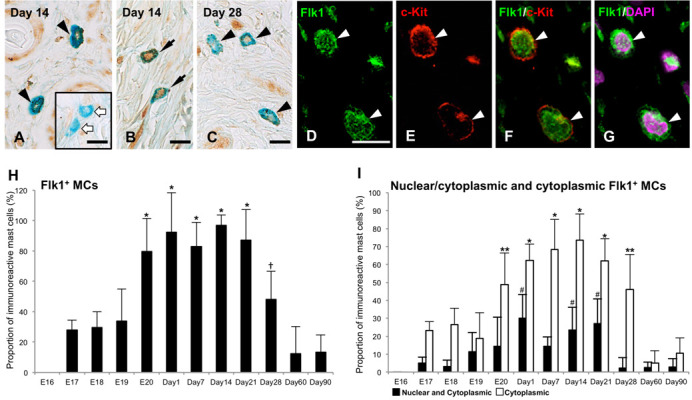
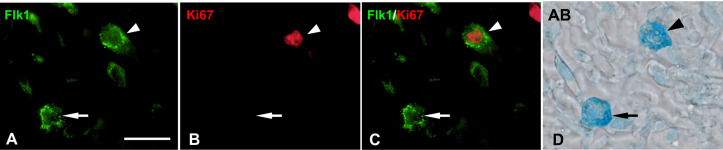
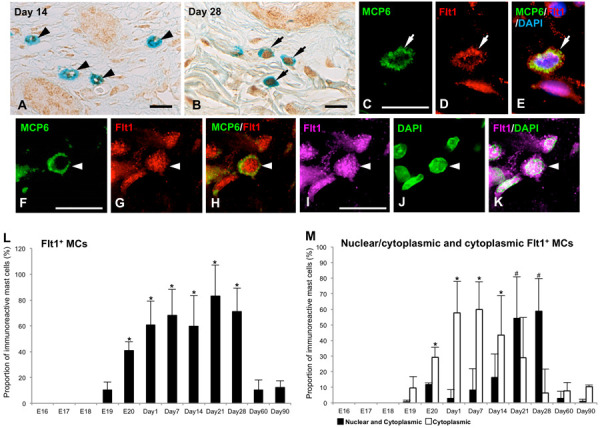
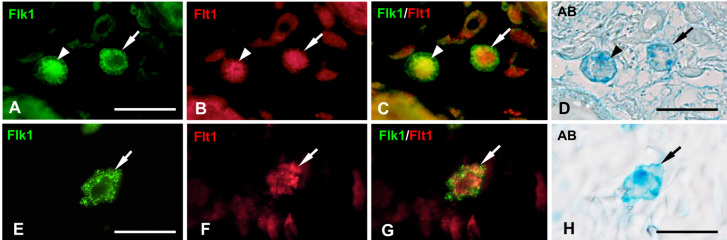
Vascular endothelial growth factor-A (VEGF-A) is a principal regulator of hematopoiesis as well as angiogenesis. However, the functions of VEGF-A and its receptors (VEGFRs) in the differentiation of mast cells (MCs) in the skin remain unclear. The aim of this study was to determine the expression patterns of two VEGFRs (Flk1 and Flt1) in the skin MCs during development and maturation in rats. From the 17th days of embryonic development (E17) to 1 day after birth (Day 1), most of skin MCs were immature cells containing predominant alcian blue (AB)+ rather than safranin O (SO)+ granules (AB>SO MCs). AB>SO MC proportions gradually decreased, while mature AB<SO MC proportions increased from Day 7 to 28. Flk1+ MC proportions increased from E20 and reached to approximately 90% from Day 1 to 21, thereafter decreased to about 10% at Day 60 and 90. Flk1+ MC proportions changed almost in parallel with the numbers of MCs and Ki67+ MC proportions from E17 to Day 90. The proportions of MCs with both nuclear and cytoplasmic Flt1-immunoreactivity were markedly increased at Day 28, when the proportions of nuclear Flk1+, Ki67+, and AB>SO MCs had significantly decreased, and AB<SO MC proportions significantly increased. Considering that the main function of Flt1 is suppression of Flk1 effects, our results indicated that cross-talk between Flk1 and Flt1 regulates the proliferation and maturation of the skin MCs during late embryonic and neonatal development in rats.

Keywords: Flk1; Flt1; mast cell; rat; vascular endothelial growth factor receptor.


Figures

Fig. 1.
Fig. 1.
Alcian blue (AB) -safranin O (SO) staining of skin mast cells (MCs) at 1 day after birth (Day 1) (A), Days 14 (B), and 60 (C). (A) Only AB>SO MCs (black arrowheads) are detected at Day 1. (B) Both AB>SO and AB=SO MCs (white arrowheads) are identified at Day 14. (C) ABµm (A–C). (D) Numbers of MCs identified as AB+ cells per 1 mm2 of the skin from 16 days of embryonic development (E16) to Day 90. Data are presented as means ± SD. *P<0.001 vs E16–18 and Days 28–90. (E) The proportions of AB>SO, AB=SO, and AB<SO MCs from E16 to Days 90 are presented as means ± SD. *P<0.001 vs Days 7–21; **P<0.001 vs Days 21–90; †P<0.001 vs Days 1 and 90; #P<0.001 vs Days 7; ##P<0.001 vs Days 7 and 14.
Fig. 2.
Fig. 2.
(A) c-Kit-immunoreactivity (black arrowheads) is detected in the cell membrane and/or cytoplasm of all alcian blue (AB) + MCs at 1 day after birth (Day 1). (B) MCP6-immunoreactivity (black arrowheads) is detected in the cytoplasm of all AB+ MCs at 19 days of embryonic development (E19). (C) Ki67-immunoreactivity (black arrowheads) is shown in the nucleus of several MCs at Day 14. White arrowheads denote Ki67-immunonegative MCs. Bar=20 µm (A–C). (D) The proportion of MCP6+ MCs from E16 to Day 90 are presented as means ± SD. *P<0.001 vs E17 and 18. (E) The proportion of Ki67+ MCs from E16 to Day 90 are presented as means ± SD. *P<0.001 vs E17 and Days 28–90.
Fig. 3.
Fig. 3.
Flk1-immunohistochemistry (IHC) in skin mast cells (MCs) at 14 days after birth (Day 14) (A, B and D–G) and Day 28 (C). (A and B) Flk1-immunoreactivity is detected both in the nucleus and cytoplasm (black arrows) or only in the cytoplasm (black arrowheads) of MCs at Day 14. White arrows denote Flk1-immunonegative MCs. (C) Flk1-immunoreactivity is detected only in the cytoplasm of MCs at Day 28. (D–G) Double-labeling IHC for Flk1 (green, D) and c-Kit (red, E) with DAPI (magenta) of skin MCs (white arrowheads) at Day 14. (F) Merged image of D and E confirms the presence of Flk1-immunoreactivity in c-Kit+ MCs. (G) Merged image of Flk1-IHC (green, D) and DAPI (magenta) reveals the localization of Flk1-immunoreactivity both in the cytoplasm and nucleus of the c-Kit+ MCs (white arrowheads). Bar=20 µm (A–G). (H) The proportions of Flk1+ MCs from 16 days of embryonic development (E16) to Day 90 are presented as means ± SD. *P<0.001 vs E17–19 and Days 60–90; †P<0.001 vs Days 60–90. (I) The proportions of nuclear/cytoplasmic and cytoplasmic Flk1+ MCs from E16 to Day 90 are presented as means ± SD. *P<0.001 vs E17–19 and Days 60–90; **P<0.001 vs Days 60–90; #P<0.001 vs E19-Day 14 and Days 28–90.
Fig. 4.
Fig. 4.
Double-labeling immunohistochemistry for Flk1 (green, A) and Ki67 (red, B) in alcian blue (AB)+ mast cells (MCs) (D) at 14 days after birth (A–D). (C) Merged image of A and B reveals the colocalization of cytoplasmic Flk1- and Ki67-immunoreactivities (white arrowhead). White arrows denote Flk1+Ki67 MCs. Black arrowhead and arrow in D represent same cells marked by white arrowheads and arrows in A–C, respectively. Bar=20 µm.
Fig. 5.
Fig. 5.
Flt1-immunohistochemistry (IHC) in skin mast cells (MCs) at 14 days after birth (Day 14) (A) and Day 28 (B). (A) Flt1-immunoreactivity is detected only in the cytoplasm in most of MCs (black arrowheads) at Day 14. (B) Flt1-immunoreactivity is detected both in the nucleus and cytoplasm in most of MCs (black arrows) at Day 28. (C–E) Double-labeling IHC for MCP6 (green, C) and Flt1 (red, D) with DAPI (blue) of the skin MCs (white arrows) at Day 14. (E) Merged image of C and D confirms the localization of Flt1-immunoreactivity in the cytoplasm of MCP6+ MCs (yellow). (F–K) Double-labeling IHC for MCP6 (green, F) and Flt1 (red, G; magenta, I) with DAPI (green, J) of the skin MCs (white arrowheads) at Day 28. (H and K) Merged images of F and G (H), and I and J (K) confirm the localization of Flt1-immunoreactivity both in the cytoplasm (yellow, H; magenta, K) and nucleus (red, H; white, K) of MCP6+ MCs. Bar=20 µm (A–K). (L) The proportions of Flt1+ MCs from 16 days of embryonic development (E16) to Day 90 are presented as means ± SD. *P<0.001 vs E19 and Days 60-90. (M) The proportions of nuclear/cytoplasmic and cytoplasmic Flt+ MCs from E16 to Day 90 are presented as means ± SD. *P<0.001 vs E19 and Days 28–90; #P<0.001 vs E19-Day 7 and Days 60–90.
Fig. 6.
Fig. 6.
Double-labeling immunohistochemistry (IHC) for Flk1 (green, A and E) and Flt1 (red, B and F) in alcian blue (AB)+ mast cells (MCs) (D and H) at 21 days after birth (Day 21) (A–D) and 28 (E–H). (C) Merged image of A and B reveals the colocalization of nuclear/cytoplasmic Flk1- and nuclear/cytoplasmic Flt-immunoreactivities (white arrowheads), or cytoplasmic Flk1- and nuclear/cytoplasmic Flt1-immunoreactivities (white arrows) in most of MCs at Day 21. (G) Merged image of E and F confirms the presence of only MCs showing colocalization of cytoplasmic Flk1- and nuclear/cytoplasmic Flt1-immunoreactivities (white arrows) at Day 28. (D) Black arrowheads and arrows represent same cells marked by white arrowheads and arrows in A–C, respectively. (H) Black arrow represents a same cell marked by white arrow in E–G. Bar=20 µm.

Similar articles

Cited by

References

    1. Andersson M. K., Göransson M., Olofsson A., Andersson C., Åman P.2010. Nuclear expression of FLT1 and its ligand PGF in FUS-DDIT3 carrying myxoid liposarcomas suggests the existence of an intracrine signaling loop. BMC Cancer 10: 249. doi: 10.1186/1471-2407-10-249 - DOI - PMC - PubMed
    1. Ahmed A., Dunk C., Kniss D., Wilkes M.1997. Role of VEGF receptor-1 (Flt-1) in mediating calcium-dependent nitric oxide release and limiting DNA synthesis in human trophoblast cells. Lab. Invest. 76: 779–791. - PubMed
    1. Bahramsoltani M., De Spiegelaere W., Janczyk P., Hiebl B., Cornillie P., Plendl J.2010. Quantitation of angiogenesis in vitro induced by VEGF-A and FGF-2 in two different human endothelial cultures-an all-in-one assay. Clin. Hemorheol. Microcirc. 46: 189–202. doi: 10.3233/CH-2010-1345 - DOI - PubMed
    1. Blazquez C., Cook N., Micklem K., Harris A. L., Gatter K. C., Pezzella F.2006. Phosphorylated KDR can be located in the nucleus of neoplastic cells. Cell Res. 16: 93–98. doi: 10.1038/sj.cr.7310012 - DOI - PubMed
    1. Burton A. L.1964. Histochemical studies on developing mast cells. Anat. Rec. 150: 265–269. doi: 10.1002/ar.1091500308 - DOI - PubMed

Substances