. 2020 Apr 22;11(1):1936.
doi: 10.1038/s41467-020-15714-x.

Lgr5+ telocytes are a signaling source at the intestinal villus tip

Affiliations

Lgr5+ telocytes are a signaling source at the intestinal villus tip

Keren Bahar Halpern et al. Nat Commun. .

Abstract

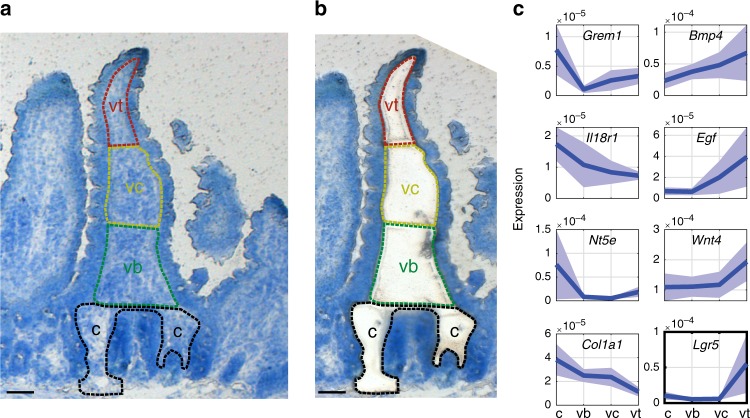
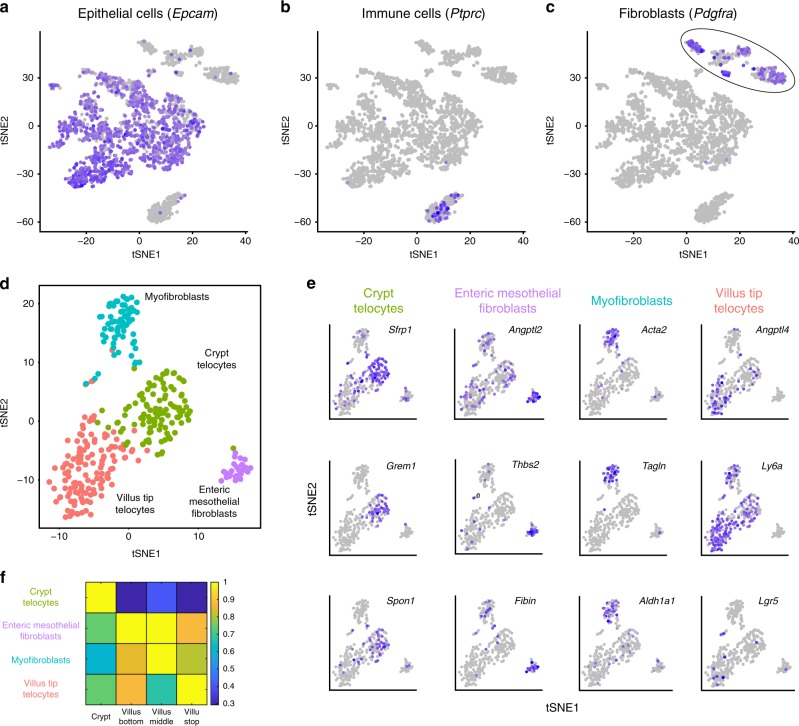
The intestinal epithelium is a structured organ composed of crypts harboring Lgr5+ stem cells, and villi harboring differentiated cells. Spatial transcriptomics have demonstrated profound zonation of epithelial gene expression along the villus axis, but the mechanisms shaping this spatial variability are unknown. Here, we combine laser capture micro-dissection and single cell RNA sequencing to uncover spatially zonated populations of mesenchymal cells along the crypt-villus axis. These include villus tip telocytes (VTTs) that express Lgr5, a gene previously considered a specific crypt epithelial stem cell marker. VTTs are elongated cells that line the villus tip epithelium and signal through Bmp morphogens and the non-canonical Wnt5a ligand. Their ablation is associated with perturbed zonation of enterocyte genes induced at the villus tip. Our study provides a spatially-resolved cell atlas of the small intestinal stroma and exposes Lgr5+ villus tip telocytes as regulators of the epithelial spatial expression programs along the villus axis.


Conflict of interest statement

The authors declare no competing interests.

Figures

Fig. 1
Fig. 1. Spatial transcriptomics of the intestinal stroma.
ab LCM of four zones along the crypt-villus axis before (a) and after (b) laser dissection. c–crypt, vb–villus bottom, vc–villus center, vt–villus tip. Scale bar–50 µm. c Representative spatial LCMseq expression profiles of stromal ligands and receptors zonated towards the crypt (left) or villus tip (right). Units are fraction of sample mRNA, patches are SEM.
Fig. 2
Fig. 2. Lgr5 is expressed abundantly in villus tip telocytes.
a smFISH of Lgr5, DAPI in blue, Scale bar–20 µm. b Blow up of villus tip, Scale bar–10 µm. In a, b thin white arrows point at autofluorescent blobs. c blow up of crypt, Scale bar–10 µm. Red arrows in bc point to Lgr5 positive cells. d Lgr5 mRNA (red dots) expressed in PDGFRa+ VTTs that co-express Bmp4 mRNA (green dots). Scale bar–10 µm. Red arrows point to Lgr5 and Bmp4 double positive cells. e Blow up of the region boxed in d. Scale bar–5 µm. f Lgr5 mRNA concentrations in VTTs are comparable to those in Lgr5+ crypt base columnar cells (n = 25 cells examined over 2 mice for each region). Boxes show 25–75 percentiles of the smFISH expression, horizontal red lines are medians. Whiskers, extend to the most extreme data point within 1.5× the interquartile range (IQR) from the box; g) Rspo3 mRNAs are localized on telopodes that extend away from the cell bodies of the VTTs. VTTs are marked by Lgr5 mRNA (red dots), Rspo3 mRNA (green dots) is localized away from the cell body, PDGFRa antibody mark VTTs cell bodies and telopodes. Scale bar–10 µm, in inset, green arrows point to Rspo3 mRNAs (green dots) localized on PDGFRa telopodes (blue). Telocyte cell body is marked by white dashed line. inset Scale bar–5 µm.
Fig. 3
Fig. 3. Lgr5 expression at the villus tip of Lgr5-knock-in mouse models.
a GFP fluorescence (green) observed in both crypt base columnar cells (CBCs) and VTTs in Lgr5–GFP-DTR mice. Scale bar–100 µm. b blow up of villus tip with GFP+ VTTs, scale bar–10 µm. c EGFP fluorescence of crypt base columnar cells in Lgr5-EGFP-IRES-creERT2 mice. Scale bar–10 µm. d EGFP fluorescence in VTTs. The Lgr5-EGFP knock-in construct is expressed in a patchy manner in the villus tip stroma. Scale bar–20 µm. Blow up shows Lgr5 mRNAs in red, EGFP mRNA in green and DAPI in blue. Scale bar–2 µm. Yellow blobs are autofluorescent elements.
Fig. 4
Fig. 4. Single cell transcriptomics of the intestinal stroma identifies four spatially-stratified mesenchymal cell populations.
ac tSNE plots of sequenced single cells highlighting the expression of Epcam, an epithelial marker (a), Ptprc, encoding CD45, a pan-immune marker (b) and Pdgfra (c) a mesenchymal marker. Purple hue indicates log expression levels. d tSNE plot of the Pdgfra+ cells from the cluster circled in c. Colors denote the identified four clusters, obtained by re-clustering the Pdgfra+ cluster cells in c. e tSNE plots colored by selected markers for the four mesenchymal cell clusters (see Supplementary Fig. 3 and Supplementary data 4 for the complete list of markers). Lgr5 is significantly enriched in the Villus Tip Telocytes (7 out of 10 Lgr5+ cells belong to the VTT cluster, hypergeometric p = 0.0121). f Summed expression of the top markers for each mesenchymal cell cluster in the LCMseq data, normalized by the maximum across zones (Methods).
Fig. 5
Fig. 5. VTTs implement a spatial switch from canonical to non-canonical Wnt signaling.
a Volcano plot demonstrating differential gene expression between VTTs and crypt telocytes. Black dots have q-values < 0.2 and expression fold change larger than 2 or smaller than ½. Wnt5a and Lgr5 are marked in red. b Spatial shift in the stroma from the expression of canonical Wnt2b (red dots, marked by red arrows) to non-canonical Wnt5a (green dots, marked by green arrows). Scale bar–20 µm. c Axin2 (red dots) is expressed broadly along the villus axis and repressed at the villus tip. Fos (green dots) is highly expressed in villus tip enterocytes. scale bar–20 µm. d E-Cadherin protein (gray), encoded by Cdh1 gene, is induced in villus tip enterocytes. Large blobs in bd are autofluorescent signals originating in immune cells. scale bar–30 µm.
Fig. 6
Fig. 6. VTT ablation perturbs enterocyte expression at the villus tip.
a GFP fluorescence (green) observed in both crypt base columnar cells (CBCs, white arrowheads) and VTTs in Lgr5–GFP-DTR mice. Inset on left shows a blow up of villus tip with GFP + VTTs (white arrow). b Both VTTs and CBCs are ablated 24 h after DT administration, as evident by the lack of GFP fluorescence. c GFP fluorescence re-appears in the crypt (white arrowheads) but not at the villus tip stroma 48 h after DT administration, indicating stable loss of VTTs. Inset on right shows a blow up of villus tip with no GFP+ VTTs. Green blobs are autofluorescent elements, also marked by green arrows. Scale bar in ac −100 µm, insets scale bar–10 µm. d Volcano plot demonstrating the changes in enterocyte gene expression 48 h following VTT ablation. Enterocyte villus tip genes that are reduced include Ada, Nt5e, and Slc28a2 (red), composing the purine metabolism immune-modullatory tip module. Black genes have q-values lower than 0.2 and max expression higher than 5 × 10−6 (Methods). e Enterocyte genes normally induced at the villus tip are reduced in expression 48 h following VTT ablation. Correlation between change in expression and expression zone—R = −0.53, p < 10−60. Enterocytes were classified into six villus zones as in Moor et al.. fh smFISH validations of enterocyte villus tip genes that are changed 48 h following VTT ablation—in each panel Ctrl-left, DT-right. f Cdh1. g Egfr. h Ada. Scale bar in fh −20 µm. i Quantification of smFISH experiments, demonstrating that key epithelial villus tip genes are repressed 48 h after VTT ablation (Egfr, Cdh1, Klf4, Fos, Ada, Nt5e, Slc28a2 p-values are indicated), whereas others remain unchanged (Creb3l3), p-values were calculated by two-sided Wilcoxon rank sum test. n = 30 cells examined over 2 mice. Boxes show 25–75 percentiles of the smFISH expression, horizontal red lines are medians, whiskers extend to the most extreme data point within 1.5× the interquartile range (IQR) from the box.
Fig. 7
Fig. 7. Analysis of the villus tip epithelial cells of Lgr5–GFP-DTR 3 weeks after VTT ablation shows correlation between the re-appearance of VTTs and the expression of enterocyte tip genes.
a smFISH example of Ada showing higher expression in the villus tip with VTTs compared to villus tip without VTTs after 3 weeks. Scale bar 10 µm. b smFISH example of Nt5e showing higher expression in the villus tip with VTTs compared to villus tip without VTTs after 3 weeks. Scale bar 10 µm. c Quantification of expression differences between villi with VTTs and villi without VTTs. Measurements were performed over 15 villi per mouse for two mice. Indicated p values were calculated by two-sided Wilcoxon rank sum test. Boxes show 25–75 percentiles of the smFISH expression, horizontal red lines are medians, whiskers extend to the most extreme data point within 1.5× the interquartile range (IQR) from the box.

References

    1. Flier LG vander, Clevers H. Stem cells, self-renewal, and differentiation in the intestinal epithelium. Annu. Rev. Physiol. 2009;71:241–260. doi: 10.1146/annurev.physiol.010908.163145. - DOI - PubMed
    1. Barker N, et al. Identification of stem cells in small intestine and colon by marker gene Lgr5. Nature. 2007;449:1003–1007. doi: 10.1038/nature06196. - DOI - PubMed
    1. Potten CS. Stem cells in gastrointestinal epithelium: numbers, characteristics and death. Philos. Trans. R. Soc. Lond. B. Biol. Sci. 1998;353:821–830. doi: 10.1098/rstb.1998.0246. - DOI - PMC - PubMed
    1. Moor, A. E. et al. Spatial reconstruction of single enterocytes uncovers broad zonation along the intestinal villus axis. Cell10.1016/j.cell.2018.08.063 (2018). - PubMed
    1. Beumer J, et al. Enteroendocrine cells switch hormone expression along the crypt-to-villus BMP signalling gradient. Nat. Cell Biol. 2018;20:909–916. doi: 10.1038/s41556-018-0143-y. - DOI - PMC - PubMed

Publication types