. 2020 Apr 22;11(1):1933.
doi: 10.1038/s41467-020-15821-9.

Consistent RNA sequencing contamination in GTEx and other data sets

Affiliations

Consistent RNA sequencing contamination in GTEx and other data sets

Tim O Nieuwenhuis et al. Nat Commun. .

Abstract

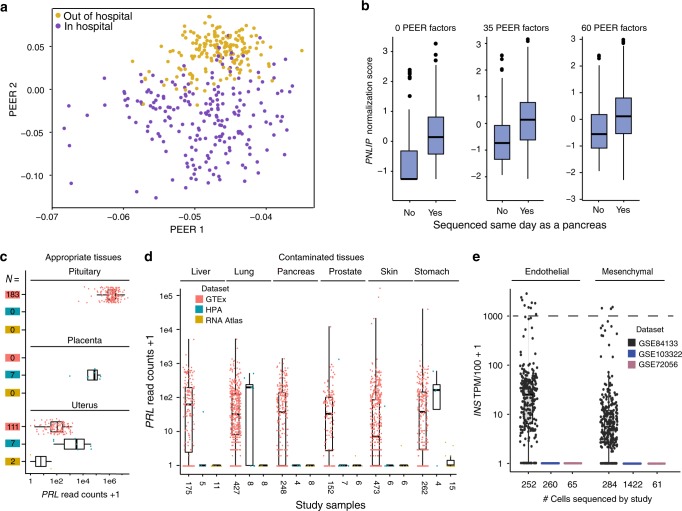
A challenge of next generation sequencing is read contamination. We use Genotype-Tissue Expression (GTEx) datasets and technical metadata along with RNA-seq datasets from other studies to understand factors that contribute to contamination. Here we report, of 48 analyzed tissues in GTEx, 26 have variant co-expression clusters of four highly expressed and pancreas-enriched genes (PRSS1, PNLIP, CLPS, and/or CELA3A). Fourteen additional highly expressed genes from other tissues also indicate contamination. Sample contamination is strongly associated with a sample being sequenced on the same day as a tissue that natively expresses those genes. Discrepant SNPs across four contaminating genes validate the contamination. Low-level contamination affects ~40% of samples and leads to numerous eQTL assignments in inappropriate tissues among these 18 genes. This type of contamination occurs widely, impacting bulk and single cell (scRNA-seq) data set analysis. In conclusion, highly expressed, tissue-enriched genes basally contaminate GTEx and other datasets impacting analyses.


Conflict of interest statement

The authors declare no competing interests.

Figures

Fig. 1
Fig. 1. Identification and explanation of sequencing contamination.
a A correlation heatmap of highly variable subcutaneous adipose tissue genes across 442 subjects. Blue to red scale shows Kendall’s tau correlation from −1 to 1. The genes within the contamination cluster and the sex cluster are given. The meaning of cluster A is unknown. Cluster B may relate to the percentage of smooth muscle cells and cluster C includes acute phase reactants. b Contamination normalized score values for non-pancreas tissue samples (N = 11,366) colored relative to being sequenced on the same day as a pancreas tissue. The solid black line denotes a Z score of 0. c Violin plot of the same data showing a strong, but not complete correlation of sequencing on a pancreas day. The solid line in all boxplots represents the median of the data, whereas the lower and upper hinges correspond to the 25th percentile and 75th percentile, respectively. The whiskers represent the interquartile range × 1.5, and any outliers beyond the whiskers are represented as dots. d Ranked order of all samples either sequenced on the same day as a pancreas sample (black) or on a non-pancreas sequencing day (colors) for PRSS1 read counts in log10. Among samples not sequenced on a pancreas day, 91% of samples with >100 reads were sequenced within 4 days of a known sequenced pancreas. The dashed line represents 100 reads. e Keratin 4 (KRT4) contaminating reads in GTEX-1’s fibroblast RNA-Seq appear to have originated from GTEX2 esophagus mucosa tissue. By DNA and RNA of the appropriate tissue source of KRT4, sample GTEX-1 is homozygous for the C allele at rs7956809. The fibroblast sample is 87% G reads, primarily matching sample GTEX2. The read count depth at the SNP in the GTEX-1 esophagus was 85,803 and 204 for the GTEX-1 fibroblast.
Fig. 2
Fig. 2. A cumulative distribution plot of 11,366 non-pancreas RNA-seq samples and their cumulative TPM expression of four pancreas genes.
The right shift in PRSS1 is consistent with it having the highest pancreas TPM expression.
Fig. 3
Fig. 3. Impact of PEER factors on contamination and differing contamination outcomes by study.
a The top two PEER factors separated in hospital from out of hospital deaths (N = 427). b With no PEER factor correction there is a significant increase in PNLIP expression normalized scores in lung samples if they were sequenced on the same day as a pancreas (no=96, yes=331; linear regression, p = 4.34e-14). After 35 (p = 1.38e-11) or 60 (p = 3.03e-06) PEER factor corrections, the difference remained. The solid line in all boxplots represents the median of the data, whereas the lower and upper hinges correspond to the 25th percentile and 75th percentile, respectively. The whiskers represent the interquartile range × 1.5, and any outliers beyond the whiskers are represented as dots. c Prolactin (PRL) read counts in pituitary (high), placenta (medium), and uterus (low), where PRL is known to be expressed across GTEx, HPA, and the RNA Atlas. The numbers in colored boxes indicate sample sizes and the color indicates respective study. d PRL contamination reads across six tissues from three studies that correlate with levels of likely contamination based on the other sequenced organs. e INS contamination across three scRNA-Seq data sets. Only in the pancreas data set (GSE84133), where beta cells were also sequenced, does INS appear to be lowly expressed in endothelial and mesenchymal cells. Cells with expression above the dotted line at 1000 TP10K are likely doublets or multiplets.

Similar articles

Cited by

References

    1. Lonsdale J, et al. The genotype-tissue expression (GTEx) project. Nat. Genet. 2013;45:580–585. doi: 10.1038/ng.2653. - DOI - PMC - PubMed
    1. Tomczak K, Czerwinska P, Wiznerowicz M. The Cancer Genome Atlas (TCGA): an immeasurable source of knowledge. Contemp. Oncol. 2015;19:A68–77. - PMC - PubMed
    1. Zeisel A, et al. Brain structure. Cell types in the mouse cortex and hippocampus revealed by single-cell RNA-seq. Science. 2015;347:1138–1142. doi: 10.1126/science.aaa1934. - DOI - PubMed
    1. Kumasaka N, Knights AJ, Gaffney DJ. Fine-mapping cellular QTLs with RASQUAL and ATAC-seq. Nat. Genet. 2016;48:206–213. doi: 10.1038/ng.3467. - DOI - PMC - PubMed
    1. Gutman DA, et al. MR imaging predictors of molecular profile and survival: multi-institutional study of the TCGA glioblastoma data set. Radiology. 2013;267:560–569. doi: 10.1148/radiol.13120118. - DOI - PMC - PubMed

Publication types